Comparative Study
. 2018 Jul;15(7):491-498.
doi: 10.1038/s41592-018-0015-1. Epub 2018 Jun 18.

A comparison of methods to assess cell mechanical properties

Affiliations
Comparative Study

A comparison of methods to assess cell mechanical properties

Pei-Hsun Wu et al. Nat Methods. 2018 Jul.

Abstract

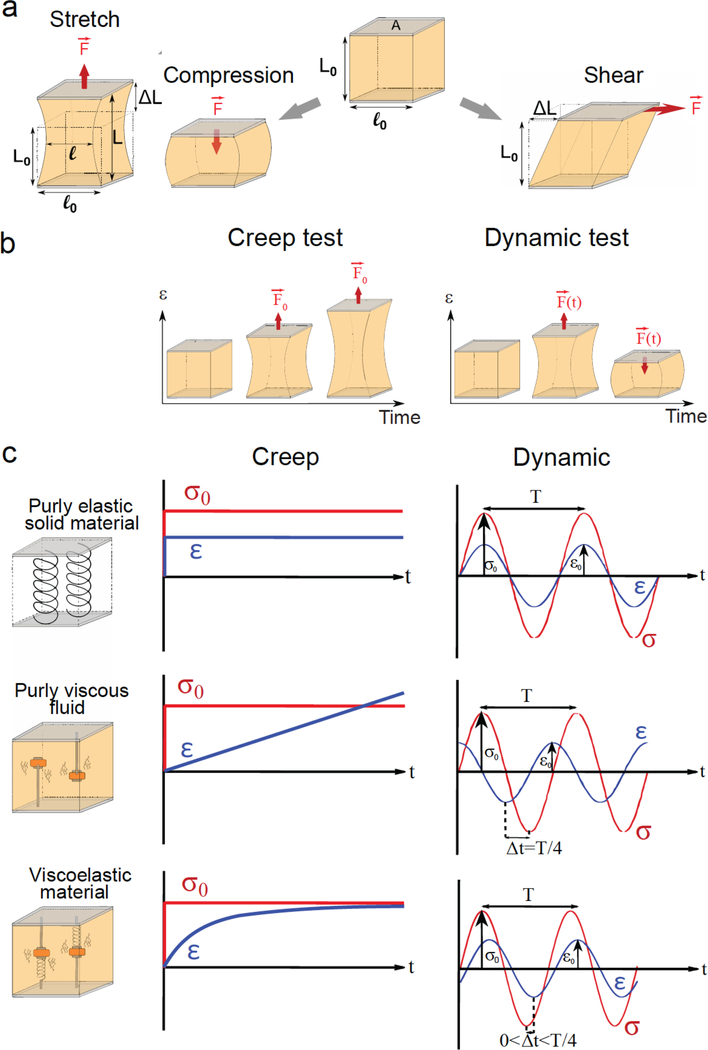
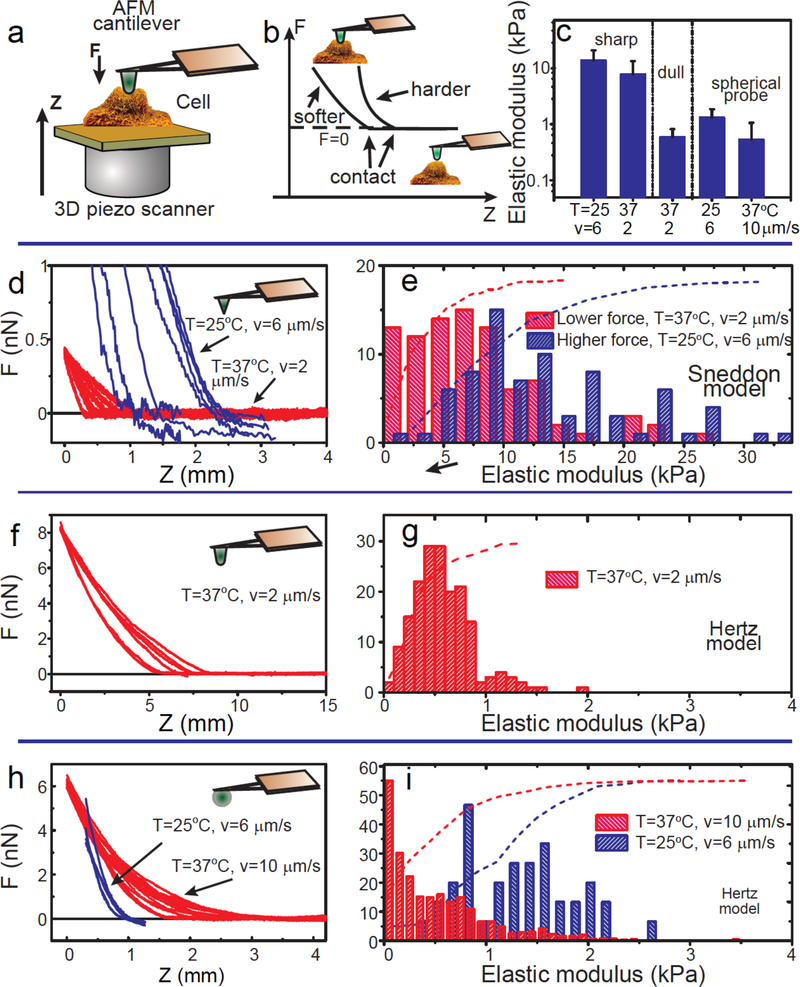
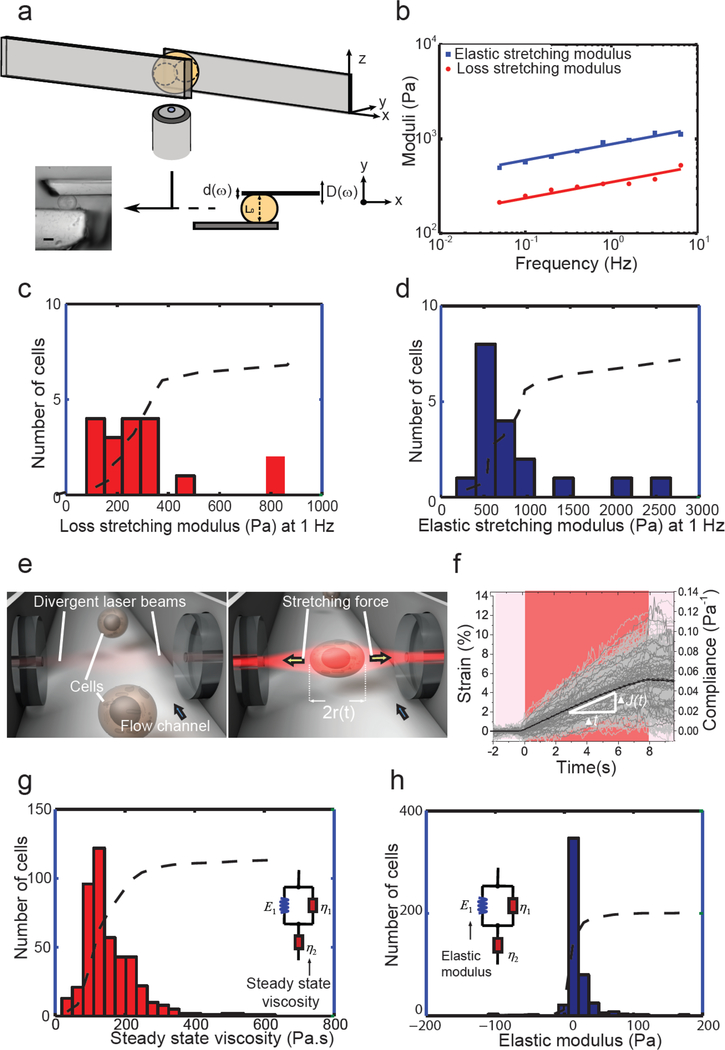
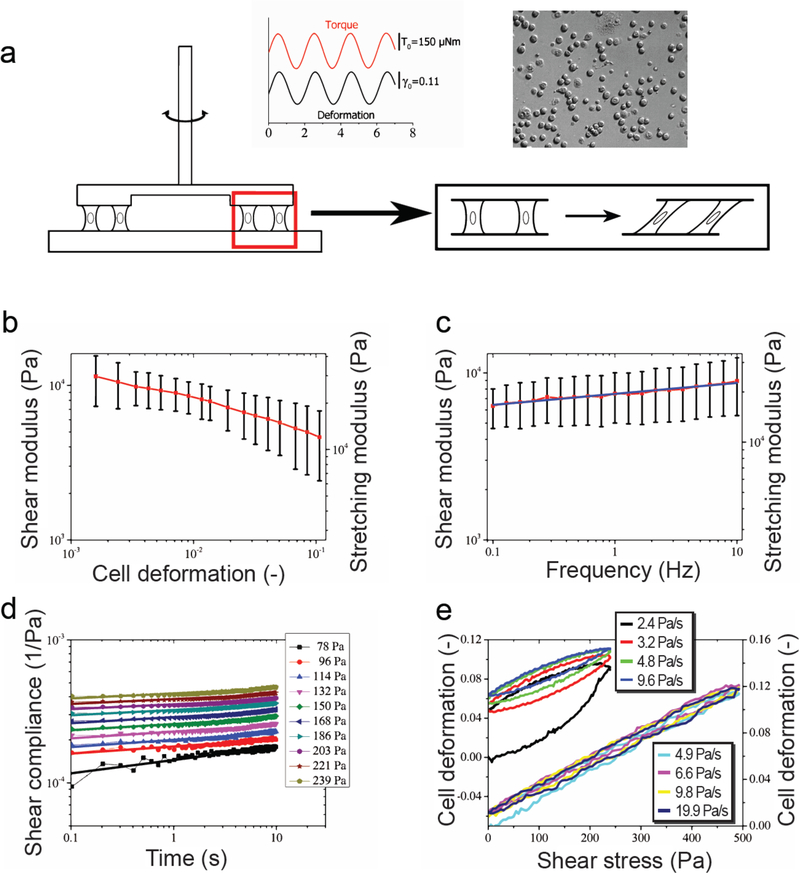
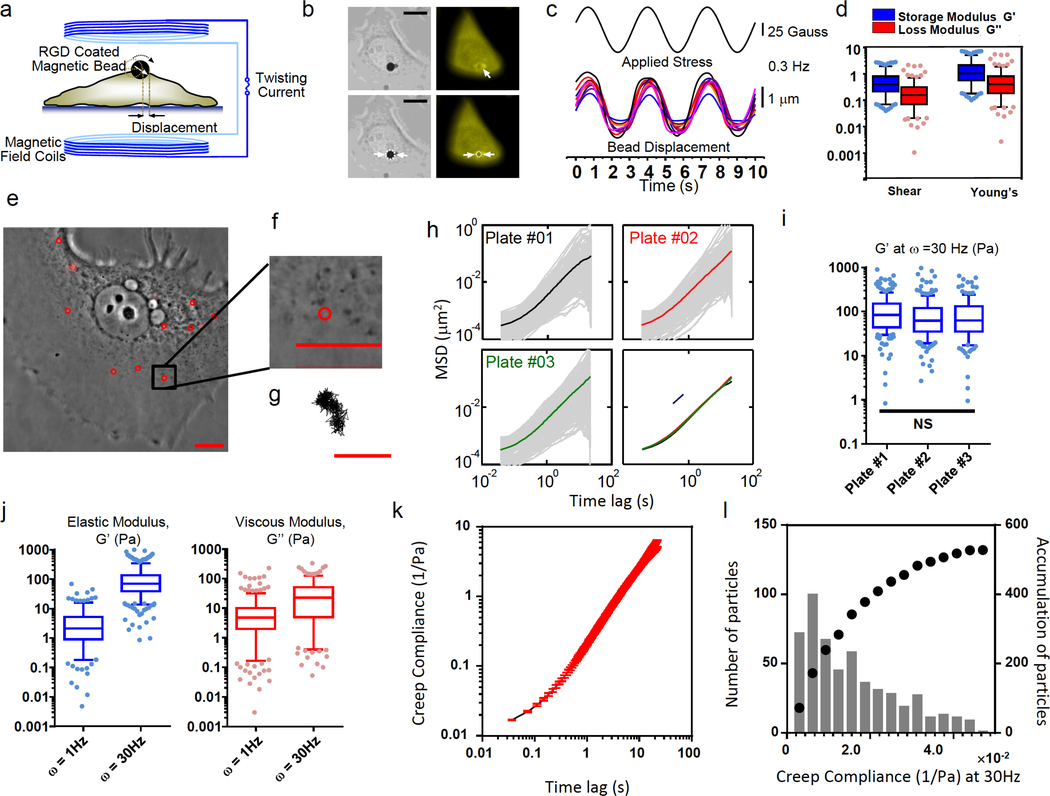
The mechanical properties of cells influence their cellular and subcellular functions, including cell adhesion, migration, polarization, and differentiation, as well as organelle organization and trafficking inside the cytoplasm. Yet reported values of cell stiffness and viscosity vary substantially, which suggests differences in how the results of different methods are obtained or analyzed by different groups. To address this issue and illustrate the complementarity of certain approaches, here we present, analyze, and critically compare measurements obtained by means of some of the most widely used methods for cell mechanics: atomic force microscopy, magnetic twisting cytometry, particle-tracking microrheology, parallel-plate rheometry, cell monolayer rheology, and optical stretching. These measurements highlight how elastic and viscous moduli of MCF-7 breast cancer cells can vary 1,000-fold and 100-fold, respectively. We discuss the sources of these variations, including the level of applied mechanical stress, the rate of deformation, the geometry of the probe, the location probed in the cell, and the extracellular microenvironment.


Figures

Figure 1:
Figure 1:. Description of rheological tests.
(a) Different geometries of deformation. To test the mechanical properties of a material, one can either stretch/compress it (left), or apply a mechanical shear stress (right). While stretching, deformation of the material results from applying a pulling force F perpendicular to the surface of the sample. For a surface of area A, the applied (normal) stress is given by σ = F/A, and the deformation (or strain) in the direction of the applied force is ε = ΔL/Lo, and ΔL = L-L0 is the sample elongation along the direction of stretching. Similarly, compression corresponds to a deformation (shortening) that results from applying a pushing force perpendicular to the surface area. In contrast, a shear test implies deformations that occur when the applied force is parallel (tangential) to the surface of the sample. (b) Constant or oscillating applied stress: A creep test consists in applying a constant stress F0/A overtime and recording the resulting deformation ε(t) of the sample (left). For a dynamic test, the applied force oscillates resulting in an oscillatory deformation of the sample (right). (c) Viscoelasticity: The mechanical response of any material can be described a combination of two ideal behaviors, those of an elastic solid and a viscous liquid. Purely elastic solids, like springs, deform instantaneously and in proportion to the applied force. In creep, the strain sets instantaneously to its equilibrium value εf. In dynamic tests, the deformation follows the oscillating applied stress, meaning that there is no phase shift between ε(t) and σ(t) signals. In both tests, the ratio between stress and strain is constant and corresponds to the elastic modulus E = σ/ε, which is expressed in Pascals (Pa),. E quantifies the rigidity of the material. Like springs, solids with high E are harder to deform. Purely viscous fluids, like water, will flow indefinitely when subjected to a creep test. The rate /dt at which the liquid flows under a given stress σ0 depends on its viscosity η, δε/δτ = σ0/η. In dynamic tests, the oscillating deformation is delayed compared to the applied oscillating stress, and the phase shift between ε(t) and σ(t) signals is Δt = T/4, where T is the period of the oscillations. The amplitudes of stress and strain are then related by σ = (2π)ε, where f = 1/T is the frequency of the oscillations. Thus (2π) has the dimension of a modulus, and quantifies the viscous response depending on the frequency of the test. Most materials are viscoelastic and share characteristics of both elastic solids and viscous liquids. Depending on the time scale (or, equivalently, on the frequency), the elastic or viscous-like behavior may dominate the response of such material. In dynamic tests, the phase shift between ε(t) and σ(t) will be between 0 and T/4. The response of the viscoelastic sample is then quantified through a complex modulus E* = E’ + i E”, allowing one to decouple the elastic-like contribution E’ (the in-phase component of the response) from the viscous-like component E” (phase shift Δt = T/4). In the particular example of the figure, E’ = E the elastic modulus of springs, and E”= 2π, where η is the viscosity of the surrounding liquid and f the frequency of the oscillations. Thus, at high frequency (short times) E” > E’ and the viscous behavior dominates, while at low frequency (long times) E’ > E” and the behavior is dominantly elastic, as observed from a creep test.
Figure 2.
Figure 2.. AFM measurements.
The measurements were conducted using sharp conical AFM probes, conospherical probes of radius 750nm, and spherical probes of radius 2500nm. (a) Schematics of the measurements of the cell mechanics. An AFM probe of well-defined geometry indents a cell along the vertical z-axis. (b) Force curves collected with AFM. Force F vs. vertical position z of the cell. Typical force curves for mechanically soft and hard samples are shown. (c) Average elastic moduli obtained with various AFM probes under different conditions (vertical indenting speed v and surrounding temperature T) are shown. The error bar indicates one standard deviation. (d, f, h) Raw AFM force data (F versus z) obtained with the sharp conical probes (d), the dull conospherical probe (semi-vertical angle ~22.5°) (f), and the spherical probes (h). (e, g, i) Corresponding histograms and cumulative probabilities of the elastic modulus obtained for indentation depths of 0–300nm. The appropriate models were used for each type of the AFM probes: the Sneddon model for the sharp conical probes (e), the Hertz model for the dull conospherical probe (g), and the spherical probes (i). Sample temperatures and indenting speeds are shown in the histograms. AFM measurements and measured cell sample size are summarized in Supplementary Table 2.
Figure 3.
Figure 3.. Whole-cell deformation measurements.
(a-d): cells between surfaces. (a) Schematic of the parallel-plates rheometer. An oscillating displacement D(ω) is applied at the basis of the flexible microplate and the resulting displacement d(ω) at the tip of this microplate is recorded. The force applied to the cell is proportional to the flexible plate deflection δ: F = . The picture represents a side view of an MCF7 cell between the microplates. Scale bar, 10 μm. (b) Elastic (E’, blue squares) and viscous (E”, red circles) extensional moduli as a function of frequency for a single MCF-7 cell in a log-log graph showing weak power-law behavior. (c and d) Distributions of viscous (c) and elastic (d) moduli (n = 18 cells). The mean values for viscous and elastic moduli were 340 ± 50 Pa and 950 ± 140 Pa, respectively. (e) Schematic of the OS: two diverging, counter-propagating laser beams emanating from single-mode optical fibers trap cells at low powers as they are being flowed into the trapping region using a microfluidic channel (left) and stretch them at higher powers (right). (f). Strain and compliance profiles for each cell measured in the OS. Cells (n = 514 cells) were trapped for 2 s at 0.2 W per fiber and stretched for 8 s (red portion of graph) at 0.75 W per fiber. The black curve shows average strain and compliance for the entire population. The average peak strain (at t = 8 s) was 5.16 ± 0.11%; the average peak compliance was 0.053 ± 0.001 Pa−1. The white triangle indicates a linear increase of strain, suggesting a dominant viscous behavior. (g) Distribution of steady-state viscosity obtained by fitting the compliance results for each cell to the so-called standard linear liquid model. The average steady-state viscosity was 158 ± 84 Pa.s. (h) Distribution of elastic moduli obtained from the standard linear liquid model fitting, where the average elastic modulus obtained was 18 ± 24 Pa. Dotted lines represent cumulative distributions.
Figure 4:
Figure 4:. Cell monolayer rheology.
(a) Schematic of the experimental setup. (b) Deformation-controlled amplitude sweep: the Young’s modulus exhibits a decrease in cell stiffness with increasing oscillation amplitude at a constant frequency of 0.5 Hz. (c) Frequency sweep: cell shear modulus increases with increasing frequency at a constant shear deformation of 0.02 as a power law with exponent β=0.065 (n = 8). Error bar represents standard deviation. (d) Creep experiments at different applied stress (insert). The creep compliances follow power laws. Exponents decrease with increasing stress from ~0.1 to 0.01 (data not shown). (e) Deformation-stress curves obtained from cyclic stress ramp experiments. We apply different rates of stress increase (insert). For low rates, the deformation-stress curves exhibit nonlinear hysteresis (left x-axis, upper curve), which vanishes at high rates (right x-axis, lower curve).
Figure 5.
Figure 5.. Bead-based measurements.
(a-d) Magnetic twisting cytometry (MTC). (a) Schematic of the MTC. Dashed line denotes the position of the bead before twisting; white arrow indicates the direction of the bead magnetic moment. (b) Quantification of magnetic bead embedment in MCF7 cells. The bead embedment (~30%) was estimated by measuring the actin ring diameter from the fluorescent image and comparing it to the bead diameter from the brightfield image (double arrows). Scale bar, 10 μm. (c) Continuous magnetic field of 50 Gauss with a stress modulation (17.5 Pa peak stress) and displacements of the magnetic beads as a function of cyclic forces (0.3 Hz). For visual clarity, only data from 10 representative beads out of a total of 193 beads are shown. (d) The box-and-whisker plot shows the elasticity of MCF-7 cell measured using MTC. (e-l) Particle tracking microrheology (PTM). (e) Representative MCF-7 phase contrast image with fluorescent beads after recovery. Scale bar, 15 μm. (f). Zoom-in image of a fluorescent bead (diameter, 100 nm) inside a cell. (g) Trajectory corresponding to the bead shown in panel f. Scale bar, 200 nm. (h) PTM is reproducible: 20 cells (>100 beads) were measured from each plate. Ensemble-averaged MSDs from three different cell-culture plates were identical (bottom right). (i) Two-sided Student t-test was applied on elastic modulus at 30 Hz measured from three different plates and showed there was no significant difference (p > 0.05). (j) The box-and-whisker plot shows distribution of elastic moduli of MCF-7 cells. (k) Creep compliance of MCF-7 cells calculated from the bead MSDs. l. Distribution of creep compliance (bars) and its cumulative distribution (dotted line). For box-and-whisker plots, center lines show the median values, edges of boxes is defined by 25 and 75 percentile value, whiskers show 5 and 95 percentile value, and dots show data points below or above 5 and 95 percentile value.

Similar articles

Cited by

References

    1. Lautenschlager F et al. The regulatory role of cell mechanics for migration of differentiating myeloid cells. Proceedings of the National Academy of Sciences of the United States of America 106, 15696–15701, doi:10.1073/pnas.0811261106 (2009). - DOI - PMC - PubMed
    1. Guck J et al. Optical deformability as an inherent cell marker for testing malignant transformation and metastatic competence. Biophys J 88, 3689–3698 (2005). - PMC - PubMed
    1. Wirtz D, Konstantopoulos K & Searson PC The physics of cancer: the role of physical interactions and mechanical forces in metastasis. Nat Rev Cancer 11, 512–522, doi:10.1038/nrc3080 (2011). - DOI - PMC - PubMed
    1. Lammerding J et al. Lamin A/C deficiency causes defective nuclear mechanics and mechanotransduction. The Journal of clinical investigation 113, 370–378, doi:10.1172/JCI19670 (2004). - DOI - PMC - PubMed
    1. Phillip JM, Aifuwa I, Walston J & Wirtz D The Mechanobiology of Aging. Annu Rev Biomed Eng 17, 113–141, doi:10.1146/annurev-bioeng-071114-040829 (2015). - DOI - PMC - PubMed

Publication types