. 2018 Jul;21(7):963-973.
doi: 10.1038/s41593-018-0167-4. Epub 2018 Jun 18.

The locus coeruleus drives disinhibition in the midline thalamus via a dopaminergic mechanism

Affiliations

The locus coeruleus drives disinhibition in the midline thalamus via a dopaminergic mechanism

B Sofia Beas et al. Nat Neurosci. 2018 Jul.

Abstract

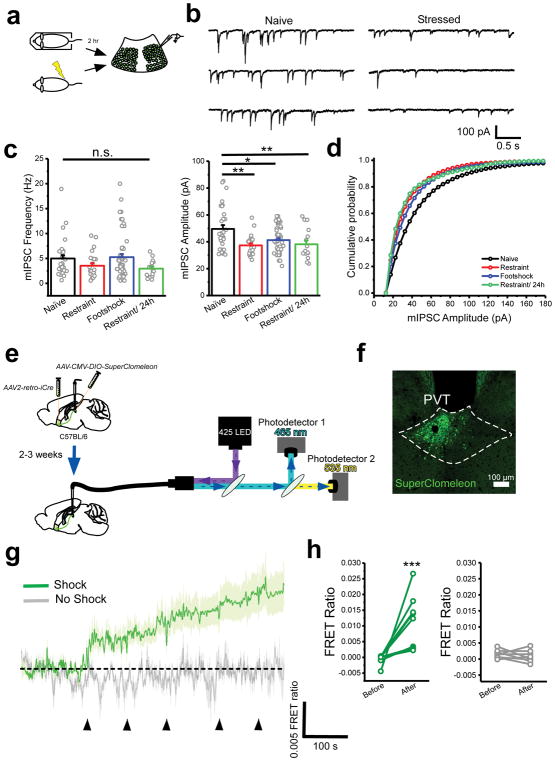
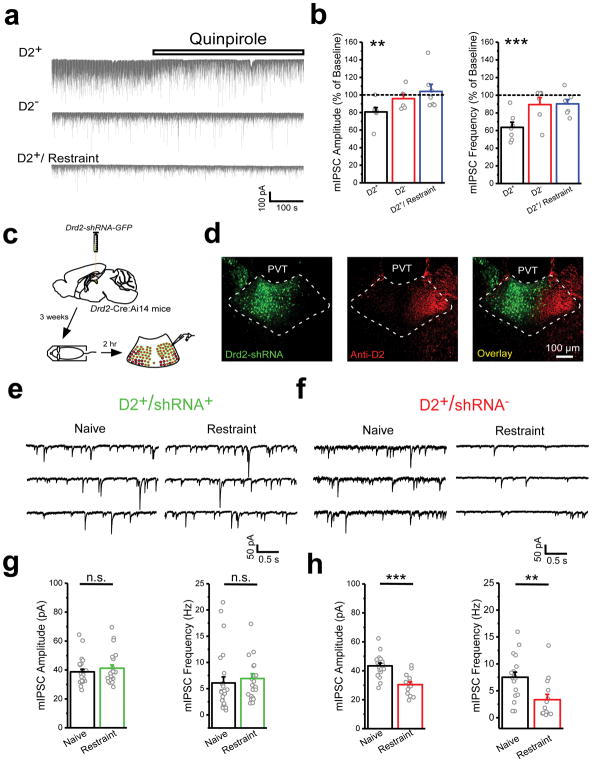
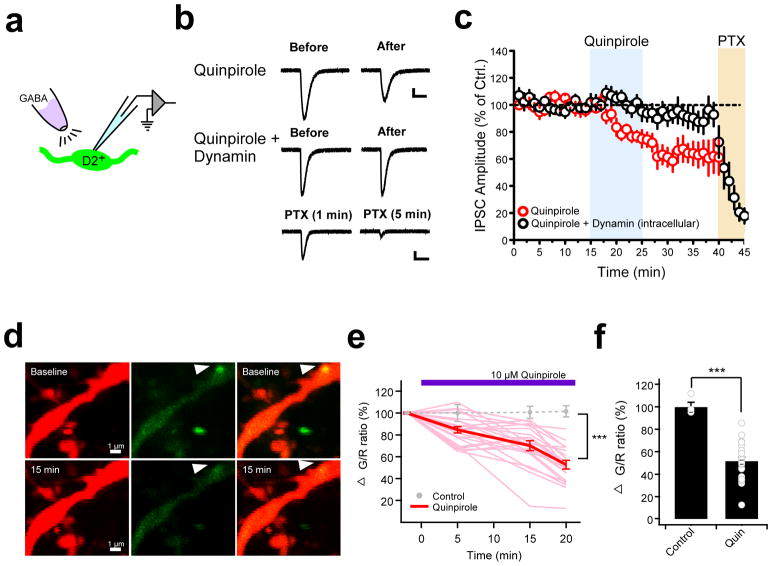
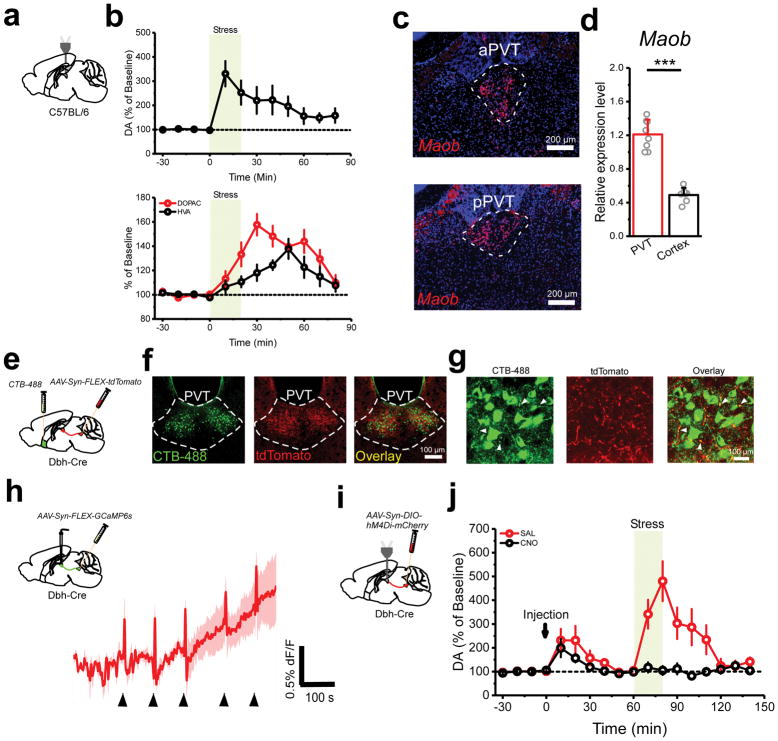
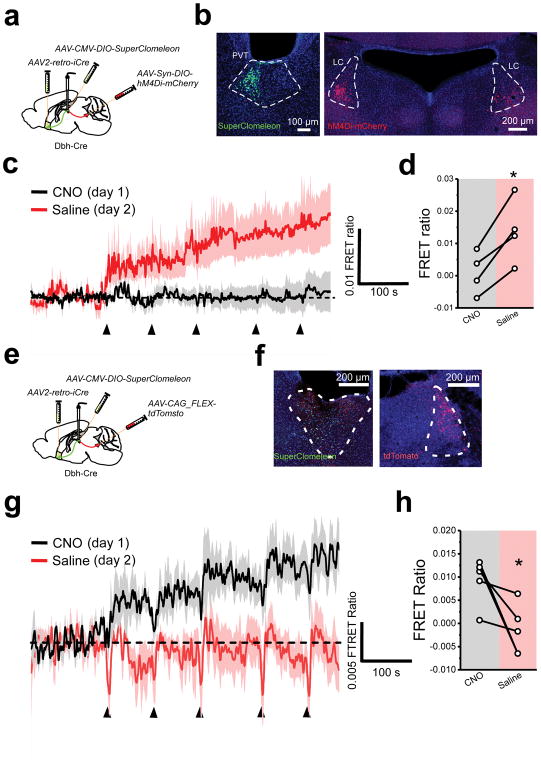
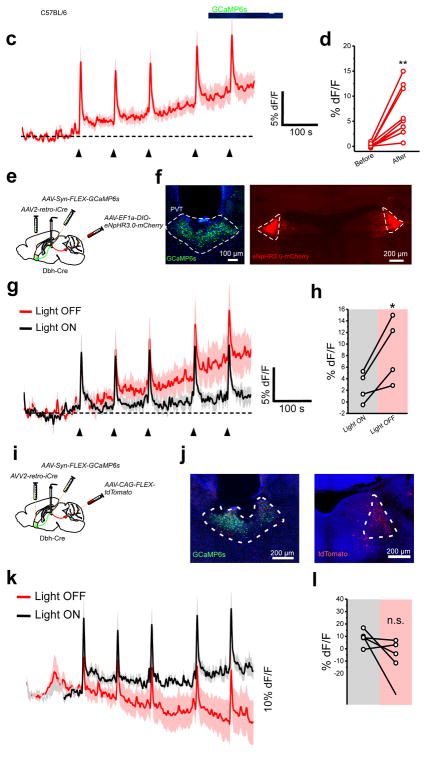
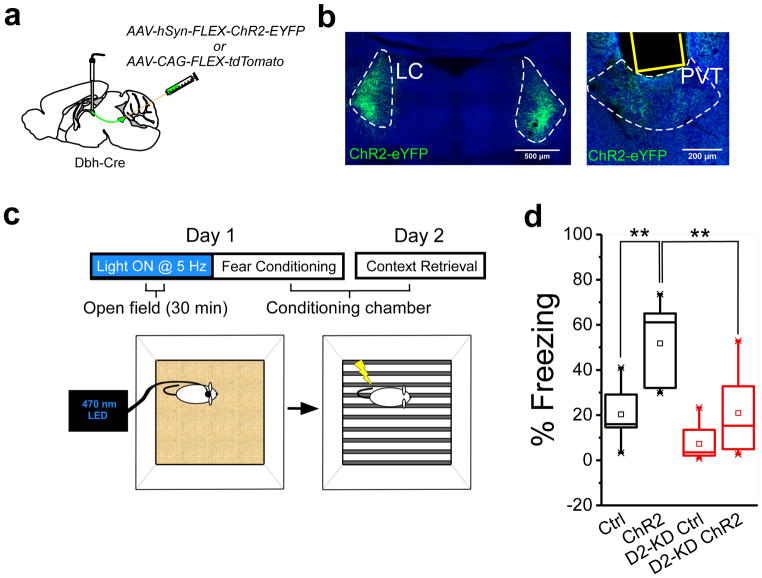
The paraventricular nucleus of the thalamus (PVT) is increasingly being recognized as a critical node linking stress detection to the emergence of adaptive behavioral responses to stress. However, despite growing evidence implicating the PVT in stress processing, the neural mechanisms by which stress impacts PVT neurocircuitry and promotes stressed states remain unknown. Here we show that stress exposure drives a rapid and persistent reduction of inhibitory transmission onto projection neurons of the posterior PVT (pPVT). This stress-induced disinhibition of the pPVT was associated with a locus coeruleus-mediated rise in the extracellular concentration of dopamine in the midline thalamus, required the function of dopamine D2 receptors on PVT neurons, and increased sensitivity to stress. Our findings define the locus coeruleus as an important modulator of PVT function: by controlling the inhibitory tone of the pPVT, it modulates the excitability of pPVT projection neurons and controls stress responsivity.


Conflict of interest statement

COMPETING INTERESTS

The authors declare no competing financial interests.

Figures

Figure 1
Figure 1. Synaptic inhibition in the pPVT rapidly decreases following stress
a. Schematic of the approach for individually assessing the effect of footshock and restraint stress on synaptic inhibition in D2+ neurons of the pPVT. b. Sample mIPSC traces obtained from D2+ neurons of naïve (left panels) and stressed (right panels) mice. c. Quantification of mIPSC amplitude (right) and frequency (left). Amplitude in pA, naïve, 49.55 ± 2.90, n = 31 neurons, 4 mice; restraint, 37.35 ± 1.50, n = 24 neurons, 4 mice; footshock, 41.30 ± 1.85, n = 51 neurons, 4 mice; restraint/24h, 38.15 ± 2.88, n = 16 neurons, 2 mice; F(3,97) = 5.80, one-way analysis of variance (ANOVA) followed by Tukey’s test. Group comparisons: naïve vs restraint, **P=0.0011; naïve vs footshock, *P=0.012; naïve vs restraint/24h **P=0.01. Frequency in Hz, naïve, 4.99 ± 0.67, n = 31 neurons; restraint, 3.54 ± 0.52, n = 24 neurons; footshock, 5.25 ± 0.65, n = 30 neurons; restraint/24h, 2.97 ± 0.42, n = 16 neurons; F(3,97) = 2.08, one-way ANOVA followed by Tukey’s test. Group comparisons: naïve vs restraint, non-significant P=0.50; naïve vs footshock, non-significant P=0.99; naïve vs restraint/24h non-significant P=0.31. d. Cumulative probability distribution of mIPSC amplitude. e. Schematic of the experimental design used for fiber photometry chloride imaging of NAc-projecting pPVT neurons. f. Representative image of SuperClomeleon expression in NAc-projecting neurons of the pPVT. g. Average SuperClomeleon response from NAc-projecting pPVT neurons in animals subjected to footshocks. Individual footshocks depicted by arrowheads. h. Average change in baseline fluorescence following footshock stress (left) and no shock (right) shown as FRET ratio x 10−3 (footshock: Before, −0.50 ± 0.51; After, 10.73 ± 2.84; **P=0.007, two-sided Paired sample t-test; no shock: Before, 1.48 ± 1.35; After, 1.52 ± 4.11; n = 9 mice; P=0.35, two-sided Paired sample t-test). Data shown as mean ± s.e.m.
Figure 2
Figure 2. Activation of D2-like dopamine receptors both mimics and is required for stress-induced downregulation of inhibitory transmission
a. Representative traces showing the effect of the D2-like agonist quinpirole (10 μM) on the amplitude and frequency of mIPSC recorded from D2+ (top) and D2 (middle) neurons of the pPVT of naïve mice, and D2+ neurons of the pPVT of restraint (bottom) mice. b. Percent of baseline of mIPSC amplitude (left) and frequency (right) following bath application of quinpirole in D2+ (black) and D2 (red) neurons of the pPVT of naïve mice, and D2+ neurons of the pPVT of restraint mice (blue). Amplitude percent of baseline, D2+, 80.71 ± 4.94, n = 7 neurons, 4 mice, **P=0.008, two-sided Paired sample t-test; D2, 95.77 ± 4.90, n = 6 neurons, 2 mice, P=0.43, two-sided Paired sample t-test; D2+/restraint, 104.01 ± 8.07, n = 7 neurons, 4 mice, P=0.64, two-sided Paired sample t-test. Frequency percent of baseline, D2+, 63.53 ± 5.87, n = 7 neurons, 4 animals, ***P=0.0008, two-sided Paired sample t-test; D2, 89.37 ± 7.87, n = 6 neurons, 6 animals, P=0.24, two-sided Paired sample t-test; D2+/restraint, 90.17 ± 4.78, n = 7 neurons, 4 animals, P=0.10, two-sided Paired sample t-test. c. Schematic of the experimental design used to determine the contribution of D2+ receptors of the pPVT to stress-induced reduction in GABAergic transmission. d. Representative images of Drd2-shRNA-GFP expression in the pPVT and immunohistochemical assessment of D2 protein via antibody staining (knockdown efficiency = 60% [See Methods]; n = 4 mice). e. Sample mIPSC traces obtained from shRNA-expressing D2+ neurons (D2+/shRNA+) of naïve (left panels) and stressed (right panels) knockdown mice. f. Sample mIPSC traces obtained from shRNA-negative D2+ neurons (D2+/shRNA) of naïve (left panels) and stressed (right panels) knockdown mice. g. Quantification of mIPSC amplitude (left) and frequency (right) from D2+/shRNA+ neurons. Amplitude in pA, naïve, 38.73 ± 1.79, n = 23 neurons, 4 mice; restraint, 42.27 ± 2.48, n = 25 neurons, 3 mice; non-significant, P=0.40; two-sided t-test. Frequency in Hz, naïve, 6.10 ± 1.15, n = 23 neurons, 4 mice; restraint, 7.54 ± 0.52, n = 25 neurons, 3 mice; non-significant, P=0.58; two-sided t-test. h. Quantification of mIPSC amplitude (left) and frequency (right) from D2+/shRNA neurons. Amplitude in pA, naïve, 43.41 ± 1.91, n = 18 neurons, 3 mice; restraint, 30.43 ± 1.94, n = 14 neurons, 3 mice; ***P=0.00005; two-sided t-test. Frequency in Hz, naïve, 7.52 ± 0.96, n = 18 neurons, 3 mice; restraint, 3.73 ± 0.99, n = 14 neurons, 3 mice; **P=0.006; two-sided t-test. Data shown as mean ± s.e.m.
Figure 3
Figure 3. Postsynaptic mechanisms contribute to stress-induced inhibitory plasticity in the pPVT
a. Schematic showing GABA puff experiment assessing postsynaptic involvement in quinpirole-induced GABAergic plasticity in D2+ neurons of the pPVT. b. Representative GABA-evoked responses from before and after bath application of quinpirole in the absence (top) and presence (middle) of intracellular dynamin. c. Average plot depicting the effect of quinpirole on GABA-evoked responses (n = 9, 6 mice). Note that the effect of quinpirole is prevented in neurons in which the dynamin inhibitory peptide (1 μM) was dialyzed through the patch pipette (n = 9, 4 mice). Bath application of picrotoxin (PTX) confirmed that postsynaptic responses were mediated by GABAA receptors. d. Representative two-photon images of a pPVT neuron dendrite expressing tdTomato (red, left) and Teal-gephyrin (green, middle) in both the absence (baseline, upper) and the presence (15 min, bottom) of 10 μM quinpirole. Arrowhead indicates a gephyrin-positive punctum whose fluorescence decreases following bath application of quinpirole. e. Changes in green/red (G/R) ratio at gephyrin puncta over time (light red, individual traces with quin; red, averaged trace with quin; gray circles, average without quinpirole). Difference between control and quinpirole: at 5 min P=0.051, at 15 min P=0.0046, and at 20 min P=0.000012; two-sided t-test. f. Summary bar graph of the change of G/R ratio before and 20 min after 10 μM quinpirole (Control: 100 ± 0.8%, n = 4 cells, 4 mice; Quinpirole: 52.8 ± 4.1%, n = 23 cells, 10 mice; ***P= 0.000012; two-sided t-test). Data shown as mean ± s.e.m.
Figure 4
Figure 4. The LC drives stress-evoked dopamine release in the pPVT
a. Schematic microdialysis of the pPVT following stress. Importantly, tail suspension stress was used instead of footshock or restraint due to technical limitations. b. Summary plot depicting stress-induced increases in the extracellular concentration of dopamine (DA) (top), as well as the dopamine metabolites 3,4-dihydrixyphenylatic acid (DOPAC) and homovanillic acid (HVA) in the pPVT (bottom) (n = 7 mice). c. Fluorescent in situ hybridization experiment showing the expression of monoamine oxidase B (Maob) mRNA in both the anterior PVT (aPVT) and the pPVT. d. Quantification of the relative expression levels of Maob mRNA in the PVT and in cortex (PVT, 1.21 ± 0.06; n = 8 mice; Cortex, 0.49 ± 0.03; n = 7 mice; P=0.0000002; two-sided t-test). e. Schematic of the experimental approach used to simultaneously label NAc-projecting neurons and LC neurons terminals in the pPVT. f. Representative images showing retrogradely labelled (CTB) NAc-projecting pPVT neurons in the same vicinity as anterogradely labeled (tdTomato) fibers from the LC. This experiment was independently repeated three times and similar results were obtained. g. High magnification of the pPVT showing putative synaptic contacts between CTB-labeled neurons and tdTomato-labelled LC afferents. This experiment was independently repeated three times and similar results were obtained. h. Average GCaMP6s response from the terminals of LC neurons in the pPVT of animals subjected to footshocks (n = 4 mice). i. Schematic of the approach utilized for combined chemogenetic silencing of the LC and microdialysis of the pPVT. j. Summary plot depicting stress-induced increases in the extracellular concentration of dopamine (DA) following CNO (black) and saline vehicle (red) I.P. injection in mice expressing hM4Di in LC (n = 7 mice, per group). Data shown as mean ± s.e.m.
Figure 5
Figure 5. The LC controls stress-induced inhibitory plasticity in the pPVT
a. Schematic of the stereotaxic injections for selectively expressing SuperClomeleon in NAc-projecting neurons of the pPVT and inhibitory DREADD (hM4Di) in catecholaminergic neurons of the LC using Dbh-Cre mice. b. Representative images showing successful expression of SuperClomeleon and hM4Di-mCherry in the desired targets. Assessment of viral expression was independently repeated four times for this experiment and similar results were obtained. c. Average SuperClomeleon response from NAc-projecting pPVT neurons in animals subjected to footshocks in the presence of CNO (day 1; black) or saline (day 2; red). Individual footshocks depicted by arrowheads. d. Average change in baseline fluorescence following footshock stress shown as FRET ratio x 10−3 (CNO, 0.90 ± 3.29; Saline, 13.90 ± 5.00; n = 4 mice; P=0.013; two-sided t-test). e. Schematic of the stereotaxic injections for selectively expressing SuperClomeleon in NAc-projecting neurons of the pPVT and tdTomato in catecholaminergic neurons of the LC using Dbh-Cre mice. f. Representative images showing successful expression of SuperClomeleon and tdTomato in the desired targets. Assessment of viral expression was independently repeated five times for this experiment and similar results were obtained. g. Average SuperClomeleon response from NAc-projecting pPVT neurons in animals subjected to footshocks in the presence of CNO (day 1; black) or Saline (day 2; red). Individual footshocks depicted by arrowheads. h. Average change in baseline fluorescence following footshock stress shown as FRET ratio x 10−3 (CNO, 9.27 ± 2.24; Saline, −1.47 ± 5.44; n = 5 mice; P=0.044; two-sided t-test). Data shown as mean ± s.e.m.
Figure 6
Figure 6. LC input to the pPVT amplify neural responses to stress
a. Schematic of viral vector injections and optical fiber implantation for GCaMP6 fiber photometry experiments. b. Representative image of GCaMP6s expression in NAc-projecting neurons of the pPVT and optical fiber placement. c. Average GCaMP6s response from NAc-projecting pPVT neurons in animals subjected to footshock stress. Individual footshocks depicted by arrowheads. d. Average change in baseline fluorescence following footshock stress in %dF/F (Before, 0.15 ± 0.13; After, 6.76 ± 1.57; n = 9 mice; P=0.003; two-sided Paired sample t-test). e. Schematic of the stereotaxic injections for selectively expressing GCaMP6s in NAc-projecting neurons of the pPVT and halorhodopsin in catecholaminergic neurons of the LC using Dbh-Cre mice. f. Representative images showing successful expression of GCaMP6s and halorhodopsin in the desired targets. Assessment of viral expression was independently repeated four times for this experiment and similar results were obtained. g. Average GCaMP6s response from NAc-projecting pPVT neurons in animals subjected to footshocks in the presence (black) and absence (red) of light stimulation. Individual footshocks depicted by arrowheads. h. Average change in baseline fluorescence following footshock stress in %dF/F (Light ON, 2.57 ± 1.32; Light OFF, 8.93 ± 2.84; n = 4 mice; P=0.038; two-sided t-test). i. Schematic of the stereotaxic injections for selectively expressing GCaMP6s in NAc-projecting neurons of the pPVT and tdTomato in catecholaminergic neurons of the LC using Dbh-Cre mice. j. Representative images showing successful expression of GCaMP6s and tdTomato in the desired targets. Assessment of viral expression was independently repeated four times for this experiment and similar results were obtained. k. Average GCaMP6s response from NAc-projecting pPVT neurons in animals subjected to footshocks in the presence (black) and absence (red) of light stimulation. Individual footshocks depicted by arrowheads. l. Average change in baseline fluorescence following footshock stress in %dF/F (Light ON, 8.85 ± 2.77; Light OFF, −8.48 ± 7.74; n = 5 mice; non-significant, P=0.10; two-sided t-test). Data shown as mean ± s.e.m.
Figure 7
Figure 7. Optogenetic stimulation of LC terminals in the pPVT prior to stress, enhances aversive memory formation
a. Schematic of ChR2-expressing viral vector injections and optical fiber implantation for optogenetic activation of ChR2+ LC fibers in the pPVT. b. Representative image of ChR2 expression in the LC of Dbh-Cre mice and ChR2+ terminals in the pPVT. Assessment of viral expression was independently repeated fourteen times for this experiment (7 mice with ChR2 and 7 mice with ChR2 + Drd2-shRNA) and similar results were obtained. c. Schematic of the experimental setup for optogenetic stimulation of LC terminals in the pPVT (5Hz for 30) prior to fear conditioning (5 shocks, 0.4 mA). Fear memory to the conditioning context was tested the following day for both ChR2+ and control mice. d. Summary plot of freezing behavior during the fear memory retrieval for both ChR2+ and control mice. Quantification of freezing behavior during the fear memory retrieval for both D2 receptor intact (black boxes) and D2 receptor knockdown (D2 KD; red boxes) mice subjected to optogenetic stimulation of LC terminals in the pPVT. Percent of freezing, Ctrl, 20.34 ± 4.57, n = 7 mice; ChR2, 51.77 ± 6.77, n = 7 mice; D2 KD-Ctrl, 17.24 ± 10.31, n = 7 mice; D2 KD-ChR2, 20.94 ± 7.01, n = 7 mice; F(3,24) = 11.36, two-way ANOVA followed by Tukey’s test. Group comparisons: Ctrl vs ChR2, **P=0.003; D2-KD Ctrl vs D2-KD ChR2, P=0.33; ChR2 vs D2-KD ChR2, **P=0.004. Box chart legend: box is defined by 25th, 75th percentiles, whiskers are determined by 5th and 95th percentiles, and mean is depicted by the square symbol. Data shown as mean ± s.e.m.

Comment in

References

    1. Vertes RP, Linley SB, Hoover WB. Limbic circuitry of the midline thalamus. Neurosci Biobehav Rev. 2015;54:89–107. doi: 10.1016/j.neubiorev.2015.01.014. - DOI - PMC - PubMed
    1. Hsu DT, Kirouac GJ, Zubieta JK, Bhatnagar S. Contributions of the paraventricular thalamic nucleus in the regulation of stress, motivation, and mood. Front Behav Neurosci. 2014;8:73. doi: 10.3389/fnbeh.2014.00073. - DOI - PMC - PubMed
    1. Penzo MA, et al. The paraventricular thalamus controls a central amygdala fear circuit. Nature. 2015;519:455–459. doi: 10.1038/nature13978. - DOI - PMC - PubMed
    1. Do-Monte FH, Quinones-Laracuente K, Quirk GJ. A temporal shift in the circuits mediating retrieval of fear memory. Nature. 2015;519:460–463. doi: 10.1038/nature14030. - DOI - PMC - PubMed
    1. Zhu Y, Wienecke CF, Nachtrab G, Chen X. A thalamic input to the nucleus accumbens mediates opiate dependence. Nature. 2016;530:219–222. doi: 10.1038/nature16954. - DOI - PMC - PubMed

Publication types

LinkOut - more resources