. 2018 Jun 18;9(1):2360.
doi: 10.1038/s41467-018-04692-w.

Global probabilistic projections of extreme sea levels show intensification of coastal flood hazard

Affiliations

Global probabilistic projections of extreme sea levels show intensification of coastal flood hazard

Michalis I Vousdoukas et al. Nat Commun. .

Abstract

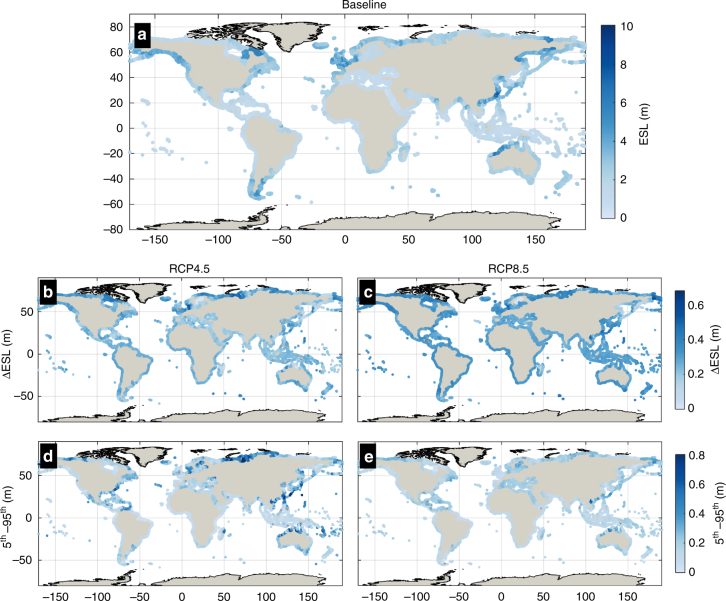
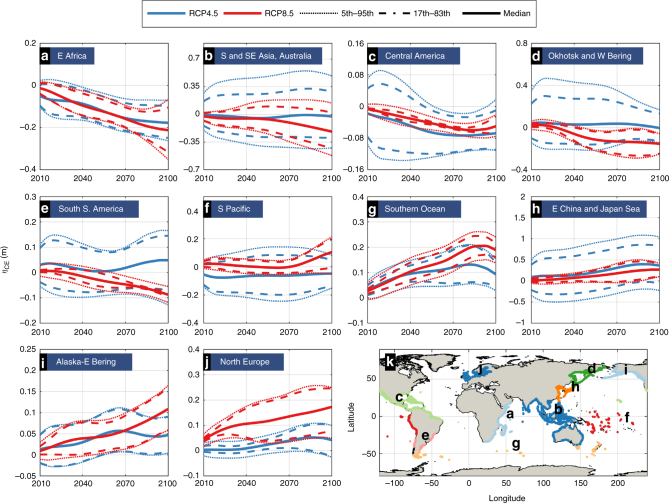
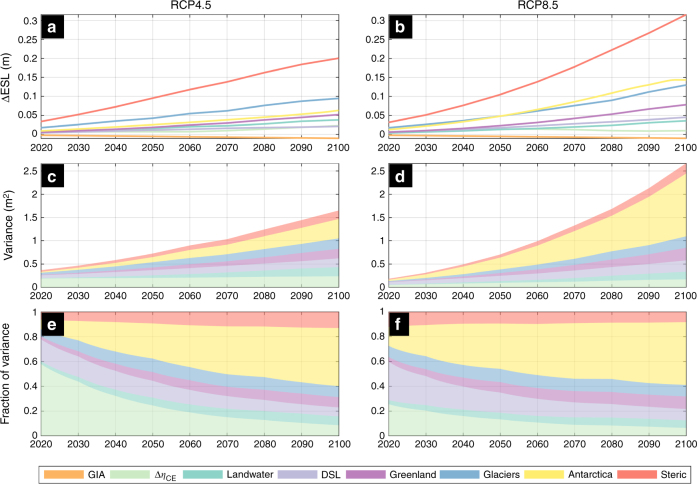
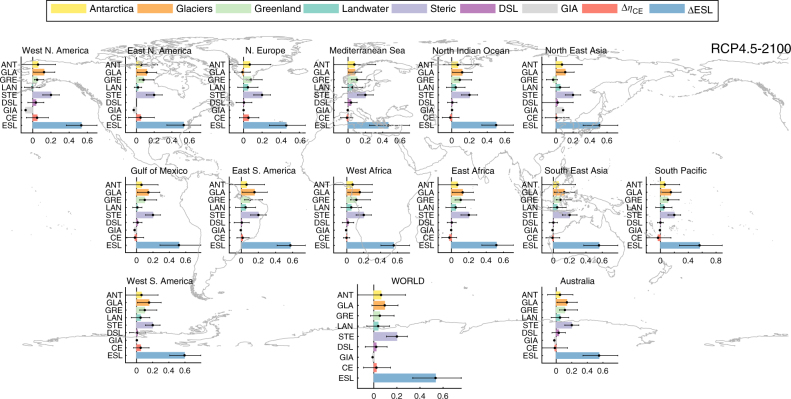
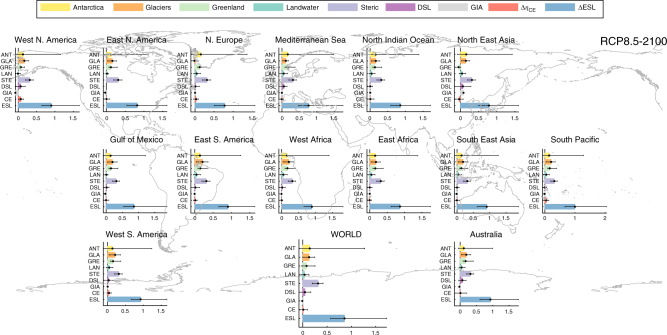
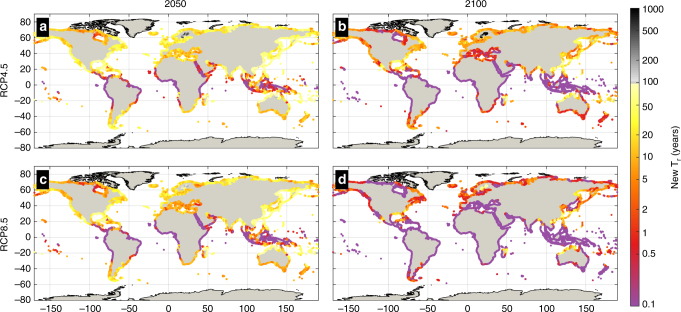
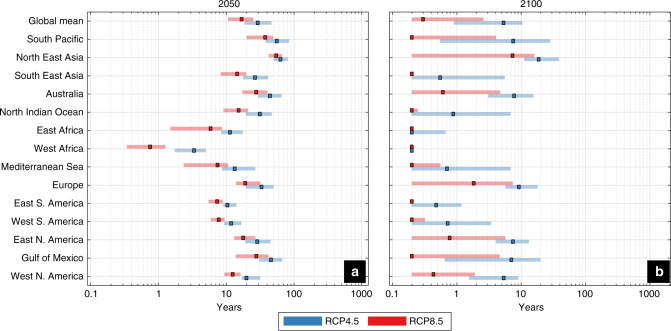
Global warming is expected to drive increasing extreme sea levels (ESLs) and flood risk along the world's coastlines. In this work we present probabilistic projections of ESLs for the present century taking into consideration changes in mean sea level, tides, wind-waves, and storm surges. Between the year 2000 and 2100 we project a very likely increase of the global average 100-year ESL of 34-76 cm under a moderate-emission-mitigation-policy scenario and of 58-172 cm under a business as usual scenario. Rising ESLs are mostly driven by thermal expansion, followed by contributions from ice mass-loss from glaciers, and ice-sheets in Greenland and Antarctica. Under these scenarios ESL rise would render a large part of the tropics exposed annually to the present-day 100-year event from 2050. By the end of this century this applies to most coastlines around the world, implying unprecedented flood risk levels unless timely adaptation measures are taken.


Conflict of interest statement

The authors declare no competing interests.

Figures

Fig. 1
Fig. 1
Flow diagram showing the procedure to generate the ESL projections. Key: HTWL; high tide water level; ηCE, water level due to climate extremes; PDF, probability density function; EVA, extreme value analysis; RSLR, relative sea-level rise; SAL, self-attraction and loading of the ocean upon itself due to the long term alteration of ocean density changes; STR, steric sea-level change; DSL, dynamic sea-level change; GLA, surface mass balance of ice from glaciers and ice-caps; GRE/ANT, surface mass balance and ice dynamics of Greenland/Antarctic ice sheets; LW, land-water storage and; GIA, Glacial Isostatic Adjustment
Fig. 2
Fig. 2
Present global ESLs, changes in view of climate change and uncertainty. Maps show the median present-day 100-year ESL (a) and the projected changes in ESL100 expressed by the median and the very likely range under RCP4.5 (b, d) and RCP8.5 (c, e) by 2100
Fig. 3
Fig. 3
Present contributions of climate extremes (wind-waves and storm surges) to global ESLs (ηCE) and projected changes. Maps show the median present-day 100-year ηCE (a) and projected changes (ΔηCE) under RCP4.5 by 2050 (b) and 2100 (c), and under RCP8.5 by 2050 (d) and 2100 (e). Warm/cold colors express an increase/decrease, respectively, while points with high uncertainty are shown in gray (|CV| > 1)
Fig. 4
Fig. 4
Regional projected changes in the contributions of climate extremes (wind-waves and storm surges) to global ESLs (ηCE). Time series of the projected change in 100-year ηCE under RCP4.5 (blue) and RCP8.5 (red). The geographical regions are highlighted in k. Heavy: median, dotted: 5–95th percentiles (very likely) and dashed: 17–83th percentiles (likely)
Fig. 5
Fig. 5
Break-down of projected ESL contributions and of their uncertainty. Projected increase of the 100-year ESL from changes in climate extremes, the high tide water level, as well as from SLR contributions from Antarctica, land-water, Greenland, glaciers, dynamic sea level (DSL), glacial isostatic adjustment (GIA), and steric-effects (a, b); variance (in m2) in components (c, d) and fraction of components’ variance in global ESL change (e, f); under RCP4.5 (a, c, e) and RCP8.5 (b, d, f). Colors represent different components as in the legend and values express the global mean of the median
Fig. 6
Fig. 6
Break-down of projected changes in ESL components, under RCP4.5 in 2100. Projected changes in ESL contributions from Antarctica (ANT), glaciers (GLA), Greenland (GRE), land-water (LAN), steric-effects (STE), dynamic sea level (DSL), glacial isostatic adjustment (GIA), climate extremes (CE), as well as the combined 100-year ESL. Bars express the median values, black error lines the 5 and 95% quantiles. Values shown are expressed in m and reflect spatial averages for 14 regions and worldwide
Fig. 7
Fig. 7
Break-down of projected changes in ESL components under RCP8.5 in 2100. Projected changes in ESL contributions from Antarctica (ANT), glaciers (GLA), Greenland (GRE), land-water (LAN), steric-effects (STR), dynamic sea level (DSL), glacial isostatic adjustment (GIA), climate extremes (CE), as well as the combined 100-year ESL. Bars express the median values, black error lines the 5 and 95% quantiles. Values shown are expressed in m and reflect spatial averages for 14 regions and worldwide
Fig. 8
Fig. 8
Future frequency of the present day 100-year ESL. Colors show the return period of the present day 100-year ESL under RCP4.5 and RCP8.5 in 2050 (ac) and 2100 (b, d), based on the median values. Note that the color scale is not linear
Fig. 9
Fig. 9
Future frequency of the present day 100-year ESL along 14 geographical regions. Return period of the present day 100-year ESL under RCP4.5 and RCP8.5 in 2050 (a) and 2100 (b). Colored boxes express the median and colored patches the 5 and 95% quartiles. The values shown are averages along the global coastline as well as along the coasts of 14 geographical regions

References

    1. Vitousek S, et al. Doubling of coastal flooding frequency within decades due to sea-level rise. Sci. Rep. 2017;7:1399. doi: 10.1038/s41598-017-01362-7. - DOI - PMC - PubMed
    1. Wahl T, et al. Understanding extreme sea levels for broad-scale coastal impact and adaptation analysis. Nat. Commun. 2017;8:16075. doi: 10.1038/ncomms16075. - DOI - PMC - PubMed
    1. Muis S, Verlaan M, Winsemius HC, Aerts JCJH, Ward PJ. A global reanalysis of storm surges and extreme sea levels. Nat. Commun. 2016;7:11969. doi: 10.1038/ncomms11969. - DOI - PMC - PubMed
    1. Mentaschi L, Vousdoukas MI, Voukouvalas E, Dosio A, Feyen L. Global changes of extreme coastal wave energy fluxes triggered by intensified teleconnection patterns. Geophys. Res. Lett. 2017;44:2416–2426.
    1. Vousdoukas, M. I., Mentaschi, L., Voukouvalas, E., Verlaan, M. & Feyen, L. Extreme sea levels on the rise along Europe’s coasts. Earth’s Future5, 304–323 (2017).

Publication types

LinkOut - more resources