. 2018 Jun 19;7(6):47.
doi: 10.1038/s41389-018-0059-1.

Platelet-derived growth factor receptor-α and -β promote cancer stem cell phenotypes in sarcomas

Affiliations

Platelet-derived growth factor receptor-α and -β promote cancer stem cell phenotypes in sarcomas

Kevin K Chang et al. Oncogenesis. .

Retraction in

Abstract

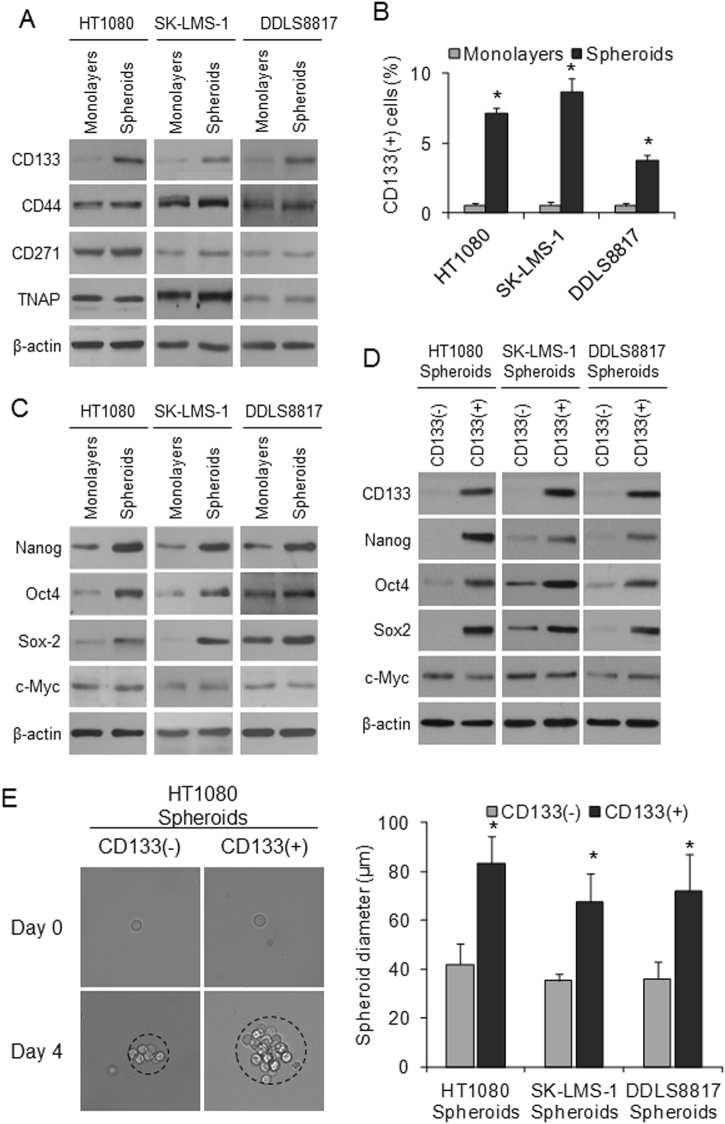
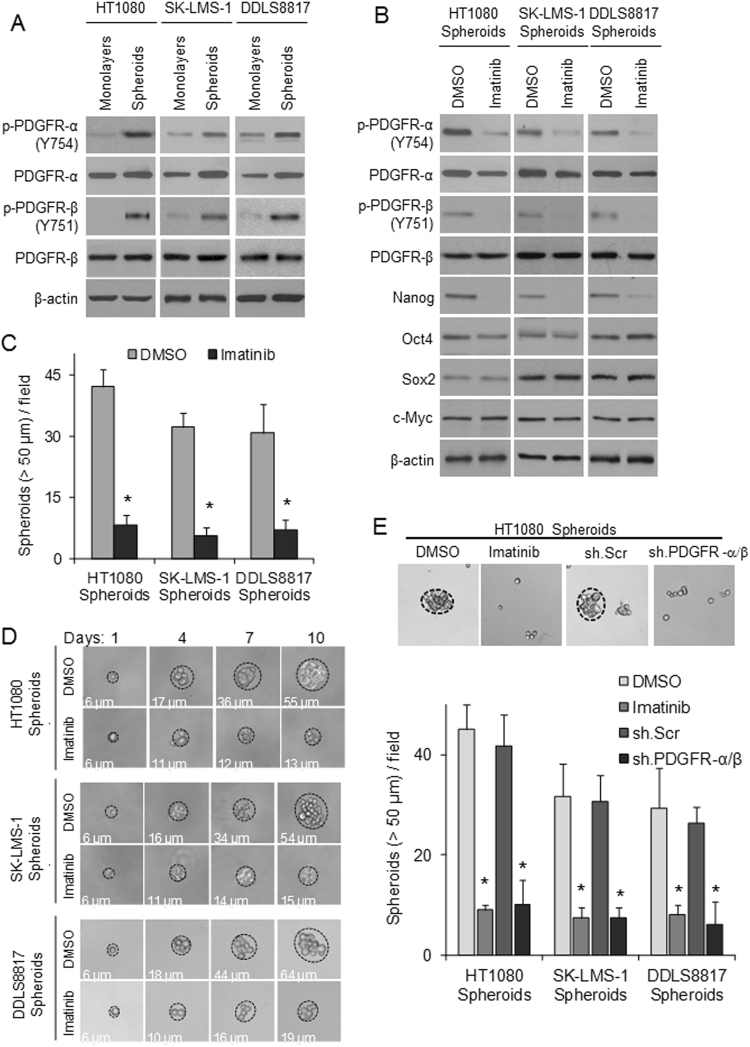
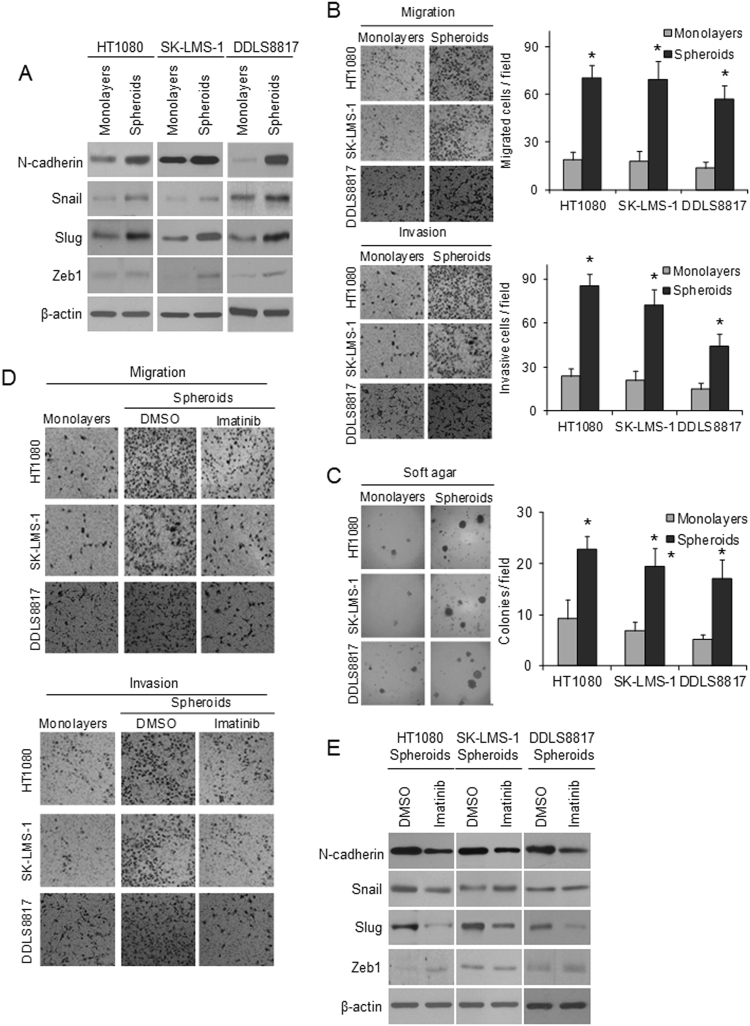
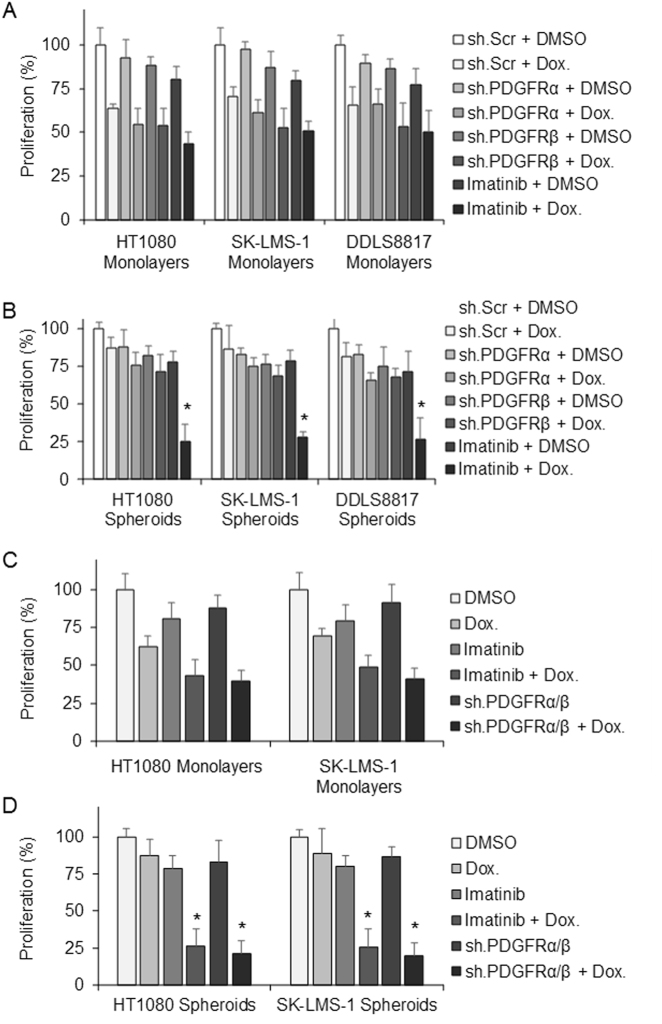
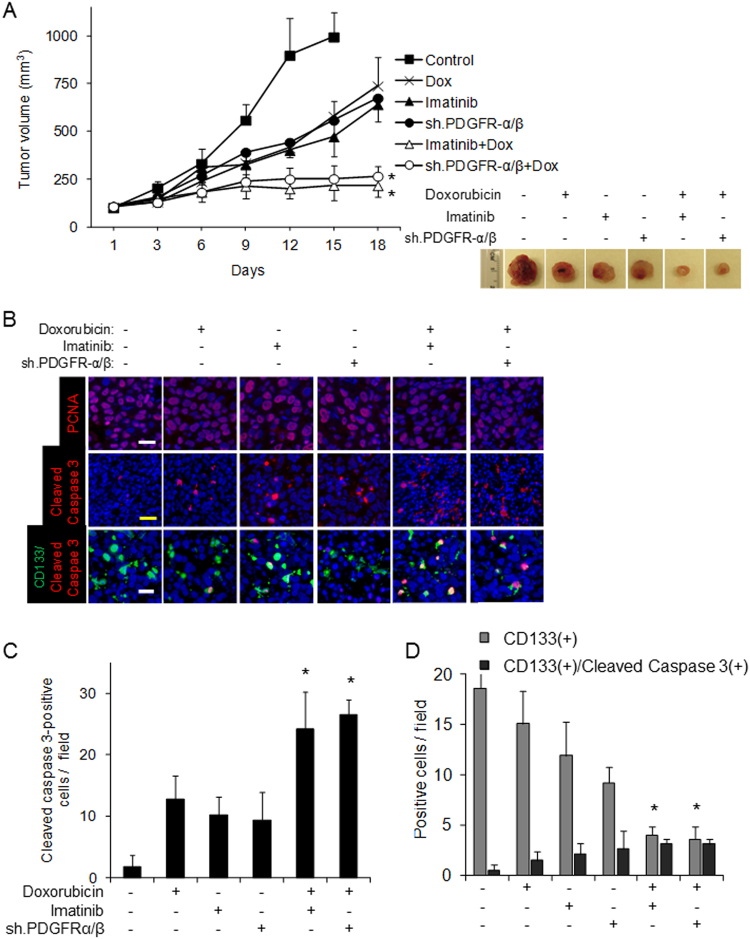
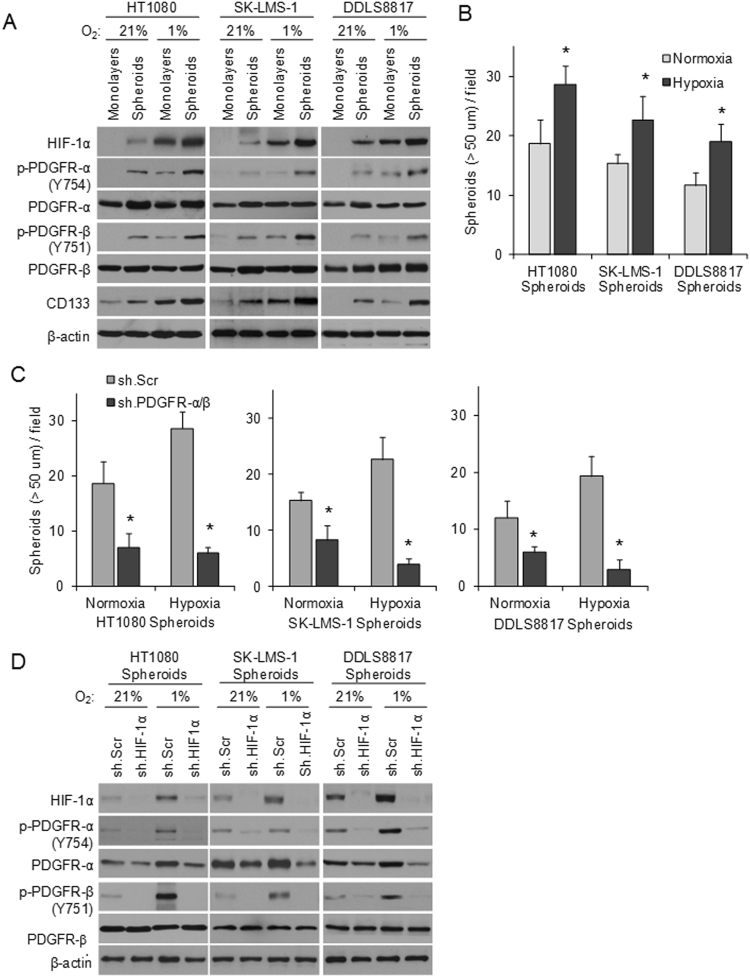
Sarcomas are malignant tumors derived from mesenchymal tissues and may harbor a subset of cells with cancer stem-like cell (CSC) properties. Platelet-derived growth factor receptors α and β (PDGFR-α/β) play an important role in the maintenance of mesenchymal stem cells. Here we examine the role of PDGFR-α/β in sarcoma CSCs. PDGFR-α/β activity and the effects of PDGFR-α/β inhibition were examined in 3 human sarcoma cell lines using in vitro assays and mouse xenograft models. In all three cell lines, PDGFR-α/β activity was significantly higher in cells grown as spheroids (to enrich for CSCs) and in cells sorted for CD133 expression (a marker of sarcoma CSCs). Self-renewal transcription factors Nanog, Oct4, and Slug and epithelial-to-mesenchymal transition (EMT) proteins Snail, Slug, and Zeb1 were also significantly higher in spheroids cells and CD133(+) cells. Spheroid cells and CD133(+) cells demonstrated 2.9- to 4.2-fold greater migration and invasion and resistance to doxorubicin chemotherapy. Inhibition of PDGFR-α/β in CSCs using shRNA or pharmacologic inhibitors reduced expression of certain self-renewal and EMT proteins, reduced spheroid formation by 74-82%, reduced migration and invasion by 73-80%, and reversed chemotherapy resistance. In mouse xenograft models, combining PDGFR-α/β inhibition (using shRNA or imatinib) with doxorubicin had a more-than-additive effect in blocking tumor growth, with enhanced apoptosis, especially in CD133(+) cells. These results indicate that PDGFR-α/β activity is upregulated in sarcoma CSCs and promote CSC phenotypes including migration, invasion, and chemotherapy resistance. Thus, the PDGFR-α/β pathway represents a new potential therapeutic target to reduce metastatic potential and increase chemosensitivity.


Conflict of interest statement

The authors declare that they have no conflict of interest.

Figures

Fig. 1
Fig. 1. CD133 is a marker of sarcoma CSCs.
a Western blot analysis of cell surface markers for cancer stem-like cells in human sarcoma cell lines HT1080, SK-LMS-1, and DDLS8817. Cells were grown as monolayers or spheroids. β-actin was used as the loading control. b Percentage of CD133(+) cells in human sarcoma cells grown as monolayers or as spheroids as determined by FACS analysis. *p < 0.05 compared to Monolayers. c Western blot analysis of human sarcoma cells grown as monolayers or as spheroids for self-renewal transcription factors. d Western blot analysis of FACS-sorted CD133(+) and CD133() spheroid cells for self-renewal transcription factors. Experiments in ad were performed three times with similar results. e Representative light microscopy images from single cell assays performed in triplicate for human sarcoma spheroid cells FACS-sorted by CD133. Graph displays the mean diameters of the spheroid colonies. Bars represent standard deviation. *p < 0.05 compared to CD133()
Fig. 2
Fig. 2. Role of PDGFR-α/β in sarcoma CSCs.
a Western blot analysis of phosphorylated and total PDGFR-α and -β in human sarcoma cell lines grown as monolayers and as spheroids. β-actin was used as a loading control. b Western blot analysis of PDGFR-α and -β expression and self-renewal transcription factors in human sarcoma cell lines grown as spheroids and treated with imatinib (1 μM) or DMSO control. Experiments in a, b were performed three times with similar results. c Graph displaying the mean diameters of the spheroids for HT1080, SK-LMS-1, and DDLS8817 cells treated with imatinib or DMSO. d Light microscopy images from single cell assays for spheroid cells treated with imatinib or DMSO. e Representative light microscopy images from spheroid formation assays performed in triplicate of human sarcoma cell lines under varying conditions. Cells were grown as spheroids following PDGFR-α and PDGFR-β double knockdown (sh.PDGFR-α/β), transduction with scramble shRNA (sh.Scr), or treatment with imatinib or DMSO. Graphs display the mean numbers of spheroids ≥50 μm per field in each treatment group. Bars represent standard deviation. *p < 0.05 compared to DMSO
Fig. 3
Fig. 3. PDGFR-α/β promotes sarcoma CSC migration/invasion and anchorage-independent growth.
a Western blot analysis of cell adhesion protein N-cadherin and EMT transcription factors Snail, Slug, and Zeb1 in human sarcoma cell lines grown as monolayers and as spheroids. β-actin was used as the loading control. b Representative images under light microscopy of migration and invasion assays of human sarcoma cell lines grown as monolayers or as spheroids for 24–48 h. Graphs display the number of migrated or invasive cells per field. c Representative light microscopy images of forrmed colonies in soft agar assay of human sarcoma cell lines grown as monolayers or spheroids for 14–20 days. Graph displays the number colonies per field. d Representative images under light microscopy of migration and invasion assays of human sarcoma cell lines grown as monolayers or as spheroids. Spheroid cells were treated with imatinib or DMSO. e Western blot analysis of N-cadherin and EMT-regulating transcription factors in human sarcoma cell lines grown as spheroids and treated with imatinib or DMSO. Experiments in a and e were performed three times with similar results. Bars represent standard deviation. *p < 0.05 compared to Monolayers
Fig. 4
Fig. 4. PDGFR-α/β signaling in sarcoma CSCs contributes to chemotherapy resistance in vitro.
Proliferation assays for human sarcoma cell lines grown as (a) monolayers or (b) spheroids for 48–60 h. Treatment groups included cells with PDGFR-α knockdown (sh.PDGFR-α), PDGFR-β knockdown (sh.PDGFR-β), and cells treated with imatinib; each group was also treated with doxorubicin chemotherapy (Dox) 0.5 μmM or DMSO. Proliferation assays were also performed with both PDGFR-α and -β double knockdown cells (sh.PDGFR-α/β) in human sarcoma cells grown as (c) monolayers or (d) spheroids, following treatment with doxorubicin or DMSO. Experiments in ad were performed three times with similar results. *p < 0.05 compared to control and monotherapy groups
Fig. 5
Fig. 5. PDGFR-α/β inhbition reverses to chemotherapy resistance in vivo.
a Tumor growth curves for HT1080 xenografts treated with doxorubicin (Dox) 4 mg/kg), imatinib (90 mg/kg), PDGFR-α shRNA and PDGFR-β shRNA (sh.PDGFR-α/β), and/or DMSO. There were five mice per group. b Representative immunofluorescence images of treated HT1080 tumors and stained for PCNA (purple), cleaved caspase-3 (red), and CD133 (green). White scale bars 25 μm; yellow scale bar 50 μm. c,d Graphs displaying the number of cleaved caspase 3(+), CD133(+), and dual cleaved caspase 3(+)/CD133(+) cells on immunofluorescence imaging analysis. Bars represent standard deviation. *p < 0.05 compared to control and monotherapy groups
Fig. 6
Fig. 6. PDGFR-α/β signaling in sarcoma CSCs is upregulated by hypoxia.
a Western blot analysis of HIF-1α, phosphorylated and total PDGFR-α and -β, and CD133 in human sarcoma cell lines grown as monolayers or as spheroids under normoxia (21% O2) and hypoxia (1% O2) for 18–24 h. b Graph displaying the mean numbers of spheroids >50 μm per field formed by sarcoma spheroid cells under normoxia and hypoxia. c Graphs displaying the mean numbers of spheroids >50 μm per field formed by sarcoma spheroid cells under normoxia and hypoxia following transduction with control shRNA (sh.Scr) or PDGFR-α and -β shRNA (sh.PDGFR-α/β). d Western blot analysis of HIF-1α, phosphorylated and total PDGFR-α and -β in human sarcoma spheroid cells under normoxia (21% O2) and hypoxia (1% O2) following transduction with control shRNA (sh.Scr) or HIF-1α shRNA (sh.HIF-1α). Experiments a and d were performed three times with similar results. Bars represent standard deviation. *p < 0.05 compared to Normoxia

Similar articles

Cited by

References

    1. Siegel RL, Miller KD, Jemal A. Cancer statistics, 2017. CA Cancer J. Clin. 2017;67:7–30. doi: 10.3322/caac.21387. - DOI - PubMed
    1. Billingsley KG, et al. Pulmonary metastases from soft tissue sarcoma: analysis of patterns of diseases and postmetastasis survival. Ann. Surg. 1999;229:602–610. doi: 10.1097/00000658-199905000-00002. - DOI - PMC - PubMed
    1. Van Glabbeke M, et al. Prognostic factors for the outcome of chemotherapy in advanced soft tissue sarcoma: an analysis of 2,185 patients treated with anthracycline-containing first-line regimens--a European Organization for Research and Treatment of Cancer Soft Tissue and Bone Sarcoma Group Study. J. Clin. Oncol. 1999;17:150–157. doi: 10.1200/JCO.1999.17.1.150. - DOI - PubMed
    1. Tan BT, Park CY, Ailles LE, Weissman IL. The cancer stem cell hypothesis: a work in progress. Lab. Invest. 2006;86:1203–1207. doi: 10.1038/labinvest.3700488. - DOI - PubMed
    1. Terry J, Nielsen T. Expression of CD133 in synovial sarcoma. Appl. Immunohistochem. Mol. Morphol. 2010;18:159–165. doi: 10.1097/PAI.0b013e3181b77451. - DOI - PubMed

Publication types