. 2018 Jun 18;9(7):721.
doi: 10.1038/s41419-018-0762-z.

MicroRNA-378 is involved in hedgehog-driven epithelial-to-mesenchymal transition in hepatocytes of regenerating liver

Affiliations

MicroRNA-378 is involved in hedgehog-driven epithelial-to-mesenchymal transition in hepatocytes of regenerating liver

Jieun Kim et al. Cell Death Dis. .

Abstract

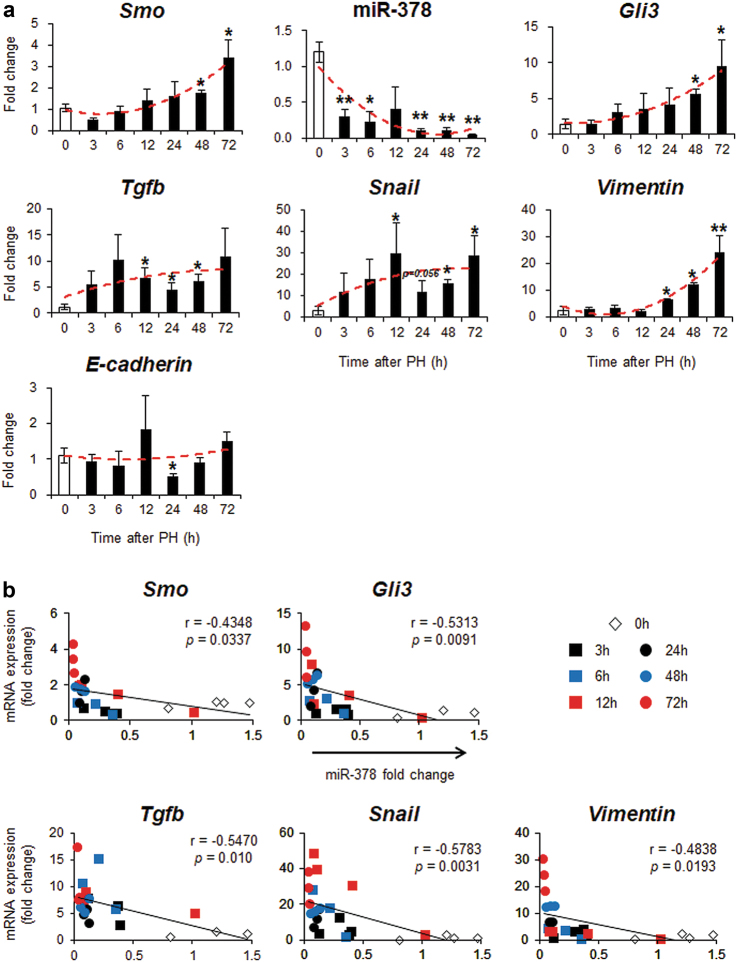
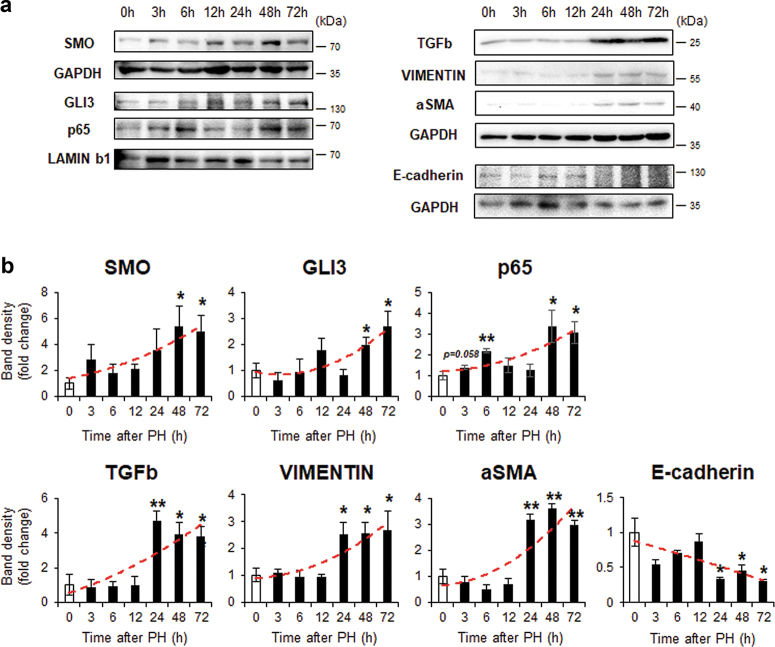
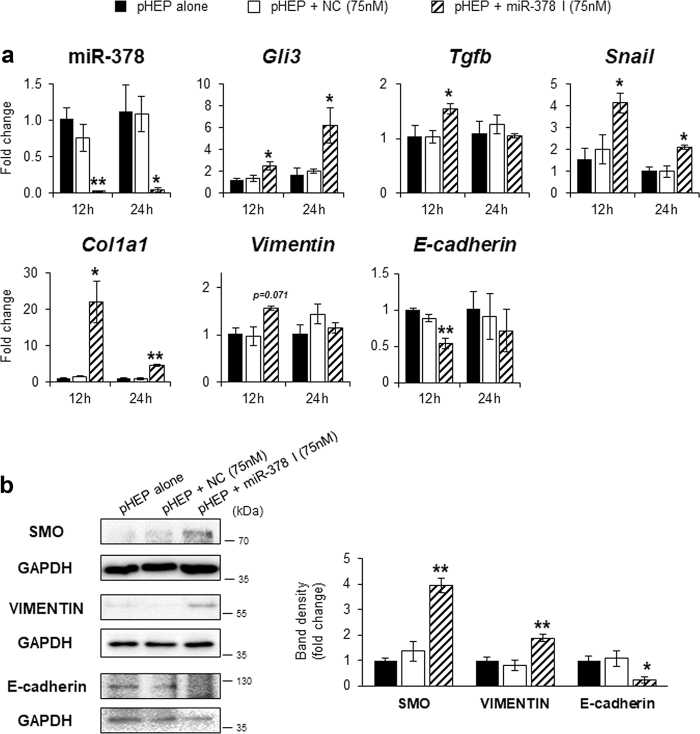
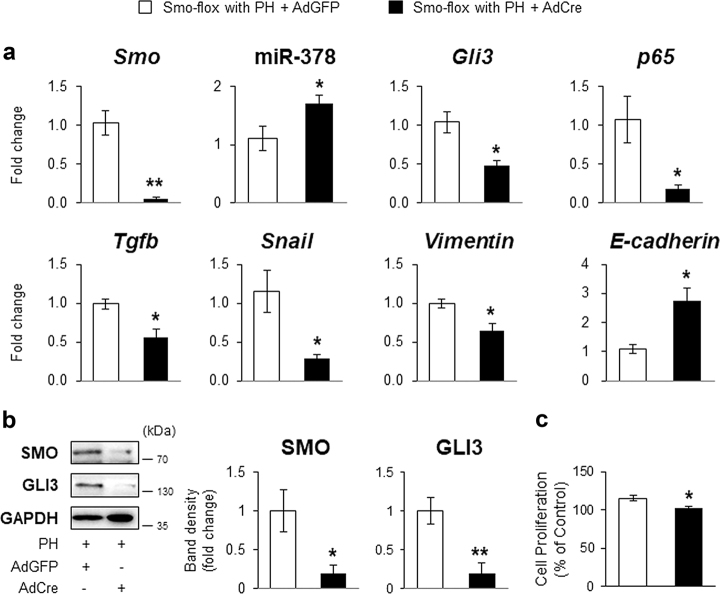
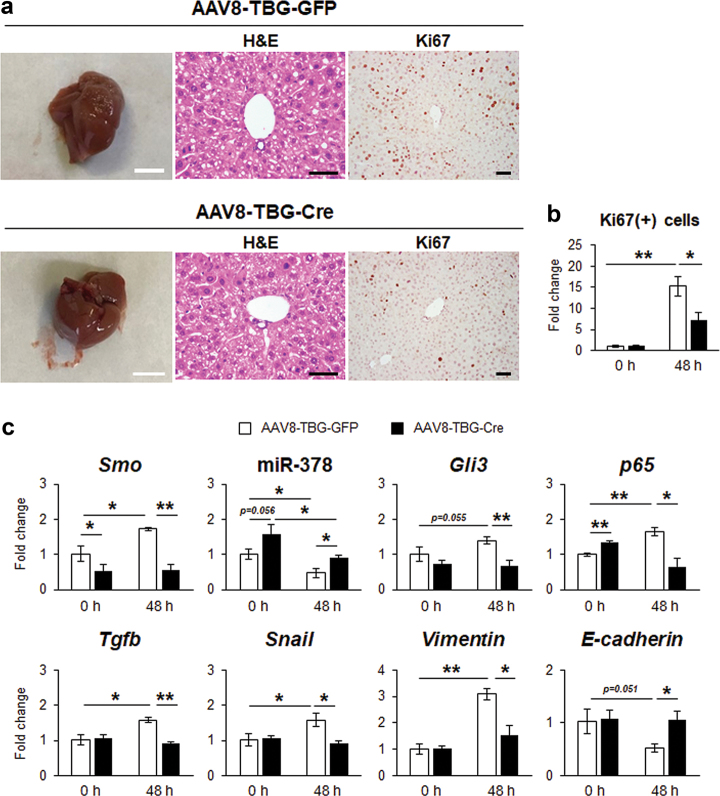
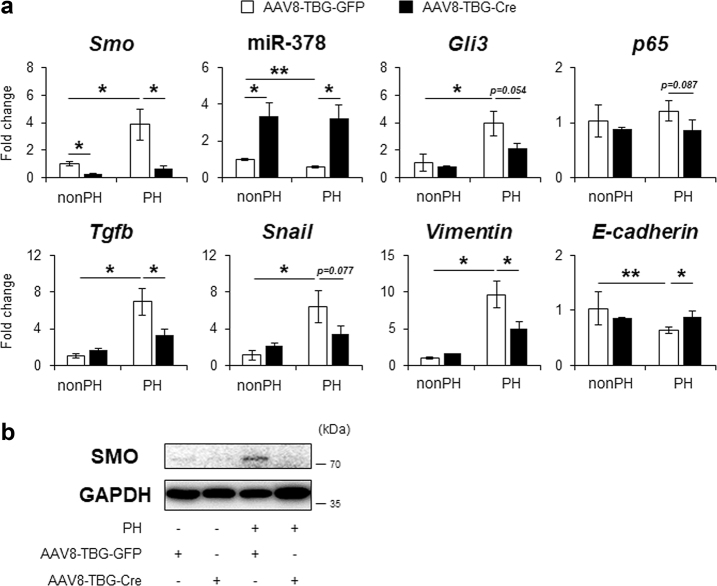
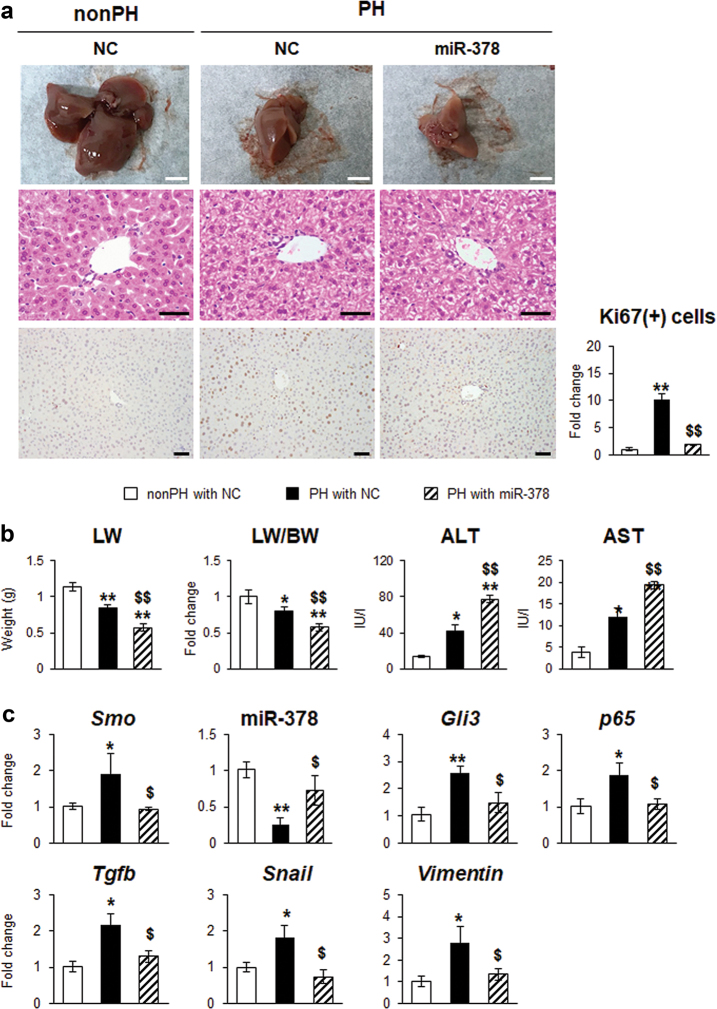
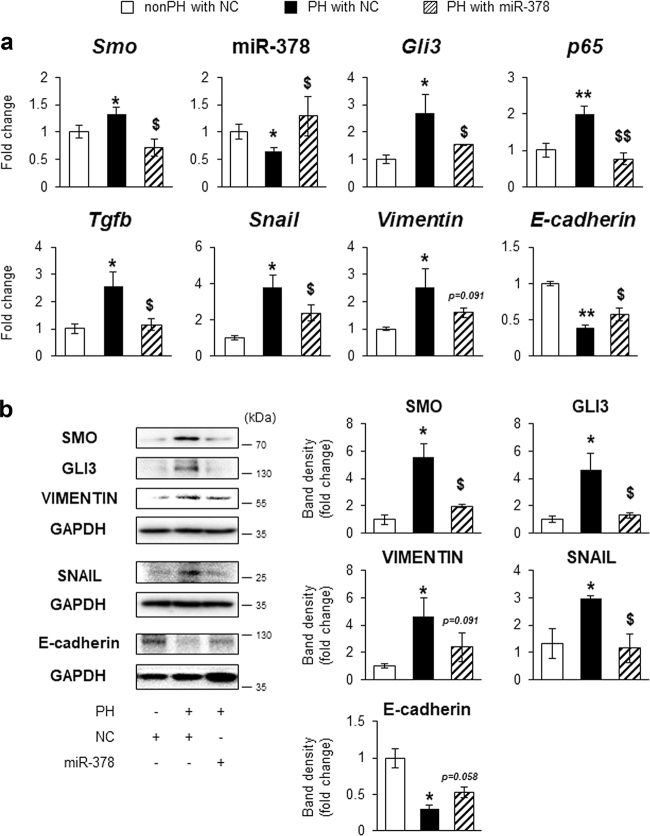
Healthy livers have a remarkable regenerative capacity for reconstructing functional hepatic parenchyma after 70% partial hepatectomy (PH). Hepatocytes, usually quiescent in normal healthy livers, proliferate to compensate for hepatic loss after PH. However, the mechanism of hepatocyte involvement in liver regeneration remains unclear. Hedgehog (Hh) pathway plays an important role in tissue reconstitution by regulating epithelial-to-mesenchymal transition (EMT) in liver disease. MicroRNA (miRNA) is involved in cell proliferation and differentiation during embryonic development and carcinogenesis. It was recently reported that miR-378 inhibits transdifferentiation of hepatic stellate cells into myofibroblasts by suppressing Gli-Krüppel family member 3 (Gli3), the Hh-target gene. We hypothesized that miR-378 influences EMT in hepatocytes by interfering with Hh signaling during liver regeneration. As hepatocytes were highly proliferative after PH in mice, miR-378 and epithelial marker, Ppar-g or E-cadherin were downregulated, whereas both Hh activators, Smoothened (Smo) and Gli3, and the EMT-inducing genes, Tgfb, Snail and Vimentin, were upregulated in the regenerating livers and in hepatocytes isolated from them. Compared to cells with or without scramble miRNA, primary hepatocytes transfected with miR-378 inhibitor contained higher levels of Gli3 with increased expression of the EMT-promoting genes, Tgfb, Snail, Col1a1, and Vimentin, suggesting that miR-378 influenced EMT in hepatocytes. Smo-depleted hepatocytes isolated from PH livers of Smo-flox mice showed downregulation of EMT-promoting genes and Gli3, with upregulation of miR-378 and E-cadherin compared to Smo-expressing hepatocytes from PH liver. In addition, delivery hepatocyte-specific AAV8 viral vector bearing Cre recombinase into Smo-flox mice impeded EMT in Smo-suppressed hepatocytes of PH liver, indicating that Smo is critical for regulating hepatocyte EMT. Furthermore, the application of miR-378 mimic into mice with PH delayed liver regeneration by interrupting hepatocyte EMT. In conclusion, our results demonstrate that miR-378 is involved in hepatocyte EMT by regulating Hh signaling during liver regeneration.


Conflict of interest statement

The authors declare that they have no conflict of interest.

Figures

Fig. 1
Fig. 1. Expressional changes of miR-378, Hh target genes, and EMT activator in hepatocytes from mice with PH.
a Expression of Smo, miR-378, Gli3, Tgfb, Snail, Vimentin, and E-cadherin was assessed by qRT-PCR analysis in primary hepatocytes isolated from mice at 3, 6, 12, 24, 48 and 72 h after PH. All results of relative expression values are shown as mean ± s.e.m. of triplicate experiments (unpaired two-sample Student’s t test, *p < 0.05 **p < 0.005 vs. 0 h). b Pearson’s correlation coefficient between miR-378 expression and Smo, Gli3, Tgfb, Snail, and Vimentin (N = 24, Pearson’s correlation r = −0.435, p = 0.034 with Smo; r = −0.531, p = 0.009 with Gli3; r = −0.547, p = 0.01 with Tgfb; r = −0.578, p = 0.003 with Snail; r = −0.484, p = 0.019 with Vimentin)
Fig. 2
Fig. 2. Protein levels of Hh activators and EMT-related genes in hepatocytes from PH livers
a Western blot analysis for SMO (86 kDa), nuclear GLI3 (145 kDa) and p65 (65 kDa), processed form of TGFb (25 kDa), VIMENTIN (57 kDa), αSMA (42 kDa), E-cadherin (120 kDa), GAPDH (36 kDa), and LAMINb1 (68 kDa) in primary hepatocytes isolated from PH livers of mice. GAPDH and LAMINb1 was used as an internal control. Immunoblots shown represent one of three independent experiments with similar results. b Cumulative densitometric analyses of SMO, GLI3, p65, TGFb, Vimentin, αSMA, and E-cadherin western blots are displayed as the mean ± s.e.m. (unpaired two-sample Student’s t test, *p < 0.05 **p < 0.005 vs. 0 h)
Fig. 3
Fig. 3. MiR-378 inhibitor promotes EMT in primary hepatocytes of mice.
a qRT-PCR of miR-378, Gli3, Tgfb, Snail, Col1a1, Vimentin and E-cadherin in primary hepatocytes (pHEP), which were isolated from WT mice and transfected with miR-378 inhibitor (I, 75 nM, diagonal lined bar) or scramble miR (NC, 75 nM, white bar) for 12 and 24 h. All results of relative expression values are shown as mean ± s.e.m. of triplicate experiments (unpaired two-sample Student’s t test, *p < 0.05 **p < 0.005 vs. both cells cultured alone (black bar) and cultured with NC). b Western blot analysis and cumulative densitometric analyses for SMO, VIMENTIN, E-cadherin, and GAPDH in these transfected cells for 24 h. GAPDH was used as an internal control. Immunoblots shown represent one of three independent experiments with similar results. Results are displayed as the mean ± s.e.m. (unpaired two-sample Student’s t test, *p < 0.05 **p < 0.005 vs. both cells cultured alone (black bar) and cultured with NC)
Fig. 4
Fig. 4. Abrogating Hh signaling in hepatocytes disrupts EMT in hepatocytes.
a qRT-PCR for Smo, miR-378, Gli3, p65, Tgfb, Snail, Vimentin, and E-cadherin in primary hepatocytes. These cells were isolated from Smo-flox transgenic mice with PH (Smo-flox with PH) at 48 h, and then transfected with adenoviruses containing GFP (AdGFP: white bar) or Cre recombinases (AdCre: black bar) for 24 h. All results of relative expression values are shown as mean ± s.e.m. of triplicate experiments (unpaired two-sample Student’s t test, *p < 0.05, **p < 0.005 vs. Smo-flox with PH + AdGFP). b Western blot and cumulative densitometric analysis for SMO and active form of GLI3 in these cells. GAPDH was used as an internal control. Representative images from triplicated experiments with similar results were shown. Results are displayed as the mean ± s.e.m. (unpaired two-sample Student’s t test, *p < 0.05, **p < 0.005 vs. Smo-flox with PH + AdGFP). c Cell proliferation was measured by MTS assays in these cells. The mean ± s.e.m. results obtained from three independent experiments are graphed (unpaired two-sample Student’s t test, *p < 0.05, **p < 0.005 vs. Smo-flox with PH + AdGFP)
Fig. 5
Fig. 5. Targeted deletion of Smo in livers inhibits hepatocyte proliferation and EMT after PH.
a Images, H & E-, and Ki67-stained sections of livers from AAV8-TBG-GFP or AAV8-TBG-Cre-treated mice at 48 h after PH (N = 4 per group). Representative images of PH liver at 48 h were shown (liver image: scale bar = 50 mm/H&E and Ki67 stain: scale bar = 50 µm). b Quantitative Ki67-stained data from these mice. Ki67-positive hepatocytic cells were quantified by counting the total number of Ki67-positive cells per field. Mean ± s.e.m. results are graphed (one-way ANOVA with Tukey corrections, *p < 0.05 **p < 0.005) (c) qRT-PCR for Smo, miR-378, Gli3, p65, Tgfb, Snail, Vimentin and E-cadherin in these livers. All results of relative expression values are shown as mean ± s.e.m. of triplicate experiments (one-way ANOVA with Tukey corrections, *p < 0.05 **p < 0.005)
Fig. 6
Fig. 6. Targeted disruption of Smo in hepatocytes suppressed EMT after PH.
a qRT-PCR for Smo, miR-378, Gli3, p65, Tgfb, Snail, Vimentin and E-cadherin in primary hepatocytes, which were isolated from AAV8-TBG-GFP or AAV8-TBG-Cre-treated mice with (PH) or without PH (nonPH) (N = 3 per group). Cells from PH livers were obtained from livers at 48 h post PH. All results of relative expression values are shown as mean ± s.e.m. of triplicate experiments (one-way ANOVA with Tukey corrections, *p < 0.05 **p < 0.005). b Western blot analysis for SMO (86 kDa) and GAPDH (36 kDa) in primary hepatocytes isolated from these mice. GAPDH was used as an internal control. Immunoblots shown represent one of three independent experiments with similar results
Fig. 7
Fig. 7. Liver regeneration is impaired in miR-378 mimic-transfected mice.
a Images, H & E-, and Ki67-stained sections of livers from miR-378 mimic- or scramble RNA- (negative control: NC) transfected mice with (N = 5 per group) or without PH (N = 3 per group). Representative images of quiescent livers (nonPH) and PH liver at 72 h were shown (top panel: scale bar = 50 mm/middle and bottom panel: scale bar = 50 µm). Ki67-positive hepatocytic cells were quantified by counting the total number of Ki67-positive cells per field. Mean ± s.e.m. results are graphed (one-way ANOVA with Tukey corrections, *p < 0.05, **p < 0.005 vs. nonPH with NC, $p < 0.05 $$p < 0.005 vs. PH with NC). b LW, LW/BW, and serum ALT and AST levels of each groups were graphed as mean ± s.e.m (one-way ANOVA with Tukey corrections, *p < 0.05, **p < 0.005 vs. nonPH with NC, $p < 0.05 $$p < 0.005 vs. PH with NC). c qRT-PCR for Smo, miR-378, Gli3, p65, Tgfb, Snail, and Vimentin in livers of these mice. All results of relative expression values are shown as mean ± s.e.m. of triplicate experiments (one-way ANOVA with Tukey corrections, *p < 0.05, **p < 0.005 vs. nonPH with NC, $p < 0.05 $$p < 0.005 vs. PH with NC)
Fig. 8
Fig. 8. MiR-378 suppresses hepatocyte EMT in mice with PH.
a qRT-PCR for Smo, miR-378, Gli3, p65, Tgfb, Snail, Vimentin, and E-cadherin in hepatocyte which were isolated from PH or quiescent liver and transfected with miR-378 mimic (PH with miR378: diagonal lined bar) or NC (nonPH with NC: white bar/ PH with NC: black bar). All results of relative expression values are shown as mean ± s.e.m. of triplicate experiments (one-way ANOVA with Tukey corrections, *p < 0.05 **p < 0.005 vs. nonPH with NC, $p < 0.05 $$p < 0.005 vs. PH with NC). b Western blot and cumulative densitometric analyses for SMO (86 kDa), GLI3 (145 kDa), VIMENTIN (57 kDa), SNAIL (29 kDa), E-cadherin (120 kDa), and GAPDH (36 kDa) in these cells. GAPDH was used as an internal control. Immunoblots shown represent one of three independent experiments with similar results. Results are displayed as the mean ± s.e.m. (*p < 0.05, **p < 0.005 vs. nonPH with NC, $p < 0.05 $$p < 0.005 vs. PH with NC)

Similar articles

Cited by

References

    1. Michalopoulos GK. Liver regeneration after partial hepatectomy: critical analysis of mechanistic dilemmas. Am. J. Pathol. 2010;176:2–13. doi: 10.2353/ajpath.2010.090675. - DOI - PMC - PubMed
    1. Fausto N, Campbell JS, Riehle KJ. Liver regeneration. Hepatology. 2006;43:S45–S53. doi: 10.1002/hep.20969. - DOI - PubMed
    1. Fausto N, Campbell JS. The role of hepatocytes and oval cells in liver regeneration and repopulation. Mech. Dev. 2003;120:117–130. doi: 10.1016/S0925-4773(02)00338-6. - DOI - PubMed
    1. Michalopoulos GK, DeFrances MC. Liver regeneration. Science. 1997;276:60–66. doi: 10.1126/science.276.5309.60. - DOI - PubMed
    1. Swiderska-Syn M, et al. Myofibroblastic cells function as progenitors to regenerate murine livers after partial hepatectomy. Gut. 2013;63:1333–1344. doi: 10.1136/gutjnl-2013-305962. - DOI - PMC - PubMed

Publication types