

doi: 10.1038/s41598-018-27584-x.
PTPRS Regulates Colorectal Cancer RAS Pathway Activity by Inactivating Erk and Preventing Its Nuclear Translocation
Affiliations
- PMID: 29915291
- PMCID: PMC6006154
- DOI: 10.1038/s41598-018-27584-x
Item in Clipboard
PTPRS Regulates Colorectal Cancer RAS Pathway Activity by Inactivating Erk and Preventing Its Nuclear Translocation
Sci Rep.
.
Abstract
Colorectal cancer (CRC) growth and progression is frequently driven by RAS pathway activation through upstream growth factor receptor activation or through mutational activation of KRAS or BRAF. Here we describe an additional mechanism by which the RAS pathway may be modulated in CRC. PTPRS, a receptor-type protein tyrosine phosphatase, appears to regulate RAS pathway activation through ERK. PTPRS modulates ERK phosphorylation and subsequent translocation to the nucleus. Native mutations in PTPRS, present in ~10% of CRC, may reduce its phosphatase activity while increasing ERK activation and downstream transcriptional signaling.
Conflict of interest statement
The authors declare no competing interests.
Figures
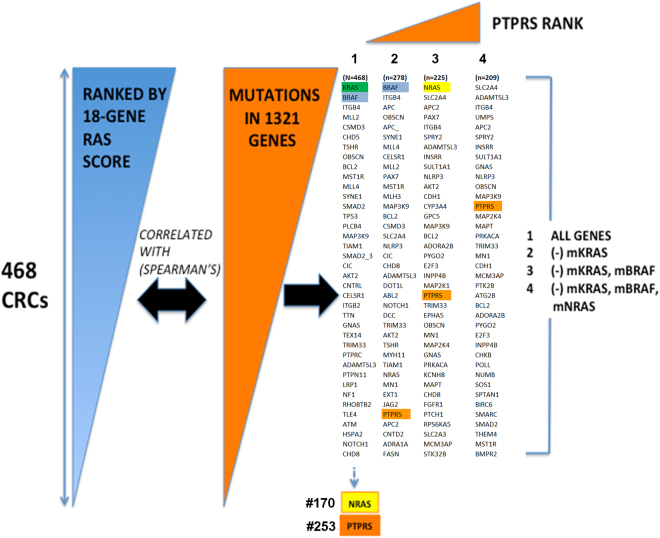
Identification of PTPRS by a hybrid analysis of global gene expression (Afffymetrix) and observed DNA mutations derived from targeted exome nextgen DNA sequencing of 1321 genes. 468 CRC cases were first scored for RAS pathway activity with an 18-gene RAS pathway gene expression-based activation score. PTPRS emerged as a lead candidate gene to activate RAS pathway when shadows of mutant KRAS, BRAF and NRAS were removed. See Methods for detailed description of the ranking analysis.
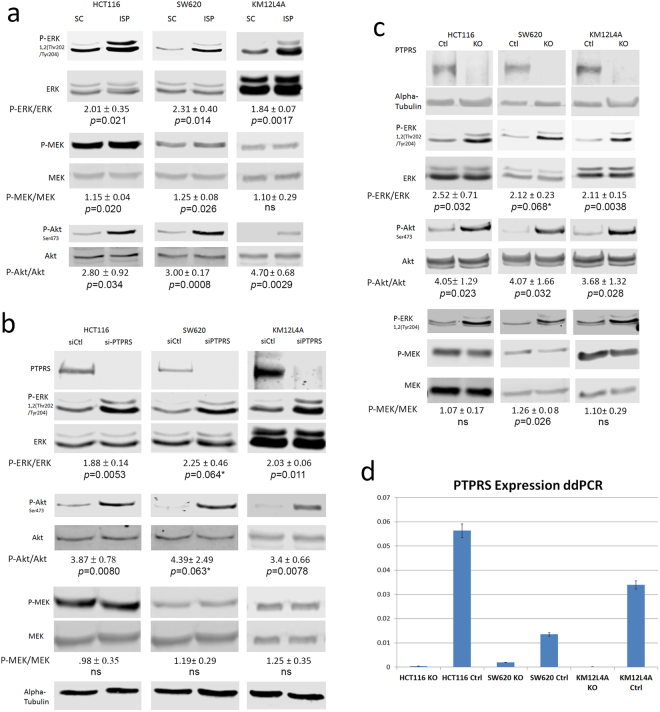
Western blot analysis for ERK and MEK activation. The indicated CRC cell lines were cultured, cells harvested, extracts prepared and western blots performed. (a) Cells (HCT116, SW620 and KM12L4A) cultured with ISP, an inhibitor of PTPRS, or a scrambled control peptide (SC). Western blots to detect ERK, tyrosine phosphorylated ERK, MEK and phosphorylated MEK, and AKT and phosphorylated AKT are shown as indicated. The quantitations were determined by normalizing the phosphorylated protein values with the total protein; then dividing the ISP values by the SC values. (b) The indicated cells had PTPRS knocked down with siRNA to PTPRS (siPTPRS) or were treated with a scrambled siRNA control (siCtl). Western blot analysis shows PTPRS, phospho-ERK, ERK, phospho-MEK, MEK, phospho-AKT, AKT, and alpha-tubulin. Knockdown of PTPRS via siRNA shows results consistent with the ISP treatments. (c) CRISPR knockouts of PTPRS in HCT116, SW620, and KM12L4A cell lines and their CRISPR control cell lines where cell extracts were used in western blot analysis for phosphorylation of ERK and MEK. This analysis shows PTPRS, ERK, phospho-ERK, MEK, phospho-MEK, AKT, phospho-AKT, and alpha tubulin in the cell line pairs (Ctl and KO) as indicated. (d) ddPCR analysis of PTPRS expression in CRISPR KO cells for HCT116, SW620, and KM12L4A. Analysis of the ddPCR result shows a near complete knockout for HCT116 and KM12L4A; SW620 shows >85% knockout. All experiments were done in triplicate. The mean and standard deviation are shown. Two-tailed, paired t test was used to determine the statistical significance for comparison as indicated.
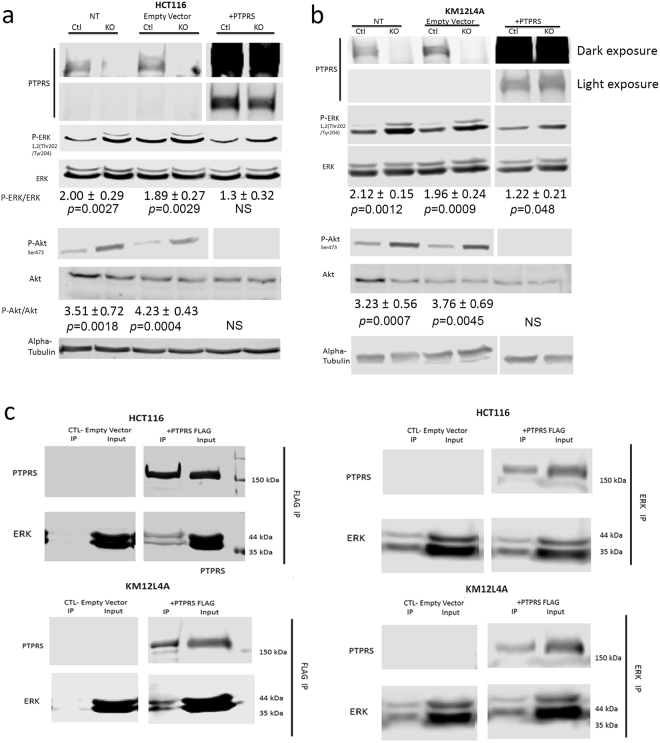
Transfections of PTPRS plasmid back into CRISPR KO cells decreases Phospho-ERK. HCT116 and KM12L4A CRISPR PTPRS KO cells and their CRISPR control cells were grown and transfected with full length PTPRS containing vector or empty vector alone. 48 hours after transfection cells were harvested and analyzed for ERK, AKT and MEK phosphorylation. Panel (a) Western blots are for HCT116 CRISPR PTPRS (KO) knockout cells and CRISPR controls (Ctl) as indicated. Cells not treated (NT), transfected with empty vector alone, and transfected with plasmid with PTPRS are shown. Panel (b) is the same as Panel (a) but with KM12L4A cells. The PTPRS expression is shown in two blots. The top blot is a darker exposure to elucidate the native PTPRS expression in the control cells. The second blot for PTPRS is a lighter exposure to show the PTPRS expression of the plasmid transfected cells. Quantitations were determined by normalizing the phosphorylated protein values with the total protein; then dividing the PTPRS KO by the CRISPR control values. All experiments were done in triplicate. The mean and standard deviation are shown. Two-tailed, paired t test was used to determine the statistical significance for comparison as indicated. (c) Co-immunoprecipitation of Flag-tagged PTPRS and ERK. Flag-tagged PTPRS was transfected into HCT116 and KM12L4A PTPRS KO cells. Cell lysates were then immunoprecipitated (IP) with a Flag Ab (left blots). The Flag IP was successful in pulling down the Flag-tagged PTPRS as well as pulling down ERK (lane 3 of left panel). Conversely PTPRS transfected cells were also immunoprecipitated using an ERK Ab (right panel). It was showed that the Flag-tagged PTPRS was pulled down along with ERK (lane 3 of right panel), again supporting a direct association between PTPRS and ERK.
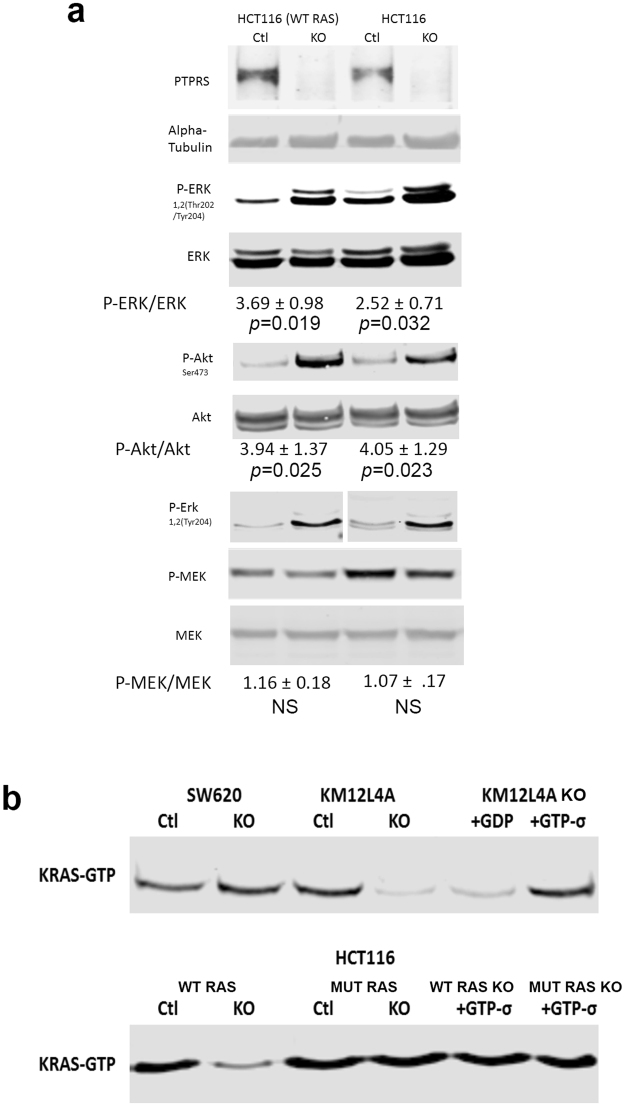
Comparison of Isogenic HCT116 Cell lines with and without activated KRAS. (a) The parental CRC HCT116 (KRAS G13D/+) cell line has an activating mutation of KRAS. Here we compare this cell line to an isogenic HCT116 (−/+) cell line that has the mutated KRAS allele knocked out, leaving the cell with only one WT KRAS allele. PTPRS CRISPR KO and CRISPR control paired cell lines were made in both HCT116 parental (KRAS G13D/+) and the isogenic HCT116 (−/+) cell lines. Extracts prepared from growing cultures were used for western blot analysis of ERK, phospho-ERK, MEK, phospho-MEK, AKT andphospho-AKT. The HCT116 (−/+) is shown to have natively less phospho-ERK compared to its parental HCT116 cell line with the activated KRAS mutation. The KO of PTPRS for both cell lines shows a dramatic increase in phospho-ERK and phospho-AKT. Quantitations were determined by normalizing the phosphorylated protein values with the total protein; then dividing the PTPRS KO by the CRISPR control values. All experiments were done in triplicate. The mean and standard deviation are shown. Two-tailed, paired t test was used to determine the statistical significance for comparison as indicated. (b) Active Ras pull down for all cell lines. The mutant KRAS cells lines, HCT116 and SW620, show a constitutively active Ras. The WT KRAS
PTPRS KO cell lines, KM12L4A and the isogenic HCT116 (−/+), show a reduced amount of active Ras. KM12L4A was also used for negative and positive controls incubating the samples with GDP and GTPσ; HCT116 and HCT116 (−/+) samples were incubated with GTPσ as a positive control.
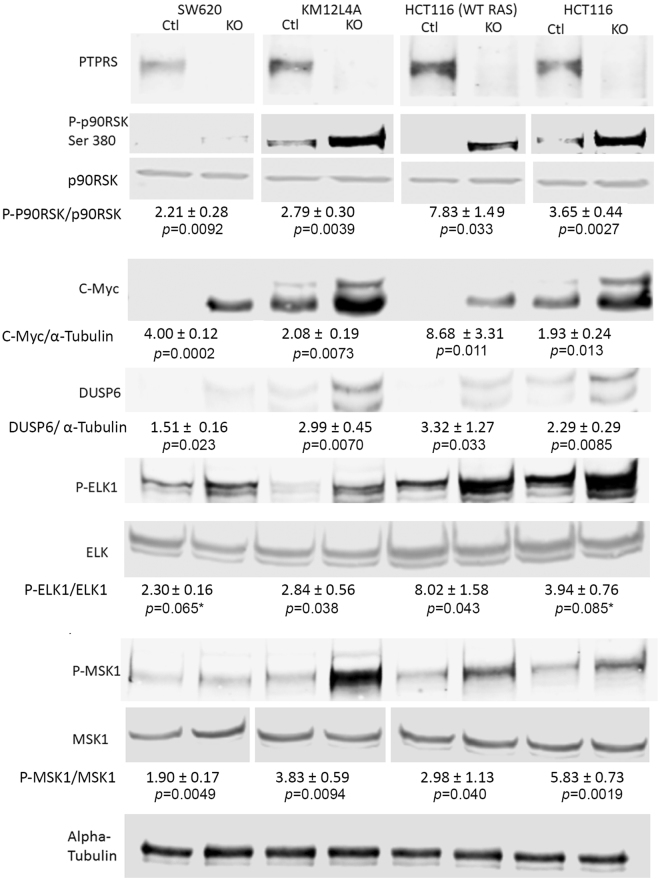
ERK targeted gene regulation and specific phosphorylations. The CRC cell lines SW620, KM12L4A, HCT116 (WT KRAS) [HCT116 (−/+)], and HCT116 [HCT116 (KRAS G13D/+)] along with their paired CRISPR PTPRS knockout cell lines were grown and cell extracts were prepared. Western blot analysis for Phospho-p90RSK (Ser 380), DUSP6, and C-Myc were performed. The PTPRS knockout cell line in each pair shows the presence of more protein for each product tested than its parental matching cell line. This effect is consistent even between the WT KRAS and mutant KRAS HCT116 cells. Phosphorylation of Elk-1 (S383) and MSK1 (T581) are shown. Quantitations were determined by normalizing the phosphorylated protein values with the total protein; then dividing the PTPRS KO by the CRISPR control values. The mean and standard deviation are shown.
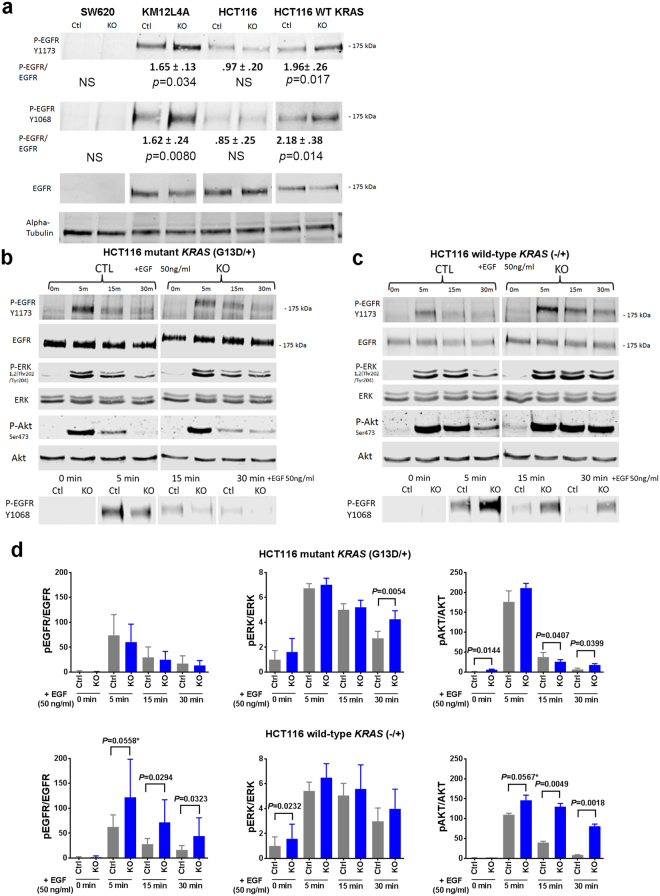
The activation of EGFR and ERK in PTPRS knockout cell lines and in response to EGF stimulation. (a) The CRC PTPRS CRISPR KO cell lines SW620, KM12L4A, HCT116 [mutant KRAS G13D/+], and HCT116 [WT KRAS −/+] and their CRISPR control cells were cultured, and harvested for western blotting to determine the phosphorylation of EGFR. Phosphorylation of EGFR Y1173, Y1068 and total EGFR are shown. Quantitations were done normalizing each phospho-EGFR levels against total EGFR levels; normalized phospho-EGFR values for the KO were then divided by the control values to see the fold change difference. SW620 shows no EGFR expression revealing that EGFR appears to be not the driving mechanism of the observed change in phospho-ERK. HCT116 [KRAS G13D/+] also shows no change in EGFR phosphorylation. The WT KRAS cell lines, KM12L4A and HCT116 [WT KRAS −/+] do show a change in phospho-EGFR. All experiments were done in triplicate. The mean and standard deviation are shown. Two-tailed, paired t test was used to determine the statistical significance for comparison as indicated. (b) Time course of serum starved HCT116 parental [mutant KRAS, G13D/+] PTPRS CRISPR KO and CRISPR control cells treated with EGF (50 ng/ml). At the times indicated, cells were harvested and extracts were prepared for western blotting. EGFR, EGFR phosphorylated at Y1173 andY1068, as well as ERK, phospho-ERK, AKT and phospho-AKT are shown. (c) HCT116 WT KRAS [−/+] PTPRS CRISPR KO and CRISPR control cells are shown with identical treatment as in (b). (d) This graph shows the normalized values of phospho-EGFR (left panels, average of Y1173 and Y1068), phospho-ERK (middle panels), and phospho-AKT (right panels) for the blots shown in Fig. 6b (top three panels) and Fig. 6c (bottom three panels). All experiments were done in triplicate. The mean and standard deviation are shown. Two-tailed, paired t test was used to determine the statistical significance for comparison. Significant P values (<0.05) are shown; * − near significant P values.
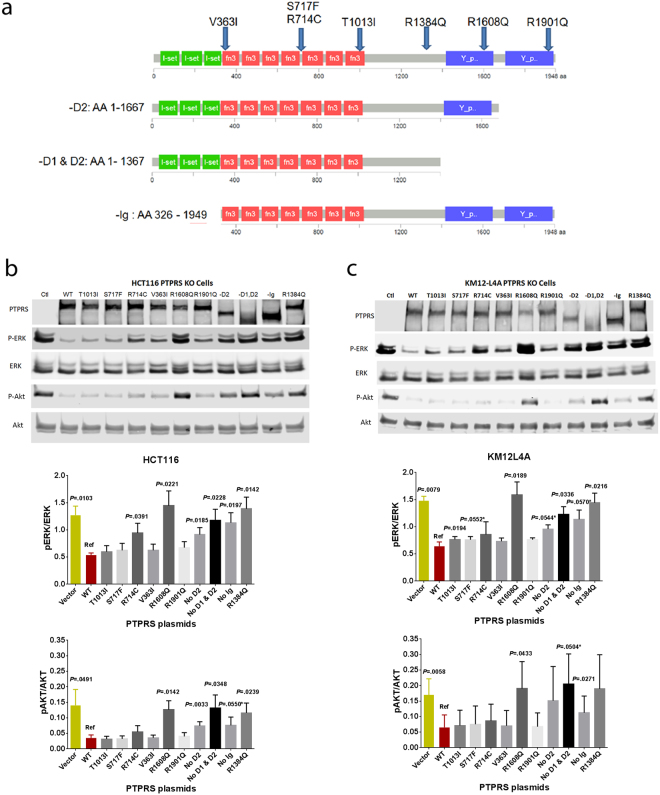
Effects of endogenous native PTPRS mutations on ERK de-phosphorylation assay. (a) Endogenous, native mutations were selected for further study based on frequency and location. 7 plasmids containing selected point mutations were synthesized. Additionally, 3 truncated mutants were synthesized. (b,c) HCT116 (KRAS G13D/+) and KM12L4A (WT KRAS) PTPRS KO cells were transfected with the various mutant plasmids and cultured for 48 hours. Extracts were prepared and levels of ERK and AKT phosphorylation were determined with western blotting. Results show that 6 of 10 mutations we tested (R714C, R1608Q, R1384Q, -D2, -D1&D2 and –Ig) exhibited completely or considerably reduced PTPRS activity compared to WT PTPRS plasmid. Similar results were observed in both cell lines tested. The experiments were done in triplicates. Quantitations were determined by normalizing the phosphorylated protein values with the total protein. All experiments were done in triplicate. The mean and standard deviation are shown. Two-tailed, paired t test was used to determine the statistical significance for comparison between WT PTPRS (Ref) and PTPRS mutants. Significant P values (<0.05) are shown; * − near significant P values; Vector − empty vector as a control.
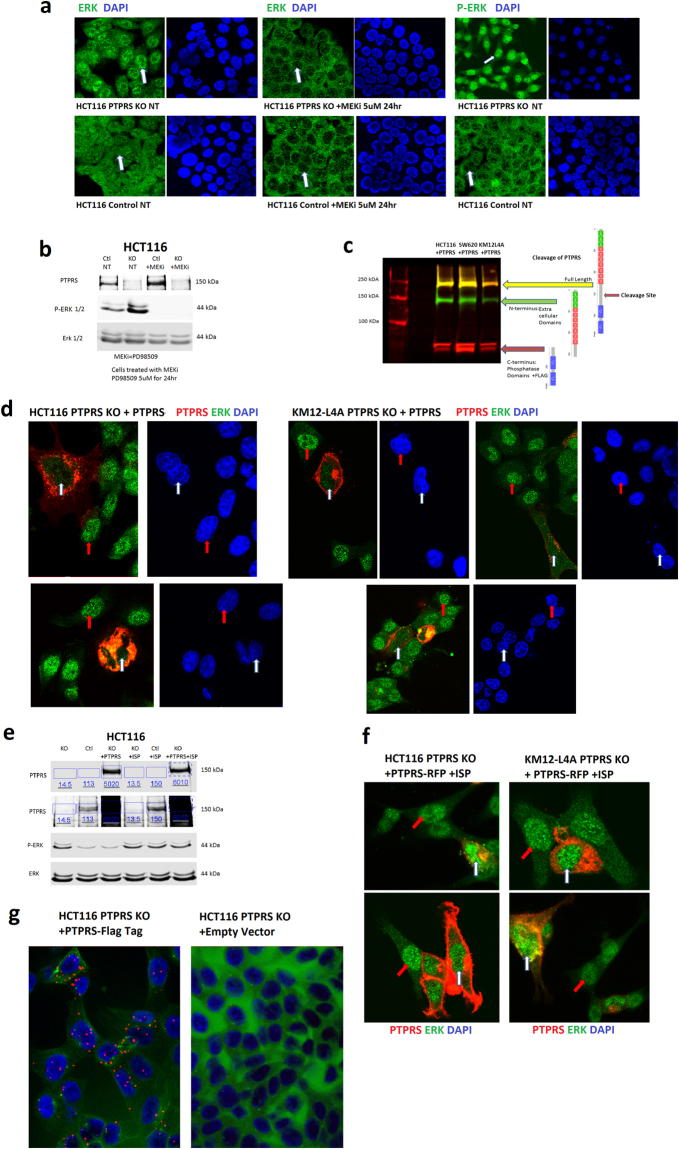
PTPRS affects the localization of ERK. (a) Immunofluorescent staining shows ERK nuclear localization in HCT116 PTPRS KO cells (upper left) and general whole cell staining in HCT116 control cells (lower left). A comparison of the control cells to the KO shows that the PTPRS KO cells have nuclei that are enriched with total ERK (arrow in top left compared to arrow in bottom left). The ERK phosphorylation in its location is confirmed with a MEK inhibitor (PD98509, middle panels). The inhibition of MEK prevent ERK phosphorylation resulting in ERK not being translocated to the nucleus (middle images have nuclei with very low-stained signals for ERK). Staining for phospho-ERK (right panels) shows a very dynamic difference with the PTPRS KO cells showing a bright signal and the control cells having very weak signal. Supplementary Fig. 4 shows the linear profile of fluorescence intensity for both DAPI and ERK/phospho-ERK. These measurements confirm the increased signal seen in the nuclei of PTPRS KO cells. (b) Western blot for the cells in Fig. 8a. The left two lanes are untreated HCT116 cells and right two are treated with 5 μM of MEK inhibitor PD98509 for 24 hours. The upper blot confirms the PTPRS knockout in the KO cells. The lower blots for phospho-ERK and total ERK confirm the increased phospho-ERK for the PTPRS KO in the left two lanes. The right most lanes confirm that the MEKi prevented the phosphorylation of ERK. (c) Multichannel blot of cells transfected with PTPRS with a C-terminal Flag tag. This blot uses both a PTPRS (rabbit green) and Flag (mouse red) antibody. Here the cleavage of PTPRS is illustrated. Full length PTPRS is 217 kDa (yellow), the N-terminal subunit containing extracellular and transmembrane domains are 140 kDa (green) the C-terminal Subunit containing phosphatase D1 and D2 domains are 78 kDa (red). This cleavage was a consistent result, and seen in all cell lines used. (d) Assessment of PTPRS transfection on ERK localization. HCT116 and KM12L4A PTPRS KO cells were transfected with a RFP C-terminal tagged PTPRS. Here we examined the localization of PTPRS (red) and total ERK (green) as well as their co-localization (orange). The PTPRS transfected cells (red) show a critically reduced level of ERK in their nuclei (white arrows) when compared to the cells not over expressing PTPRS (red arrows), which have bright green nuclei (ERK). (e) Western blotting corresponding to the cells used in 8d and 8f. The left three lanes show the PTPRS KO compared to the control cells and PTPRS KO cells transfected with PTPRS. The third lane shows that PTPRS transfected back into PTPRS KO cells reduces the increased phospho-ERK back to levels equivalent to the control cell line. The right three lanes show the ISP inhibited the transfected PTPRS activity allowing for increased phospho-ERK. (f) The nuclear reduction of ERK as a result of PTPRS transfection is reversed when PTPRS is inhibited by the ISP. HCT116 and KM12L4A PTPRS KO cells were transfected with the RFP tagged PTPRS and then treated with the PTPRS inhibitor ISP. The reduction in nuclear ERK (8d) is completely reversed (8f) when PTPRS is inhibited. Both the cells overexpressing PTPRS (white arrows) and non-transfected cells (red arrows) show bright ERK signal in their nuclei. Supplementary Fig. 5 shows the DAPI stains for these images. (g) Duo-Link In Situ staining for PTPRS and ERK co-localization. HCT116 PTPRS KO cells were transfected with a C-terminal FLAG tagged PTPRS or control empty vector. The cells were then labeled with a FLAG mouse Ab and an ERK rabbit Ab. The red dots indicate a successful duolink reaction, which requires both antibodies to be in close proximity. The PTPRS transfected cells show an ample amount of red signal (left), and the empty vector cells do not show a significant amount of signal (right). These data suggest a direct association between PTPRS and ERK.
References
-
- Siegel, R. L., Miller, K. D. & Jemal, A. Cancer statistics, 2016. CA Cancer J Clin, 10.3322/caac.21332 (2016).
Publication types
MeSH terms
Substances
Grants and funding
LinkOut - more resources
Full Text Sources
Other Literature Sources
Medical
Research Materials
Miscellaneous
