. 2018 Jul;20(7):800-810.
doi: 10.1038/s41556-018-0130-3. Epub 2018 Jun 18.

Dynamic kinetochore size regulation promotes microtubule capture and chromosome biorientation in mitosis

Affiliations

Dynamic kinetochore size regulation promotes microtubule capture and chromosome biorientation in mitosis

Carlos Sacristan et al. Nat Cell Biol. 2018 Jul.

Abstract

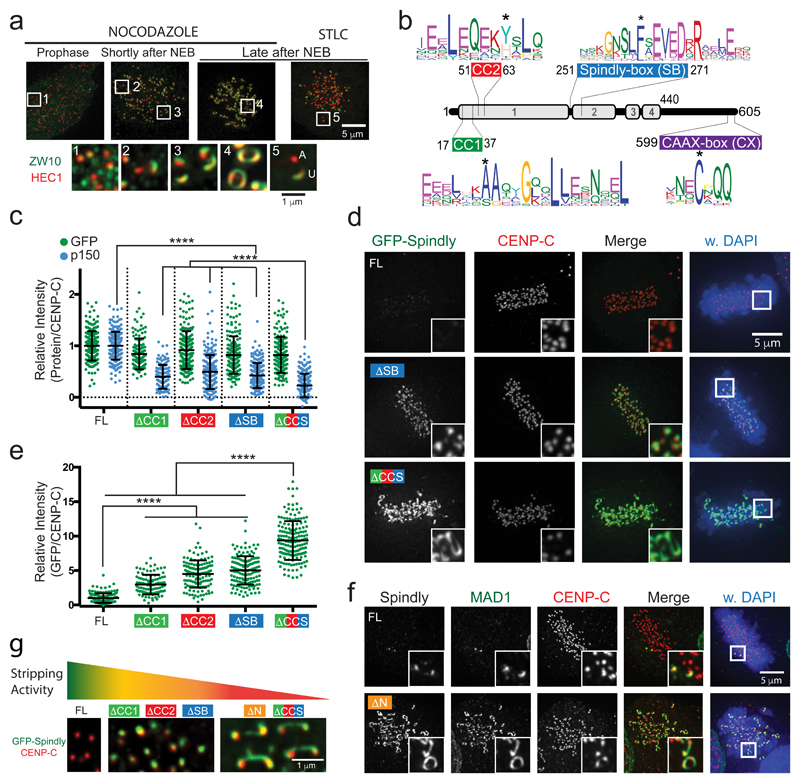
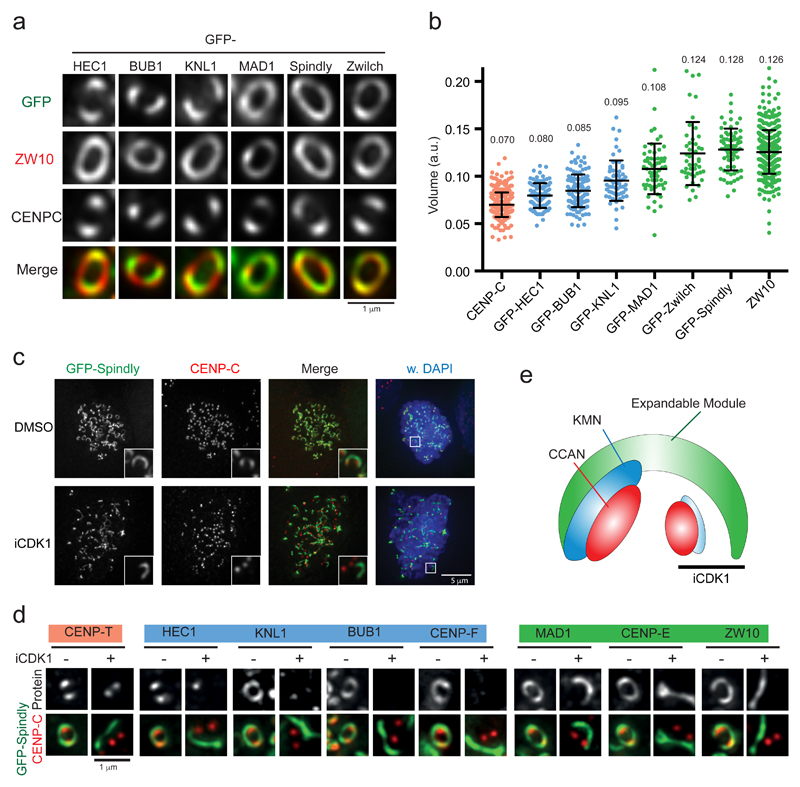
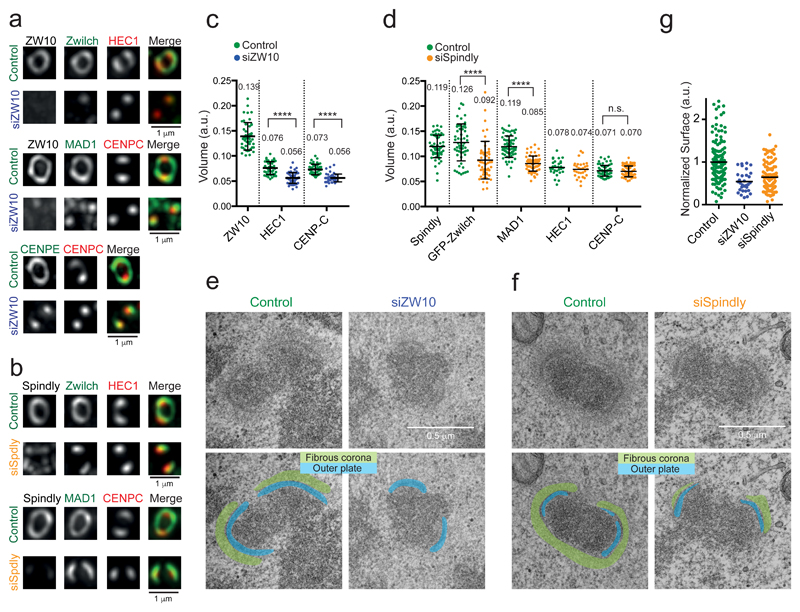
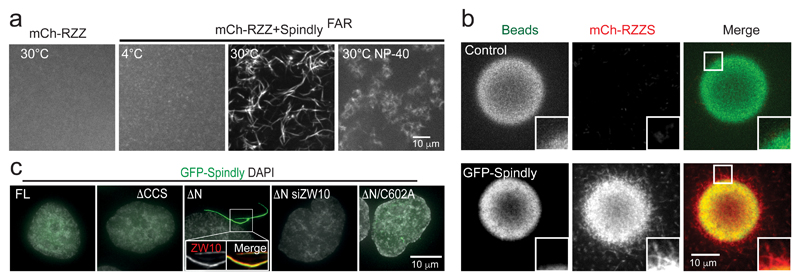
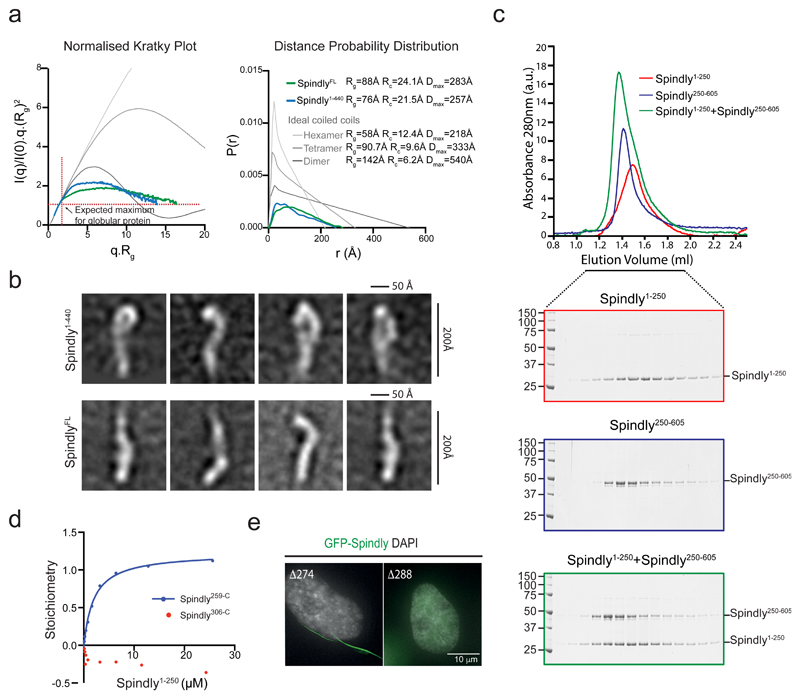
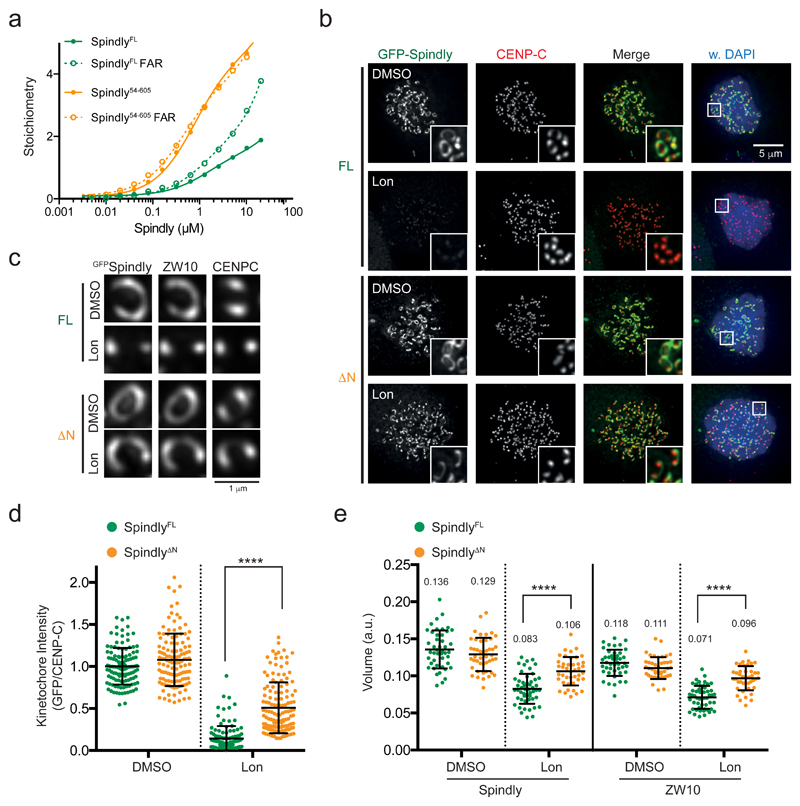
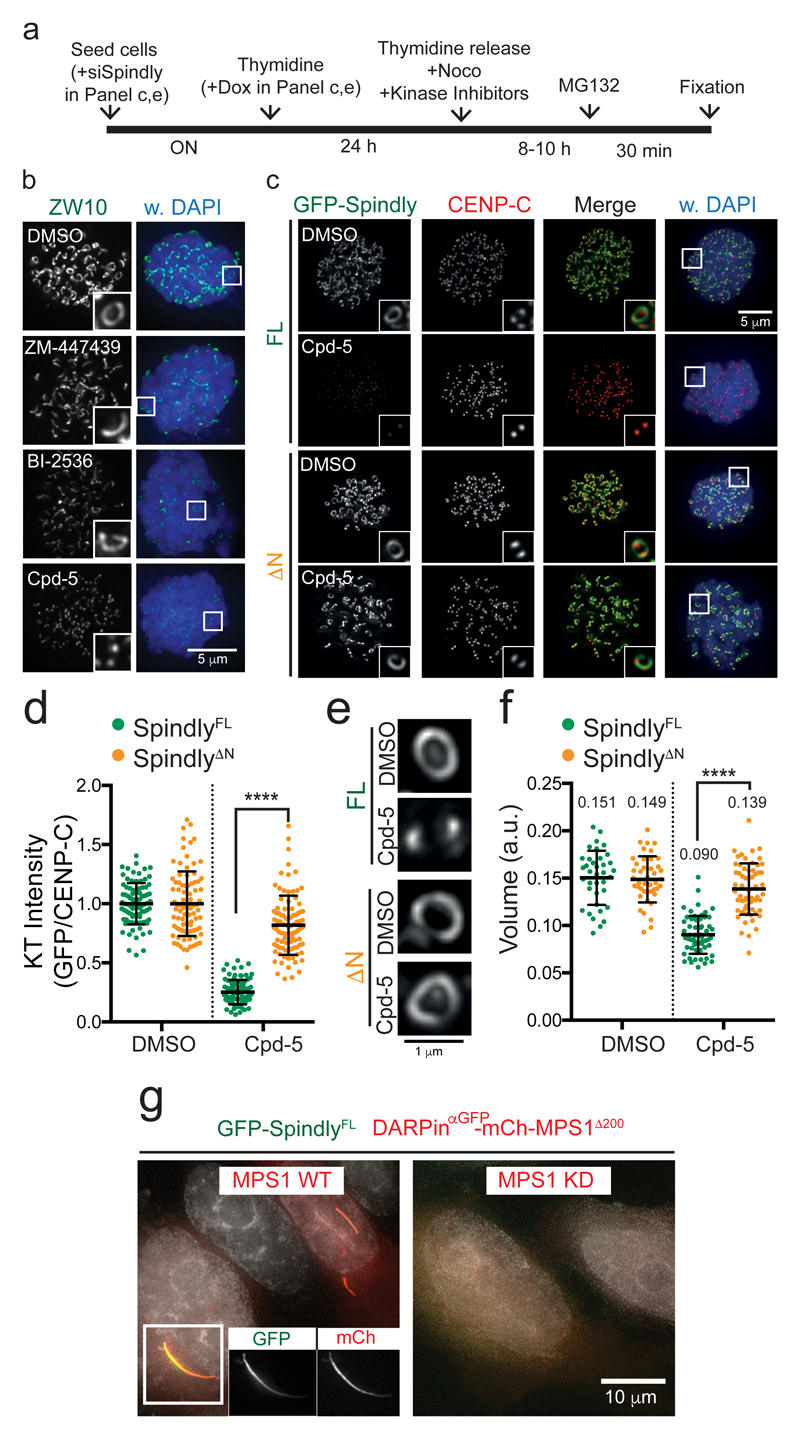
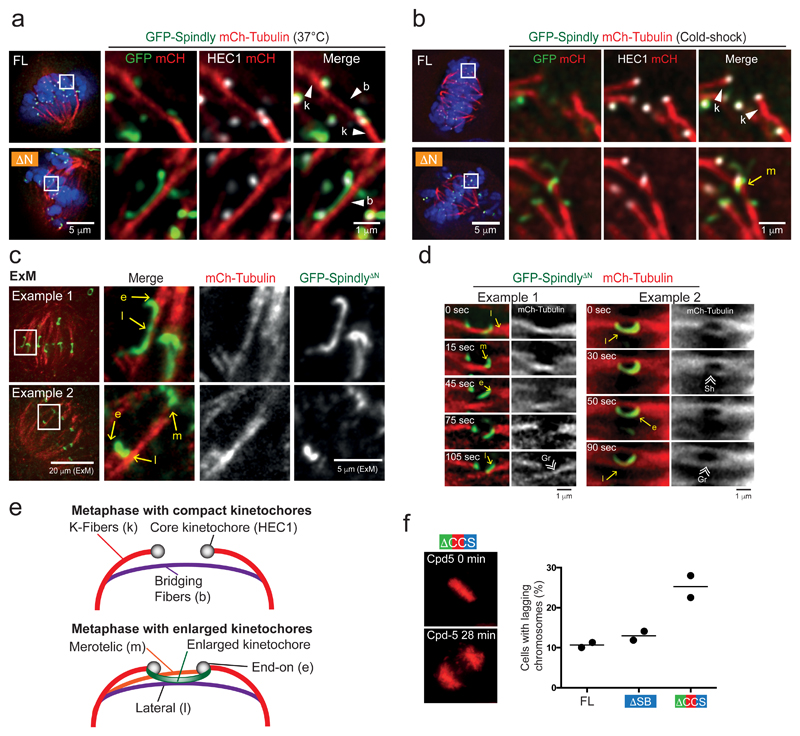
Faithful chromosome segregation depends on the ability of sister kinetochores to attach to spindle microtubules. The outer layer of kinetochores transiently expands in early mitosis to form a fibrous corona, and compacts following microtubule capture. Here we show that the dynein adaptor Spindly and the RZZ (ROD-Zwilch-ZW10) complex drive kinetochore expansion in a dynein-independent manner. C-terminal farnesylation and MPS1 kinase activity cause conformational changes of Spindly that promote oligomerization of RZZ-Spindly complexes into a filamentous meshwork in cells and in vitro. Concurrent with kinetochore expansion, Spindly potentiates kinetochore compaction by recruiting dynein via three conserved short linear motifs. Expanded kinetochores unable to compact engage in extensive, long-lived lateral microtubule interactions that persist to metaphase, and result in merotelic attachments and chromosome segregation errors in anaphase. Thus, dynamic kinetochore size regulation in mitosis is coordinated by a single, Spindly-based mechanism that promotes initial microtubule capture and subsequent correct maturation of attachments.


Conflict of interest statement

Declaration of Interests

The authors declare no competing interests.

Figures

Figure 1
Figure 1. Spindly recruits dynein to compact kinetochores upon microtubule attachment.
(a) Immunofluorescence images of ZW10 and HEC1 in HeLa cells treated with nocodazole or STLC. (A, Attached; U, Unattached). The experiment was repeated at least three times with similar results. (b) Overview of the secondary structure of human Spindly with predicted coiled-coils (grey bars) and disordered regions, and with sequence logos of four conserved motifs. See also Supplementary Figure 2. (c) Quantification of the kinetochore levels of p150Glued in nocodazole-treated HeLa cells transfected with siRNAs to Spindly and expressing the indicated GFP-Spindly variants. The graph in shows the mean kinetochore intensity (±SD) normalized to the values of SpindlyFL. Each dot represents one cell: FL (n= 206 cells), ΔCC2 (n= 200 cells), ΔSB (n= 192 cells), ΔCCS (n= 194 cells) pooled from seven independent experiments. ΔCC1 (n= 122 cells) pooled from four independent experiments. Asterisks indicate significance (one-way ANOVA followed by Tukey's test; F (4, 909) = 238.5). ****P < 0.001. Representative images of cells are shown in Supplementary Figure 3c. (e,f) Representative images (e) and quantification (f) of metaphase HeLa cells transfected with siRNA to Spindly and expressing the indicated GFP-Spindly variants. The graph shows the mean fold change in kinetochore intensity (±SD) normalized to the values of SpindlyFL. Each dot represents one cell: FL (n= 139 cells), ΔCC2 (n= 136 cells), ΔSB (n= 141 cells), ΔCCS (n = 165 cells) pooled from five independent experiments. ΔCC1 (n= 97 cells) pooled from four independent experiments. Asterisks indicate significance (one-way ANOVA followed by Tukey's test; F (4, 673) = 362.5). ****P < 0.001. Representative images of all the mutants are shown in Supplementary Figure 3d. (g) Representative immunofluorescence images of HeLa cells transfected with siRNA to Spindly and expressing the indicated GFP-Spindly variants, and immuno-stained for the indicated antigens. The experiment was repeated at least three times with similar results. See siSpindly control in Supplementary Figure 3b. (h) Representative images of the morphology of Spindly and CENP-C in metaphase kinetochores expressing the indicated GFP-Spindly variants. Stripping activity is based on ability of Spindly variants to recruit dynein/dynactin. The experiment was repeated at least three times with similar results.
Figure 2
Figure 2. Kinetochores expand by forming a structurally stable kinetochore sub-module.
(a,b) Representative images (a) and volume quantification (b) of the indicated GFP-tagged proteins in expanded kinetochores of HeLa cells entering mitosis in the presence of nocodazole. Maximum expanded kinetochores were selected based on ZW10 staining and imaging acquisition was set to obtain similar mean intensity levels for the different proteins. The graph shows the mean kinetochore volume (±SD). Each dot represents a pair of sister kinetochores: CENP-C (n= 380 kinetochores pooled from 12 experiments), GFP-HEC1 (n=101 pooled from four experiments), GFP-BUB1 (n=124 pooled from five experiments), GFP-KNL1 (n=62 pooled from three experiments), GFP-MAD1 (n=61 pooled from three experiments), GFP-Zwilch (n=69 pooled from three experiments), GFP-Spindly (n=69, pooled from three experiments), and ZW10 (n=461 pooled from nine experiments). (c) Representative immunofluorescence images of HeLa cells transfected with siRNA to Spindly and expressing GFP-Spindly entering mitosis in the presence of nocodazole and subsequently treated with the CDK1 inhibitor RO-3306 for 20 minutes. The experiment was repeated at least three times with similar results. (d) Images of kinetochores of HeLa cells transfected with siRNA to Spindly and expressing GFP-Spindly entering mitosis in the presence of nocodazole and subsequently treated with RO-3306 for 20 minutes, and immunostained with the indicated antibodies. The experiment was repeated at least three times with similar results. Color codes in (b) and (c) are explained in panel (e). (e) The cartoon illustrates the different pools of kinetochore proteins and the observation that the expandable module of the kinetochore (green) appears as cytoplasmic rods detached from the core kinetochore after the KMN network is disassembled upon CDK1 inhibition.
Figure 3
Figure 3. Spindly and RZZ are essential for kinetochore expansion.
(a-d) Representative images (a, b) and volume quantification (c, d) based on the indicated antigens of expanded kinetochores of nocodazole-treated HeLa cells transfected with siRNA to ZW10 (a,c) or Spindly (b,d). Imaging acquisition was set to obtain similar mean intensity levels for the different conditions. The graphs show the mean kinetochore volume (±SD). Each dot represents a pair of sister kinetochores. The sample size in (c) is: Control (n= 47 kinetochores), siZW10 (n= 55 kinetochores), pooled from three independent experiments. Asterisks indicate significance (Student’s t-test, two-tailed, unpaired; HEC1 (t=8.517 df=100); CENP-C: t=9.317 df=100). ****P < 0.0001. The sample size in (d) is: Spindly (n= 63 kinetochores pooled from three experiments), GFP-Zwilch (n= 55 kinetochores pooled from three three experiments), GFP-Zwilch in siSpindly (n= 52 kinetochores pooled from three three experiments), HEC1 (n= 30 kinetochores pooled from two experiments), HEC1 in siSpindly (n= 30 kinetochores pooled from two experiments, see Supplementary Table 3 for source data), MAD1 (n= 63 kinetochores pooled from three experiments), MAD1 in siSpindly (n= 63 kinetochores from three experiments), CENP-C (n= 63 kinetochores from three experiments), CENP-C in siSpindly (n= 63 kinetochores from three experiments). Asterisks indicate significance (Student’s t-test, two-tailed, unpaired; GFP-Zwilch (t=4.907 df=105); MAD1 (t=10.22 df=124); HEC1 (t=0.9724 df=58); CENP-C (t=0.5788 df=124). ****P < 0.0001; n.s., not significant. (e-g) Electron micrographs (e,f) and surface quantification (g) of the fibrous corona of nocodazole-treated cells depleted of ZW10 (e) or Spindly (f). The fibrous corona is highlighted in green and the outer plate in blue. Each dot represents one kinetochore: Control (n= 137 kinetochores), siSpindly (n= 122 kinetochores) pooled from two independent experiments. siZW10 (n=31 kinetochores from one experiment). Control is siGAPDH. See Supplementary Table 3 for source data. Quantification of the protein depletion efficiencies are shown in Supplementary Figure 4b,c.
Figure 4
Figure 4. Spindly stimulates RZZ-Spindly polymerization in vitro and in vivo.
(a) Fluorescence microscopy of purified mCherry-RZZ alone or in the presence of recombinant farnesylated Spindly (SpindlyFAR) and incubated as indicated. See also Supplementary Movie 1. The experiment was repeated with two independent RZZS preparations, with at least three replicates, and all samples gave similar results. (b) GFP-Spindly immobilized on beads and incubated in the presence of mCherry-RZZ and farnesylated Spindly (RZZS). Control is empty beads. The intensity level of the green channel in the control was enhanced to allow comparison with GFP-Spindly. The experiment was repeated with two independent RZZS preparations, with at least three replicates, and all samples gave similar results. (c) Immunofluorescence images of interphase HeLa cells expressing the indicated versions of GFP-Spindly and treated and stained as indicated. The experiment was repeated at least three times with similar results. See also Supplementary Movie 2.
Figure 5
Figure 5. A structural conformation of Spindly prevents RZZS oligomerization.
(a) Normalized Kratky plot (left graph) and paired distance distribution (right graph) of purified SpindlyFL and Spindly1-440. The intersection of the red dotted lines represents the peak for a globular protein irrespective of its molecular weight. Comparison with dimeric, tetrameric and hexameric coiled-coil models of similar size are shown in shades of grey. Rg, radius of gyration; Rc, cross-sectional radius of gyration; Dmax, maximum inter-particle distance. See also Supplementary Figures 6a-b and Supplementary Table 3 for source data. (b) Representative class averages from the negative stain EM of indicated Spindly variant proteins. (c) Elution profiles and SDS-PAGE of SEC experiments on Spindly1-250 and Spindly250-605 and their stoichiometric combination. AU, arbitrary units. The experiment was repeated at least three times with similar results. See Supplementary Table 3 for source data. (d) Surface Plasmon Resonance (SPR) analyses of the interaction between immobilized Spindly259-C (blue) or Spindly306-C (red) and soluble Spindly1-250. The response (y-axis) was normalized to the molecular weight of the analyte to yield stoichiometry of binding. The experiment was repeated three times with similar results. See Supplementary Table 3 for source data. (e) Immunofluorescence images of Spindly in interphase HeLa cells expressing the indicated truncations of GFP-Spindly. The experiment was repeated at least three times with similar results.
Figure 6
Figure 6. Release of Spindly autoinhibition promotes its interaction with RZZ.
(a) SPR analyses of the indicated Spindly variant proteins. The response (y-axis) was normalized to the molecular weight of the analyte to yield stoichiometry of binding. The experiment was repeated three times with similar results. See Supplementary Table 3 for source data. (b-e) Immunofluorescence (b,c) and quantification of kinetochore levels (d) or volumes (e) of Spindly in HeLa expressing GFP-SpindlyFL or GFP-SpindlyΔN and treated with nocodazole and the farnesyl transferase inhibitor Lonafarnib (Lon). In (c), imaging acquisition was set to obtain similar mean intensity levels for the different conditions. The graph in (d) shows the mean kinetochore intensity (±SD) normalized to the values of SpindlyFL. Each dot represents one cell: FL in DMSO (n= 122 cells), FL in Lonafarnib (n= 123 cells), ΔN in DMSO (n= 117 cells), and ΔN in Lonafarnib (n= 136 cells), pooled from four independent experiments. Asterisks indicate significance (one-way ANOVA followed by Tukey's test, F (3, 494) = 354.4). ****P < 0.001. The graph in (e) shows the mean kinetochore volume (±SD). Each dot represents a pair of sister kinetochores: FL in DMSO (n= 45 kinetochores), FL in Lonafarnib (n= 51 kinetochores), ΔN in DMSO (n= 44 kinetochores), and ΔN in Lonafarnib (n= 42 kinetochores), pooled from three independent experiments. Asterisks indicate significance (one-way ANOVA followed by Tukey's test; GFP-Spindly: F (3, 179) = 57.70; ZW10: F (3, 177) = 78.50). ****P < 0.001.
Figure 7
Figure 7. MPS1 promotes RZZS meshwork formation and kinetochore expansion.
(a) Timeline of the treatments with kinase inhibitors and nocodazole (Noco) of the experiments shown in b-f. (b) Representative images of ZW10 immunostainings of cells treated as indicated in (a). The intensity levels of the zoom ins (on right) were equalized to facilitate the direct comparison of the size of the kinetochores. The experiment was repeated at least three times with similar results. (c,d) Representative images (c) and quantification (d) of kinetochore localization of the indicated GFP-Spindly variants in HeLa cells treated with nocodazole and Cpd-5 as indicated in (a). The graph shows the mean kinetochore intensity (±SD) normalized to the values of SpindlyFL. Each dot represents one cell: FL in DMSO (n= 87 cells), FL in Cpd-5 (n = 92 cells), ΔN in DMSO (n= 87 cells), and ΔN in Cpd-5 (n= 93 cells), pooled from three independent experiments. Asterisks indicate significance (one-way ANOVA followed by Tukey's test; F (3, 355) = 255.6). ****P < 0.001. (e,f) Representative images (e) and volume quantification (f) of immunostained kinetochores of HeLa cells expressing the indicated versions of GFP-Spindly and treated as indicated in (a). In (e), imaging acquisition was set to obtain similar mean intensity levels for the different conditions. The graph shows the mean kinetochore volume (±SD). Each dot represents a pair of sister kinetochores: FL in DMSO (n= 37 kinetochores), FL in Cpd-5 (n= 48 kinetochores), ΔN in DMSO (n= 43 kinetochores), and ΔN in Cpd-5 (n= 60 kinetochores), pooled from three independent experiments. Asterisks indicate significance (one-way ANOVA followed by Tukey's test; F (3, 194) = 68.18). ****P < 0.001. (g) Representative images of HeLa cells overexpressing GFP-SpindlyFL and an active (WT) or kinase dead (KD) version of mCherry-MPS1Δ200 targeted to GFP-Spindly by DARPinαGFP. The experiment was repeated two times with similar results.
Figure 8
Figure 8. The expanded kinetochore module interacts with microtubule lattices and prevent bi-orientation.
(a,b) Representative single z-plane immunofluorescence images of HeLa cells in metaphase, transfected with siRNA to Spindly and expressing the indicated GFP-Spindly variants and mCherry-tubulin. Cells were fixed at 37°C (a) or after cold-shock (b). (‘b’, bridging fibers; ‘k’, k-fibers; ‘m’ merotelic attachment). The experiment was repeated at least three times with similar results. (c) Two examples of ExM (expansion microscopy) images of HeLa cells transfected with siRNA to Spindly and expressing GFP-SpindlyΔN and mCherry-tubulin. Single z-plane images show pairs of enlarged kinetochores with simultaneous end-on (e) and lateral (l) attachments (example 1) or end-on (e), lateral (l), and merotelic (m) attachments (example 2). The experiment was repeated at least three times with similar results. (d) Live-cell imaging of HeLa cells transfected with siRNA to Spindly and expressing GFP-SpindlyΔN and mCherry-tubulin. (‘Gr’, growing microtubules; ‘Sh’ shrinking microtubules; ‘e', end-on attachment; ‘l’, lateral attachment; ‘m’, merotelic attachment). Maximum projections of several z-planes are shown. See also Supplementary Movies 3 (Example 1) and 4 (Example 2). The experiment was repeated at least three times with similar results. (e) Cartoon summarizing the interaction of compacted or enlarged kinetochores with microtubule fibers. (f) Quantification of chromosome segregation errors by live-cell imaging of metaphase HeLa cells transfected with siRNA to Spindly, expressing the indicated GFP-Spindly variants, and treated with Cpd-5. The bar graph shows the mean percentage of cells showing lagging chromosomes of two independent experiments. (FL n= 222 cells; ΔSB n= 179 cells; ΔCCS n= 167). See Supplementary Table 3 for source data.

References

    1. Musacchio A, Desai A. A Molecular View of Kinetochore Assembly and Function. Biology (Basel) 2017;6:5. - PMC - PubMed
    1. Joglekar AP, Kukreja AA. How Kinetochore Architecture Shapes the Mechanisms of Its Function. Current Biology. 2017;27:R816–R824. - PMC - PubMed
    1. Etemad B, Kops GJ. Attachment issues: Kinetochore transformations and spindle checkpoint silencing. Current Opinion in Cell Biology. 2016;39:101–108. - PubMed
    1. Maiato H. The dynamic kinetochore-microtubule interface. J Cell Sci. 2004;117:5461–5477. - PubMed
    1. Maiato H, Gomes A, Sousa F, Barisic M. Mechanisms of Chromosome Congression during Mitosis. Biology (Basel) 2017;6:13. - PMC - PubMed

Publication types

MeSH terms