. 2018 Jul;50(7):979-989.
doi: 10.1038/s41588-018-0138-4. Epub 2018 Jun 18.

A precision oncology approach to the pharmacological targeting of mechanistic dependencies in neuroendocrine tumors

Affiliations

A precision oncology approach to the pharmacological targeting of mechanistic dependencies in neuroendocrine tumors

Mariano J Alvarez et al. Nat Genet. 2018 Jul.

Abstract

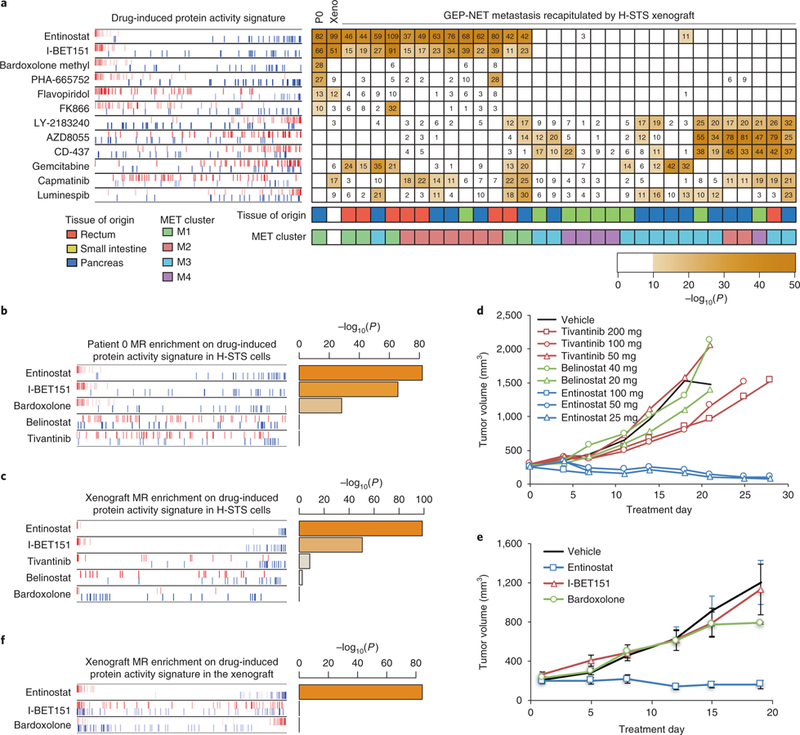
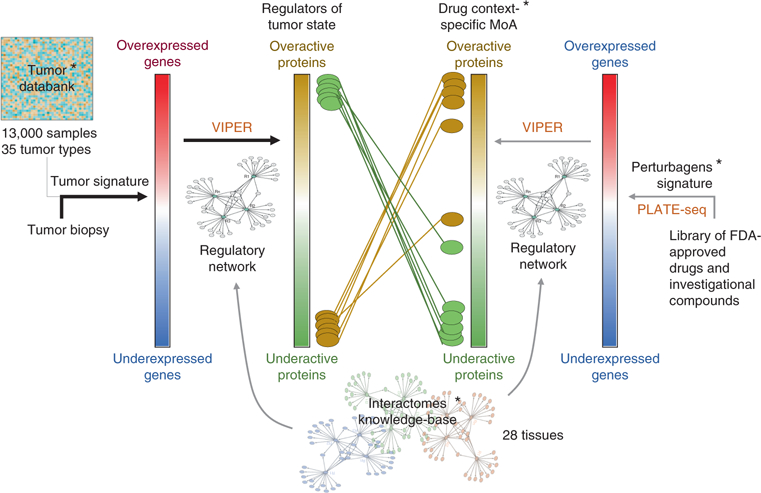
We introduce and validate a new precision oncology framework for the systematic prioritization of drugs targeting mechanistic tumor dependencies in individual patients. Compounds are prioritized on the basis of their ability to invert the concerted activity of master regulator proteins that mechanistically regulate tumor cell state, as assessed from systematic drug perturbation assays. We validated the approach on a cohort of 212 gastroenteropancreatic neuroendocrine tumors (GEP-NETs), a rare malignancy originating in the pancreas and gastrointestinal tract. The analysis identified several master regulator proteins, including key regulators of neuroendocrine lineage progenitor state and immunoevasion, whose role as critical tumor dependencies was experimentally confirmed. Transcriptome analysis of GEP-NET-derived cells, perturbed with a library of 107 compounds, identified the HDAC class I inhibitor entinostat as a potent inhibitor of master regulator activity for 42% of metastatic GEP-NET patients, abrogating tumor growth in vivo. This approach may thus complement current efforts in precision oncology.


Conflict of interest statement

Competing interests

M.J.A. is Chief Scientific Officer and equity holder at DarwinHealth, Inc., a company that has licensed some of the algorithms used in this manuscript from Columbia University. A.C. is founder and equity holder of DarwinHealth Inc. Columbia University is also an equity holder in DarwinHealth Inc.

Figures

Fig. 1 |
Fig. 1 |. GEP-NET molecular subtypes and master regulators for metastatic progression.
a, Unsupervised cluster analysis of 212 GEP-NET samples based on their gene expression profile. The heatmap shows the Pearson’s correlation coefficient. Samples were partitioned in four clusters and sorted according to their silhouette score (gray bars on the right of the heatmap). Each cluster average silhouette score is indicated by numbers. The tissue of origin is indicated in the top horizontal bar: rectum (red), small intestine (green) and pancreas (blue). The expression level (reads per kilobase of transcript per million mapped reads) for gastrin, glucagon, insulin, somatostatin and vasoactive intestinal polypeptide (VIP) is indicated by the bottom heatmap, as well as their association with the clusters (two-tailed P values estimated by ANOVA are shown on the right of the heatmap). b, Unsupervised cluster analysis based on the VIPER-inferred protein activity for 5,578 regulatory proteins. The heatmap shows the scaled similarity score computed by gene set enrichment analysis, using the aREA algorithm (Methods). c, Heatmap showing conservation of the top 50 most dysregulated proteins in association with liver metastasis between each possible sample pair. Clusters corresponding to panel b are indicated with a color-matching scheme in the second color bar. d, Heatmap showing relative protein activity for the top 20 most dysregulated proteins from each of the four clusters shown in panel c. The color bars on the right indicate the tissue of origin and correspondence to the five clusters depicted in panel b. The single-sample silhouette score and its cluster average are indicated to the right of the plot. MR, master regulator.
Fig. 2 |
Fig. 2 |. Conservation of metastasis master regulators in NET cell lines and a xenograft model.
a, Enrichment of the top 100 most dysregulated proteins from each hepatic metastasis on each cell line and the H-STS xenograft model protein activity signatures. The color of the heatmap is proportional to the Bonferroni-corrected P value for the test (one-tailed aREA test). The color bar on top of the plot indicates the tissue of origin for the primary tumor. The blue triangles indicate two P-NET metastases (patient 0, selected because master regulator proteins are strongly enriched in the H-STS and xenograft signatures, and patient 1, selected because master regulator proteins show no significant enrichment on H-STS and xenograft signatures) for which a detailed plot of this analysis is shown in be. be, Gene set enrichment analysis for the top 50 most positive and the top 50 most negative master regulators of each selected metastasis on the protein activity signature of the H-STS cell line (b,c), and the H-STS xenograft model (d,e). Enrichment score for the top 50 most de-activated (blue) and most activate (red) proteins in the metastasis is shown by the curves, and the projection of these proteins on the H-STS and the xenograft protein activity signatures—which are indicated by the color scale on the bottom of the plot—is indicated by the blue and red vertical lines, respectively. NES and Bonferroni-corrected P value (one-tailed aREA test) are indicated in the plots.
Fig. 3 |
Fig. 3 |. Cell surface marker master regulators on H-STS cells and effect of entinostat on their expression.
a, Flow cytometry detection of cell surface markers, as indicated in each row, on H-STS, KRJ-I and NCI-H716 cells. The lightly shaded histogram is the staining from the isotype control antibody. CD19 is not a top-predicted master regulator but is predicted to be expressed on H-STS cells, and it was followed as an immune-associated marker. b, Dual staining of cell surface markers in a shown with adjunct histograms. Only the data for H-STS cells are shown as representative. c, Effect of entinostat treatment of H-STS cells on cell surface markers. H-STS cells were treated with a sub-lethal dose of entinostat (~ED20, 7 μM) for 24 h, and flow cytometry staining performed with the indicated antibodies. DMSO-treated cells were used as a control. The background staining (solid gray line) was followed with the appropriate isotype control. For CD56, scatter pseudo-color dot plots of SSC-H versus FL1-H (CD56–FITC) are shown alongside the histogram. The figures represent a representative experiment of three.
Fig. 4 |
Fig. 4 |. Validation of GEP-NET metastasis master regulators.
a, Enrichment for the targets of 16 metastasis master regulators, including transcripts that, according to the regulatory model, are induced by the master regulator (indicated by the red vertical lines) and represented (blue vertical lines). The x axis indicates the GES for the patient 0 metastasis (genes were sorted from the most downregulated to the left, to the ones most upregulated, shown to the right) and H-STS cell line GES. Statistical significance is shown as Bonferroni’s corrected P value (two-tailed aREA test). b, Growth inhibition of H-STS cells, shown as a percentage of the control, six days after lentiviral vector-mediated transduction of shRNAs targeting the master regulator genes. Mammalian non-target shRNA was used as a control. The dotplot shows three replicates for each of the assessed hairpins (indicated with different colors). One-tailed P values were estimated by ANOVA. c, Schema for the possible evolution of NET as a part of the process of epithelial–mesenchymal transition. Evidence for this hypothesis is discussed in the main text.
Fig. 5 |
Fig. 5 |. Small-molecule compounds inverting the metastatic progression checkpoint activity as inferred by OncoTreat.
a, A heatmap showing the statistical significance for inversion of the top 100 master regulators of each tumor and H-STS xenograft model (columns) on the protein activity signature elicited by each drug perturbation (rows) on H-STS cells. Only tumors showing significant similarity, at the master regulator level, to the H-STS xenograft model (Fig. 2a) were included. The significance level is shown as –log10P, indicated by numbers (one-tailed aREA test, Bonferroni corrected). Only drugs significantly inverting the master regulators (P < 10−10) for at least ten metastases were included (see Supplementary Fig. 5 for full results). The enrichment plot to the left shows the enrichment of the patient 0 (P0) master regulators recapitulated by xenograft model on each drug perturbation protein activity signature. Master regulators are shown by red and blue vertical lines, indicating activated and inactivated master regulators, respectively. The plot shows their position on each drug (rows)-induced protein activity signature (x axis), such that for each drug, all 5,602 evaluated proteins were rank-sorted from the most inactivated to the most activated in response to drug treatment. b,c, Enrichment of patient 0 metastasis (b) and H-STS xenograft-checkpoint master regulators (c) on protein activity signatures induced by five selected compounds in H-STS cells. d,e, Growth curves for H-STS xenograft treated by vehicle control or each of five compounds. The curves show the tumor volume for individual animals (d) or the mean ± s.e.m. of eight animals (e). f, Enrichment of H-STS xenograft checkpoint on protein activity signatures induced by three selected compounds in H-STS xenograft.
Fig. 6 |
Fig. 6 |. Schematic diagram for the OncoTreat clinical pipeline.
The pipeline consists of a series of pre-computed (*) components, including a reference set of more than 13,000 tumor expression profiles representing 35 different tumor types, a collection of 28 tissue context-specific interactomes and a database of context-specific MoA for >400 Food and Drug Administration (FDA)-approved drugs and investigational compounds in oncology. This database is obtained by perturbing at least two cell lines per tissue type—which, in a quasi-orthogonal fashion, recapitulate the top master regulator proteins for the larger proportion of tissue-matched samples in the tumor databank—with the collection of drugs and compounds. The transcriptome of the perturbed cell lines is profiled at low cost by PLATE-Seq. The process begins with the expression profile of a single patient sample, which is compared against the tumor databank to generate a tumor gene expression signature. This signature is interpreted by VIPER using a context-matched interactome to identify the set of most dysregulated proteins, which constitute the regulators of the tumor cell state—the tumor checkpoint. These proteins are then aligned against the drugs’ and compounds’ MoA database, to prioritize compounds able to invert the activity pattern of the tumor checkpoint.

Comment in

  • H-STS, L-STS and KRJ-I are not authentic GEPNET cell lines.
    Hofving T, Karlsson J, Nilsson O, Nilsson JA. Hofving T, et al. Nat Genet. 2019 Oct;51(10):1426-1427. doi: 10.1038/s41588-019-0490-z. Nat Genet. 2019. PMID: 31548718 No abstract available.
  • Reply to 'H-STS, L-STS and KRJ-I are not authentic GEPNET cell lines'.
    Alvarez MJ, Yan P, Alpaugh ML, Bowden M, Sicinska E, Zhou CW, Karan C, Realubit RB, Mundi PS, Grunn A, Jäger D, Chabot JA, Fojo AT, Oberstein PE, Hibshoosh H, Milsom JW, Kulke MH, Loda M, Chiosis G, Reidy-Lagunes DL, Califano A. Alvarez MJ, et al. Nat Genet. 2019 Oct;51(10):1427-1428. doi: 10.1038/s41588-019-0509-5. Nat Genet. 2019. PMID: 31548719 Free PMC article. No abstract available.

Similar articles

Cited by

References

    1. Weinstein IB Addiction to oncogenes–the Achilles heal of cancer. Science 297, 63–64 (2002). - PubMed
    1. Tannock IF & Hickman JA Limits to personalized cancer medicine. N. Engl. J. Med 375, 1289–1294 (2016). - PubMed
    1. Commo F et al. Impact of centralization on aCGH-based genomic profiles for precision medicine in oncology. Ann. Oncol 26, 582–588 (2015). - PMC - PubMed
    1. MacConaill LE et al. Prospective enterprise-level molecular genotyping of a cohort of cancer patients. J. Mol. Diagn 16, 660–672 (2014). - PMC - PubMed
    1. Jang S & Atkins M Which drug, and when, for patients with BRAF-mutant melanoma? Lancet Oncol 14, e60–e69 (2013). - PubMed

Publication types

MeSH terms

Supplementary concepts