. 2018 Jun 4:9:670.
doi: 10.3389/fphys.2018.00670. eCollection 2018.

Involvement of GABAergic and Adrenergic Neurotransmissions on Paraventricular Nucleus of Hypothalamus in the Control of Cardiac Function

Affiliations

Involvement of GABAergic and Adrenergic Neurotransmissions on Paraventricular Nucleus of Hypothalamus in the Control of Cardiac Function

Michelle M Mendonça et al. Front Physiol. .

Abstract

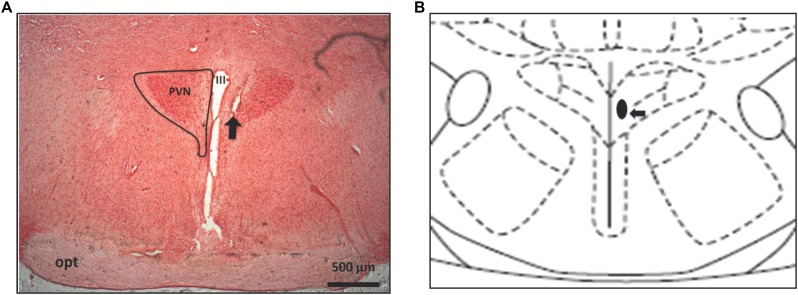
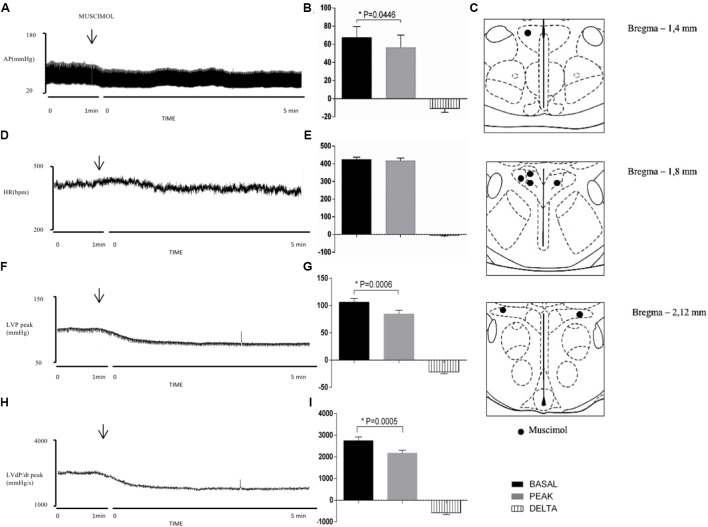
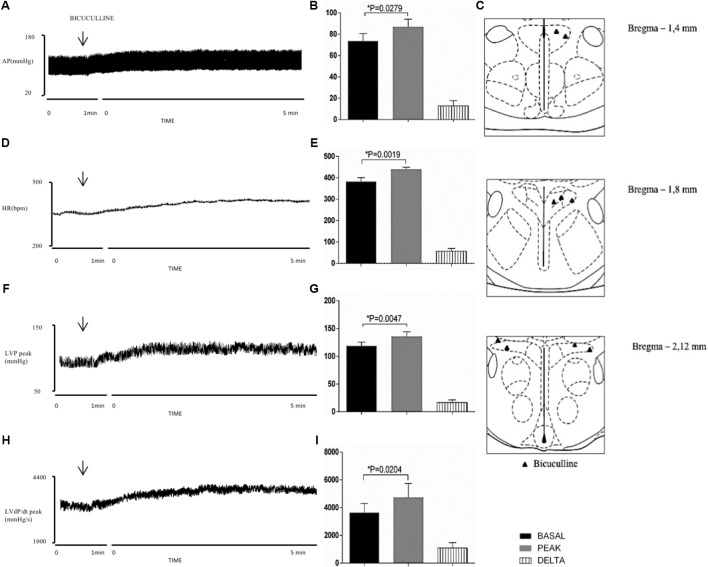
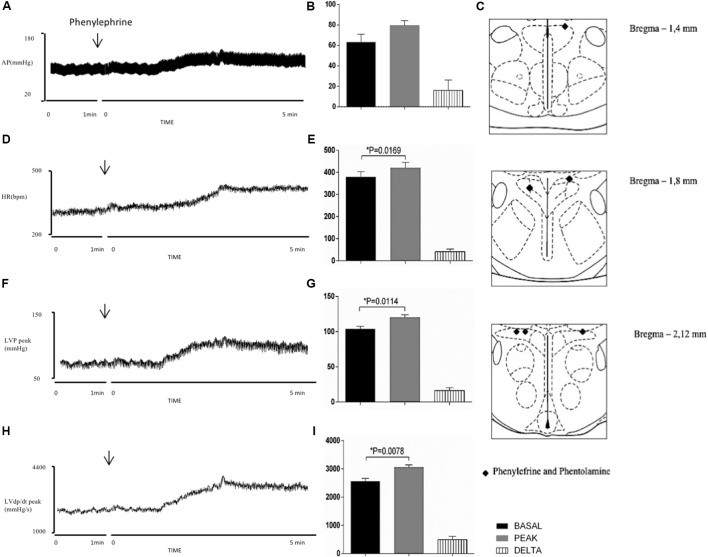
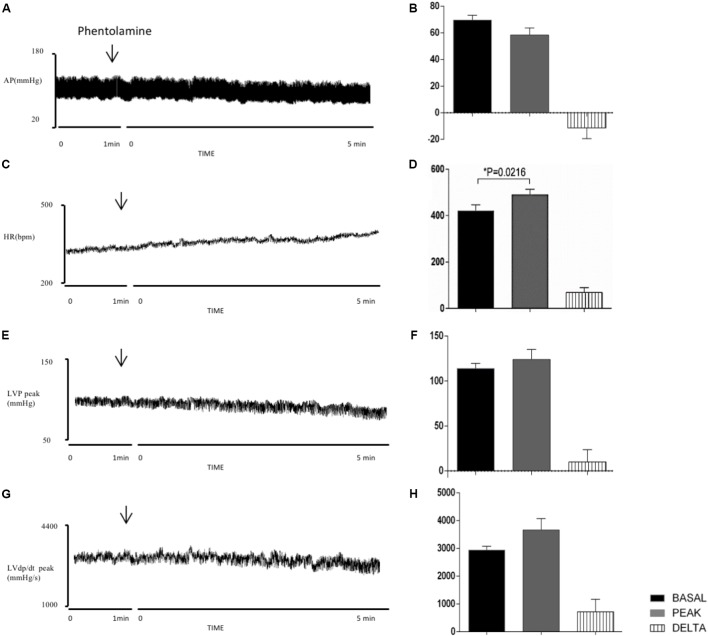
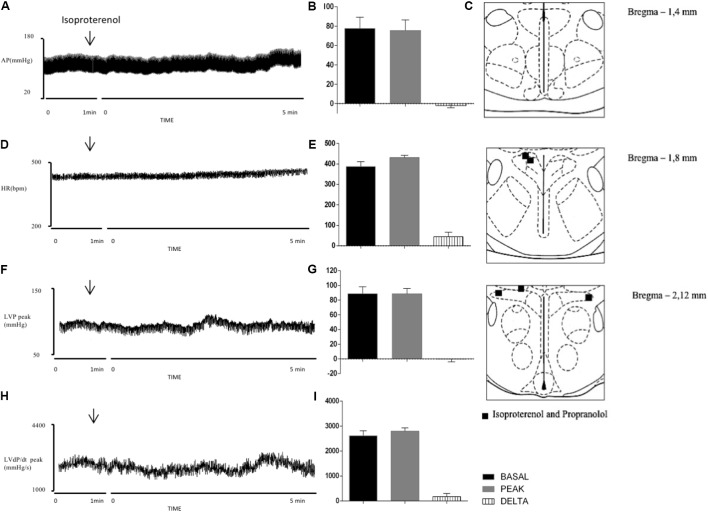
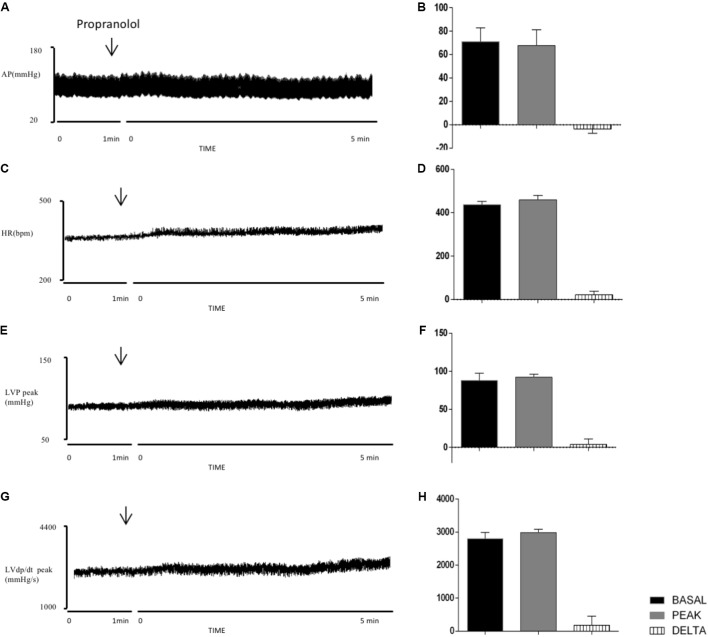
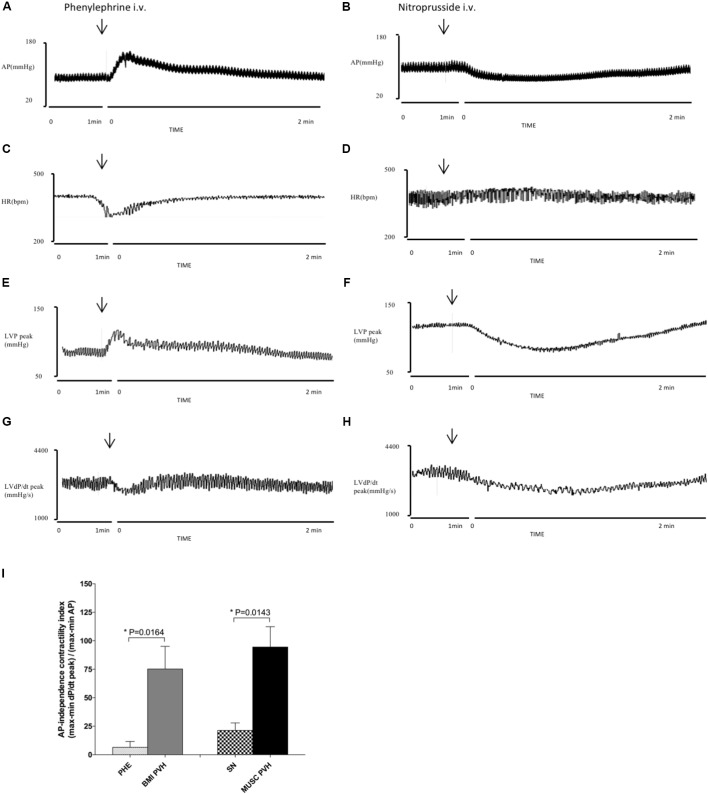
Sympathetic premotor neurons of the paraventricular hypothalamus (PVN) play a role in hemodynamics adjustments during changes in body fluid homeostasis. However, PVN contribution to the tonic control of cardiac function remains to be systematically studied. In this study, we assessed whether GABAergic and adrenergic synapses, known for being active in the PVN, are involved in the control of cardiac function. Adult male Wistar rats (250-350 g; n = 27) were anesthetized with urethane (1.2-1.4 g/kg i.p.) and underwent catheterization of femoral artery to record blood pressure and heart rate. The femoral vein was used to inject the vasoactive agents phenylephrine (10 μg/kg) and sodium nitroprusside (10 μg/kg) and to supplement anesthesia. The cardiac left ventricle was catheterized to record left ventricular pressure and its derivative. Craniotomy allowed for injections (100 nL) into the PVN of: muscimol (20 mM), bicuculline methiodide (0.4 mM), propranolol (10 mM), isoproterenol (100 μM), phentolamine (13 mM), phenylephrine (30 nM). We found that: (i) inhibition of PVN by muscimol, reduced arterial pressure, cardiac chronotropy and inotropy; (ii) disinhibition of PVN neurons by bicuculline evoked positive chronotropy and inotropy, and increase blood pressure; (iii) PVN alpha adrenergic receptors control cardiac chronotropy and inotropy; (iv) beta adrenergic receptors of the PVN do not influence cardiac function; (v) afterload does not contribute to the PVN-evoked inotropy. Our results indicate that the modulation of the activity of PVN neurons exerted by GABAergic and adrenergic mechanisms contribute to the control of cardiac function.

Keywords: autonomic nervous system; cardiac contractility; cardiac function; paraventricular nucleus; sympathetic nervous system.


Figures

FIGURE 1
FIGURE 1
Frontal section of the rat brain (40 μm) (A) and schematic representation showing the center of injection into PVN (B). The arrow indicates a microinjection site in PVN. PVN, paraventricular hypothalamus; III, third ventricle; OPT, optic tract.
FIGURE 2
FIGURE 2
Left column – Chart records illustrating the responses of MAP (A), HR (D), LVP peak (F), and LVdP/dt peak (H) produced by the unilateral microinjection of muscimol in the PVN (arrows indicate the moment of injection). Middle column – Mean maximal changes in MAP (B), HR (E), LVP peak (G), and LVdP/dt peak (I) in response to unilateral microinjections of muscimol (100 nl). Values refer to the means collected in the basal period (2 min before the central injection), and at the maximum point of response to microinjection of muscimol and its variation. P < 0.05. MAP, mean arterial pressure; HR, heart rate; LVP peak, maximum pressure in the left ventricle; LVdP/dt peak, first derivative of cardiac left ventricle pressure. Right column – Schematic representation of the injection sites stained by Evans blue dye from group injected with muscimol (100 nl) into PVN (C). n = 7.
FIGURE 3
FIGURE 3
Left column – Chart records illustrating the responses of MAP (A), HR (D), LVP peak (F) and LVdP/dt peak (H) produced by the unilateral microinjection of bicuculline in PVN (arrows indicate the moment of injection). Middle column – Mean maximal changes in MAP (B), HR (E), LVP peak (G), and LVdP/dt peak (I) in response to unilateral microinjections of bicuculline (100 nl). Values refer to the means collected in the basal period (2 min before the central injection), and at the maximum point of response to microinjection and its variation. P < 0.05. MAP, mean arterial pressure; HR, heart rate; LVP peak, maximum pressure in the left ventricle; LVdP/dt peak, first derivative of cardiac left ventricle pressure. Right column – Schematic representation of the injection sites stained by Evans blue dye from group injected with bicuculline (100 nl) into PVN (C). n = 9.
FIGURE 4
FIGURE 4
Left column – Chart records illustrating the responses of MAP (A), HR (D), LVP peak (F) and LVdP/dt peak (H) produced by the unilateral microinjection of phenylephrine into PVN (arrows indicate the moment of injection). Middle column – Mean maximal changes in MAP (B), HR (E), LVP peak (G), and LVdP/dt peak (I) in response to unilateral microinjections of phenylephrine (100 nl). Values refer to the means collected in the basal period (2 min before the central injection), and at the maximum point of response to microinjection and its variation. P < 0.05. MAP, mean arterial pressure; HR, heart rate; LVP peak, maximum pressure in the left ventricle; LVdP/dt peak, first derivative of cardiac left ventricle pressure. Right column – Schematic representation of the injection sites stained by Evans blue dye from group injected with phenylephrine and phentolamine (100 nl) group into PVN (C). n = 6.
FIGURE 5
FIGURE 5
Left column – Chart records illustrating the responses of MAP (A), HR (C), LVP peak (E), and LVdP/dt peak (G) produced by the unilateral microinjection of phentolamine in PVN (arrows indicate the moment of injection). Right column – Mean maximal changes in MAP (B), HR (D), LVP peak (F), and LVdP/dt peak (H) in response to unilateral microinjections of phentolamine (100 nl). Values refer to the means collected in the basal period (2 min before the central injection), and at the maximum point of response to microinjection and its variation. P < 0.05. MAP, mean arterial pressure; HR, heart rate; LVP peak, maximum pressure in the left ventricle; LVdP/dt peak, first derivative of cardiac left ventricle pressure. n = 6.
FIGURE 6
FIGURE 6
Left column – Charts records illustrating the responses of MAP (A), HR (D), LVP peak (F), and LVdP/dt peak (H) produced by the unilateral microinjection of isoproterenol in PVN (arrows indicate the moment of injection). Middle column – Mean maximal changes in MAP (B), HR (E), LVP peak (G), and LVdP/dt peak (I) in response to unilateral microinjections of isoproterenol (100 nl). Values refer to the means collected in the basal period (2 min before the central injection), and at the maximum point of response to microinjection and its variation. P < 0.05. MAP, mean arterial pressure; HR, heart rate; LVP peak, maximum pressure in the left ventricle; LVdP/dt peak, first derivative of cardiac left ventricle pressure. Right column – Schematic representation of the injection sites stained by Evans blue dye from group injected with isoproterenol and propranolol (100 nl) into PVN (C). n = 5.
FIGURE 7
FIGURE 7
Left column – Records illustrating the responses of MAP (A), HR (C), LVP peak (E), and LVdP/dt peak (G) produced by the unilateral microinjection of propranolol in PVN (arrows indicate the moment of injection). Right column – Mean maximal changes in MAP (B), HR (D), LVP peak (F), and LVdP/dt peak (H) in response to unilateral microinjections of propranolol (100 nl). Values refer to the means collected in the basal period (2 min before the central injection), and at the maximum point of response to microinjection and its variation. P ? 0.05. MAP, mean arterial pressure; HR, heart rate; LVP peak, maximum pressure in the left ventricle; LVdP/dt peak, first derivative of cardiac left ventricle pressure. n = 5.
FIGURE 8
FIGURE 8
Left column – Chart records illustrating the effects of i.v. injection of phenylephrine on MAP (A), HR (C), LVP peak (E), and LVdP/dt peak (G). Right column – Records illustrates the effects of i.v. sodium nitroprusside injection on MAP (B), HR (D), LVP peak (F), and LVdP/dt peak (H). Values refer to the means collected in the basal period (2 min before the central injection), and at the maximum point of response to i.v. injections. (I) AP-independence contractility index (for details, see “Materials and Methods”). n = 7.

Similar articles

Cited by

References

    1. Akine A., Montanaro M., Allen A. M. (2003). Hypothalamic paraventricular nucleus inhibition decreases renal sympathetic nerve activity in hypertensive and normotensive rats. Auton. Neurosci. 108 17–21. 10.1016/j.autneu.2003.08.009 - DOI - PubMed
    1. Allen A. M. (2002). Inhibition of the hypothalamic paraventricular nucleus in spontaneously hypertensive rats dramatically reduces sympathetic vasomotor tone. Hypertension 39 275–280. 10.1161/hy0202.104272 - DOI - PubMed
    1. Ambuhl P., Felix D., Khosla M. C. (1994). [7-D-ALA]-angiotensin-(1-7): selective antagonism of angiotensin-(1-7) in the rat paraventricular nucleus. Brain Res. Bull. 35 289–291. 10.1016/0361-9230(94)90103-1 - DOI - PubMed
    1. Arabia A. M., Catapano L., Storini C., Perego C., De Luigi A., Head G. A., et al. (2002). Impaired central stress-induced release of noradrenaline in rats with heart failure: a microdialysis study. Neuroscience 114 591–599. 10.1016/S0306-4522(02)00337-8 - DOI - PubMed
    1. Bachelard H., Harland D., Gardiner S. M., Kemp P. A., Bennett T. (1992). Regional haemodynamic effects of noradrenaline injected into the hypothalamic paraventricular nuclei of conscious, unrestrained rats: possible mechanisms of action. Neuroscience 47 941–957. 10.1016/0306-4522(92)90042-Z - DOI - PubMed

LinkOut - more resources