

Effect of Acute, Subacute, and Repeated Exposure to High Altitude (5050 m) on Psychomotor Vigilance
- PMID: 29915546
- PMCID: PMC5994420
- DOI: 10.3389/fphys.2018.00677
Effect of Acute, Subacute, and Repeated Exposure to High Altitude (5050 m) on Psychomotor Vigilance
Abstract
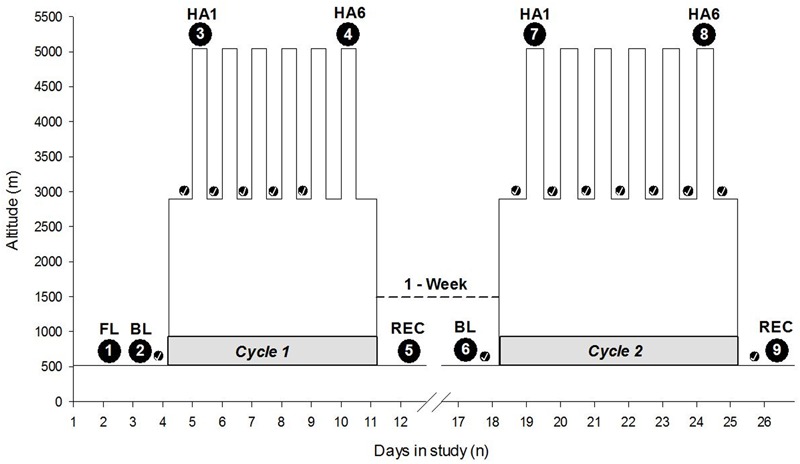
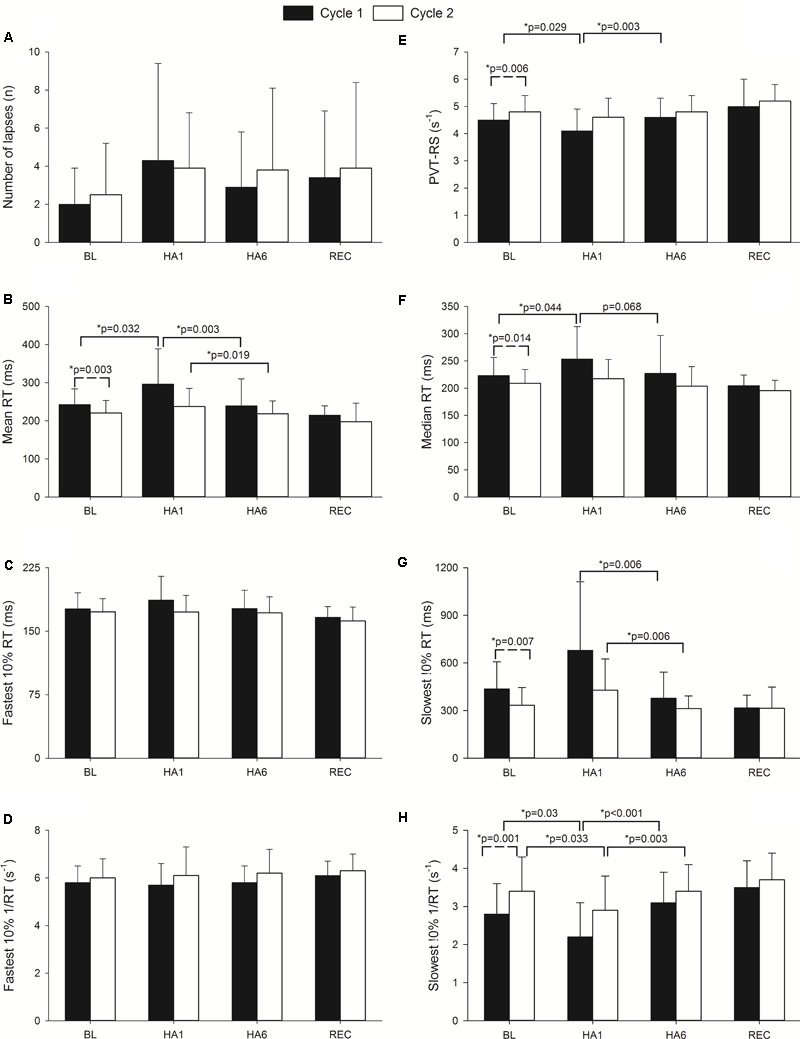
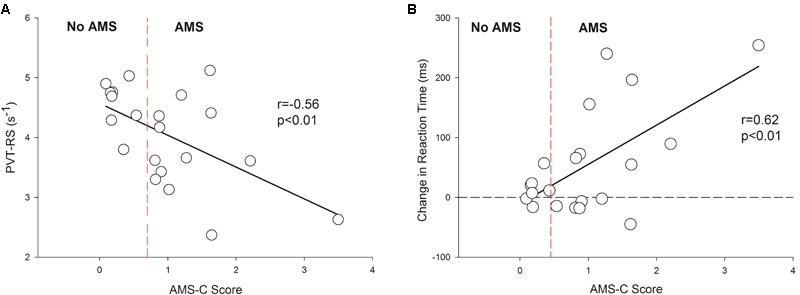
Aim: High altitude (HA) hypoxia may affect cognitive performance and sleep quality. Further, vigilance is reduced following sleep deprivation. We investigated the effect on vigilance, actigraphic sleep indices, and their relationships with acute mountain sickness (AMS) during very HA exposure, acclimatization, and re-exposure. Methods: A total of 21 healthy altitude-naive individuals (25 ± 4 years; 13 females) completed 2 cycles of altitude exposure separated by 7 days at low altitude (LA, 520 m). Participants slept at 2900 m and spent the day at HA, (5050 m). We report acute altitude exposure on Day 1 (LA vs. HA1) and after 6 days of acclimatization (HA1 vs. HA6). Vigilance was quantified by reaction speed in the 10-min psychomotor vigilance test reaction speed (PVT-RS). AMS was evaluated using the Environmental Symptoms Questionnaire Cerebral Score (AMS-C score). Nocturnal rest/activity was recorded to estimate sleep duration using actigraphy. Results: In Cycle 1, PVT-RS was slower at HA1 compared to LA (4.1 ± 0.8 vs. 4.5 ± 0.6 s-1, respectively, p = 0.029), but not at HA6 (4.6 ± 0.7; p > 0.05). In Cycle 2, PVT-RS at HA1 (4.6 ± 0.7) and HA6 (4.8 ± 0.6) were not different from LA (4.8 ± 0.6, p > 0.05) and significantly greater than corresponding values in Cycle 1. In both cycles, AMS scores were higher at HA1 than at LA and HA6 (p < 0.05). Estimated sleep durations (TST) at LA, 1st and 5th nights were 431.3 ± 28.7, 418.1 ± 48.6, and 379.7 ± 51.4 min, respectively, in Cycle 1 and they were significantly reduced during acclimatization exposures (LA vs. 1st night, p > 0.05; LA vs. 5th night, p = 0.012; and 1st vs. 5th night, p = 0.054). LA, 1st and 5th nights TST in Cycle 2 were 477.5 ± 96.9, 430.9 ± 34, and 341.4 ± 32.2, respectively, and we observed similar deteriorations in TST as in Cycle 1 (LA vs. 1st night, p > 0.05; LA vs. 5th night, p = 0.001; and 1st vs. 5th night, p < 0.0001). At HA1, subjects who reported higher AMS-C scores exhibited slower PVT-RS (r = -0.56; p < 0.01). Subjects with higher AMS-C scores took longer time to react to the stimuli during acute exposure (r = 0.62, p < 0.01) during HA1 of Cycle 1. Conclusion: Acute exposure to HA reduces the PVT-RS. Altitude acclimatization over 6 days recovers the reaction speed and prevents impairments during subsequent altitude re-exposure after 1 week spent near sea level. However, acclimatization does not lead to improvement in total sleep time during acute and subacute exposures.
Keywords: actigraphy; altitude; brain; hypoxia; psychomotor vigilance task; sleep.
Figures

Similar articles
-
Effects on Cognitive Functioning of Acute, Subacute and Repeated Exposures to High Altitude.Front Physiol. 2018 Aug 21;9:1131. doi: 10.3389/fphys.2018.01131. eCollection 2018. Front Physiol. 2018. PMID: 30246787 Free PMC article.
-
Effect of repeated normobaric hypoxia exposures during sleep on acute mountain sickness, exercise performance, and sleep during exposure to terrestrial altitude.Am J Physiol Regul Integr Comp Physiol. 2011 Feb;300(2):R428-36. doi: 10.1152/ajpregu.00633.2010. Epub 2010 Dec 1. Am J Physiol Regul Integr Comp Physiol. 2011. PMID: 21123763 Clinical Trial.
-
The effect of altitude pre-acclimatization on acute mountain sickness during reexposure.Aviat Space Environ Med. 1995 Oct;66(10):957-62. Aviat Space Environ Med. 1995. PMID: 8526832 Clinical Trial.
-
Preparation for football competition at moderate to high altitude.Scand J Med Sci Sports. 2008 Aug;18 Suppl 1:85-95. doi: 10.1111/j.1600-0838.2008.00836.x. Scand J Med Sci Sports. 2008. PMID: 18665956 Review.
-
Altitude preexposure recommendations for inducing acclimatization.High Alt Med Biol. 2010 Summer;11(2):87-92. doi: 10.1089/ham.2010.1006. High Alt Med Biol. 2010. PMID: 20586592 Review.
Cited by
-
Effect of acetazolamide on visuomotor performance at high altitude in healthy people 40 years of age or older-RCT.PLoS One. 2023 Jan 20;18(1):e0280585. doi: 10.1371/journal.pone.0280585. eCollection 2023. PLoS One. 2023. PMID: 36662903 Free PMC article. Clinical Trial.
-
Silent Hypoxemia of COVID-19 Pneumonia: Typical Courses With Implications for Outpatient Care.Dtsch Arztebl Int. 2021 Jan 11;118(1-2):8-9. doi: 10.3238/arztebl.m2021.0115. Dtsch Arztebl Int. 2021. PMID: 33750525 Free PMC article. No abstract available.
-
A review of methods for assessment of cognitive function in high-altitude hypoxic environments.Brain Behav. 2024 Feb;14(2):e3418. doi: 10.1002/brb3.3418. Brain Behav. 2024. PMID: 38409925 Free PMC article. Review.
-
Variation of Cognitive Function During a Short Stay at Hypobaric Hypoxia Chamber (Altitude: 3842 M).Front Physiol. 2019 Jun 26;10:806. doi: 10.3389/fphys.2019.00806. eCollection 2019. Front Physiol. 2019. PMID: 31316394 Free PMC article.
-
Acute high altitude exposure, acclimatization and re-exposure on nocturnal breathing.Front Physiol. 2022 Sep 5;13:965021. doi: 10.3389/fphys.2022.965021. eCollection 2022. Front Physiol. 2022. PMID: 36134332 Free PMC article.
References
-
- Allen D. N., Haderlie M. M. (2010). “Trail-Making test,” in The Corsini Encyclopedia of Psychology (Hoboken, NJ: John Wiley & Sons, Inc.).
LinkOut - more resources
Full Text Sources
Other Literature Sources
Research Materials