. 2018 Sep;223(7):3423-3445.
doi: 10.1007/s00429-018-1692-3. Epub 2018 Jun 18.

Ablation of the presynaptic organizer Bassoon in excitatory neurons retards dentate gyrus maturation and enhances learning performance

Affiliations

Ablation of the presynaptic organizer Bassoon in excitatory neurons retards dentate gyrus maturation and enhances learning performance

Anil Annamneedi et al. Brain Struct Funct. 2018 Sep.

Abstract

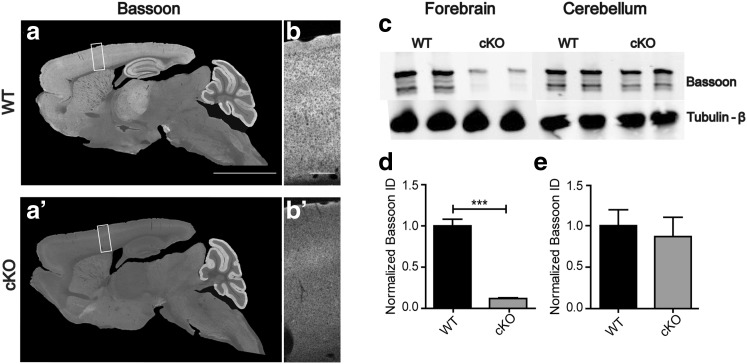
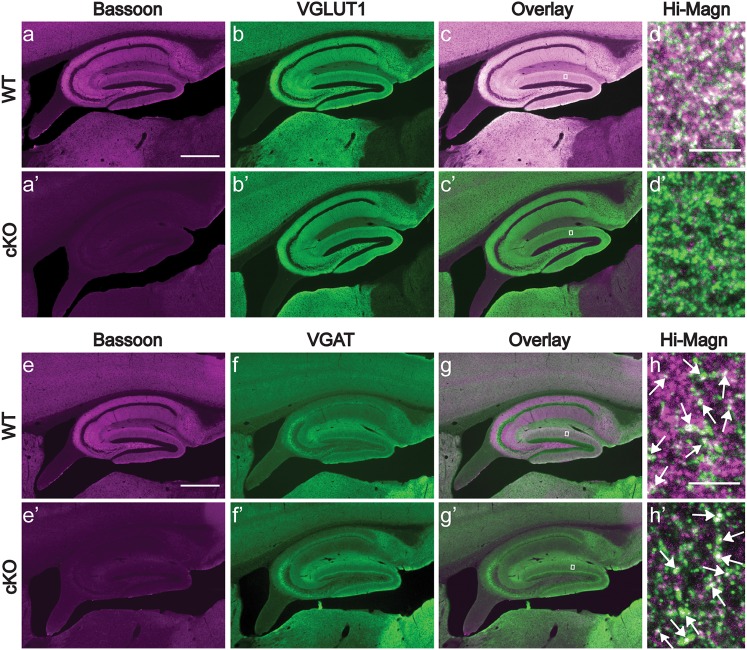
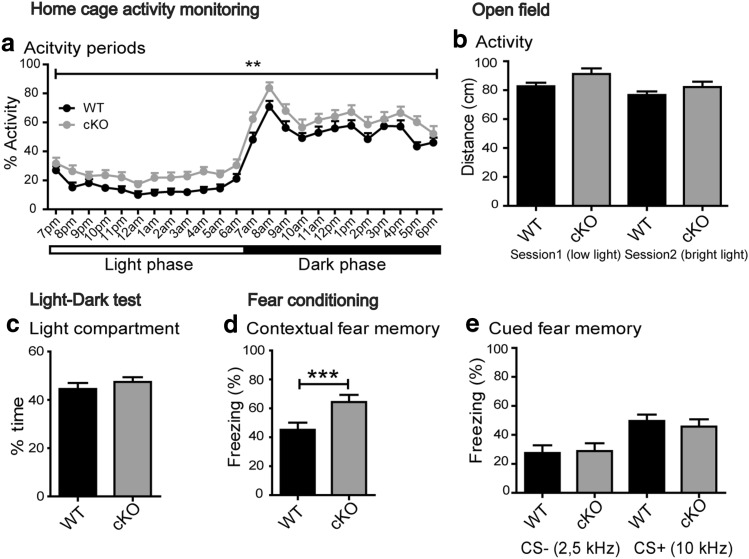
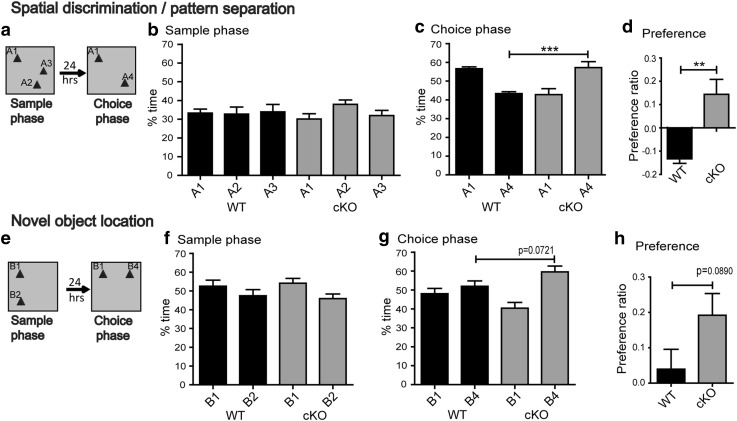
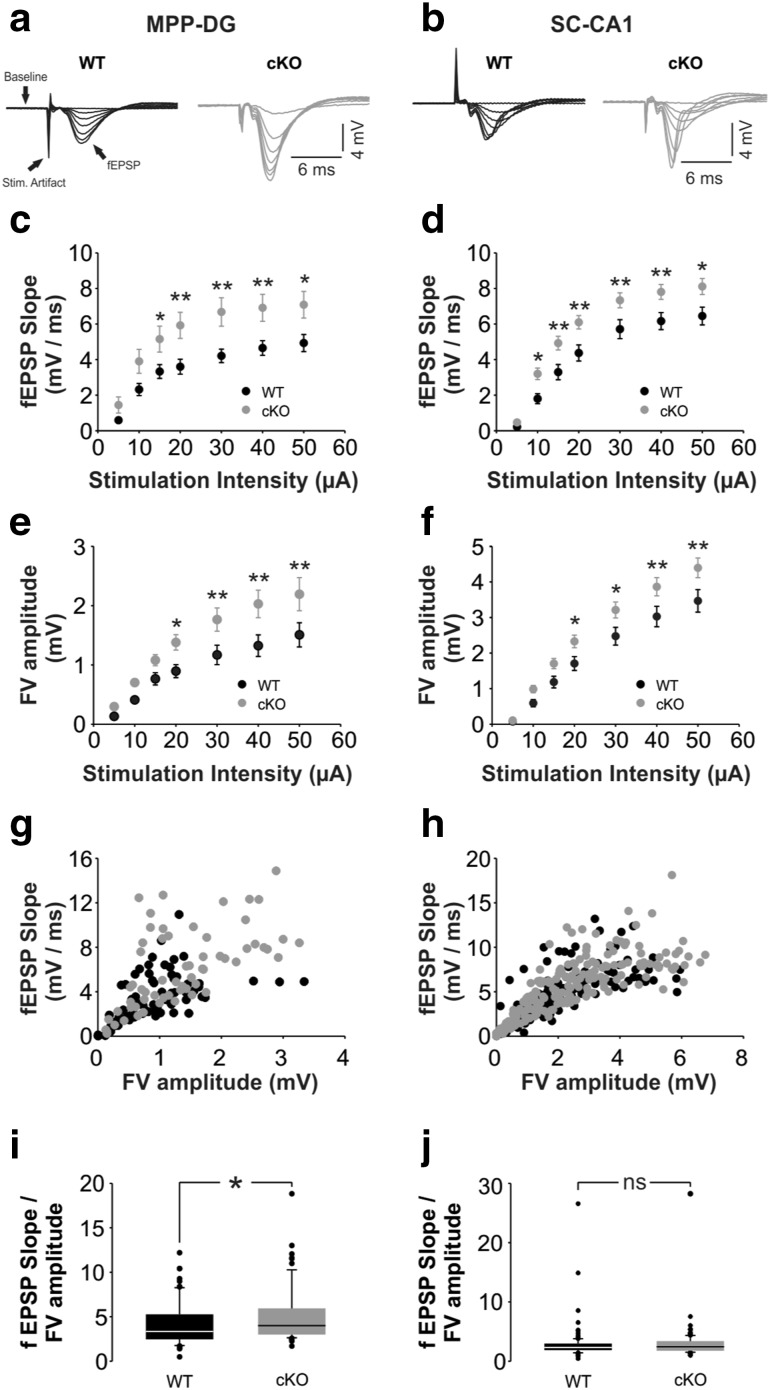
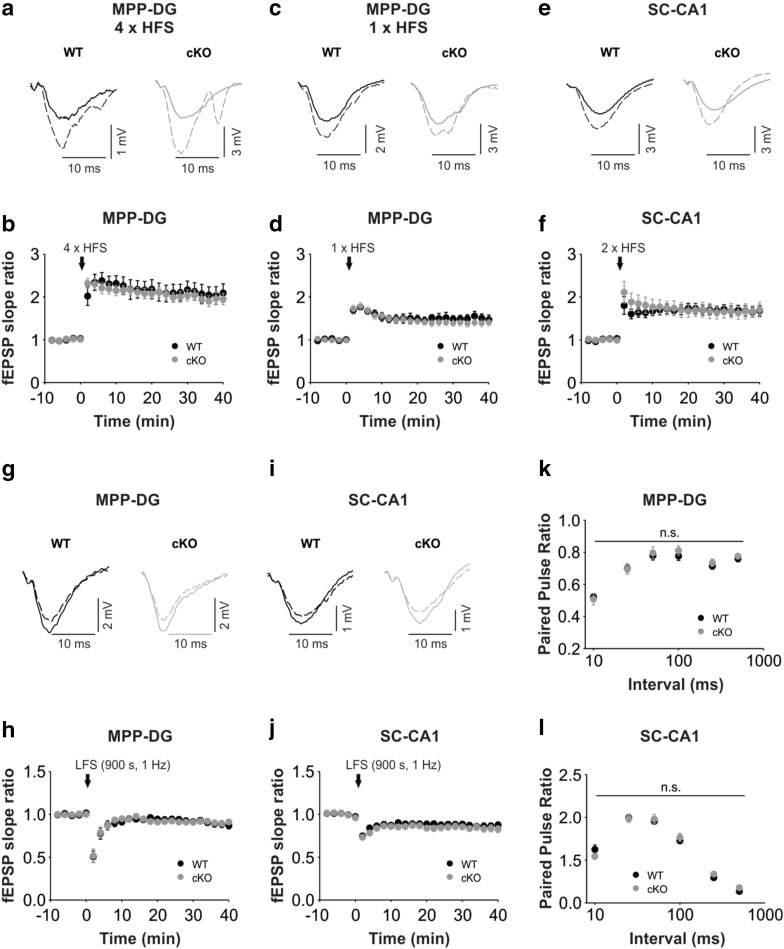
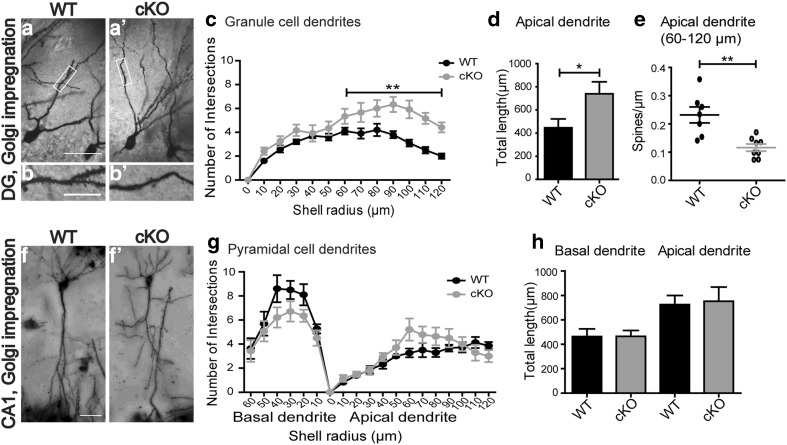
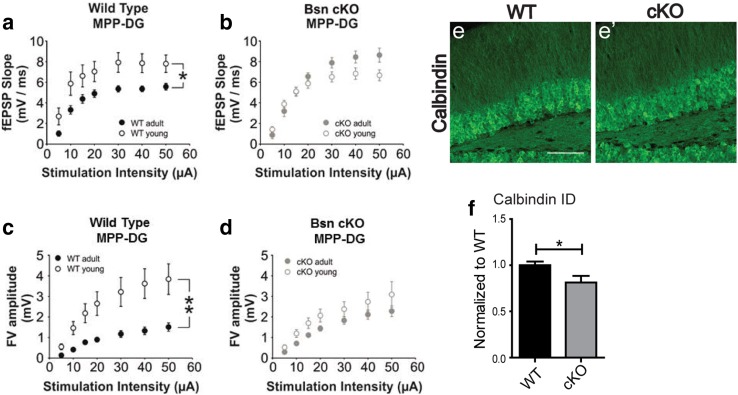
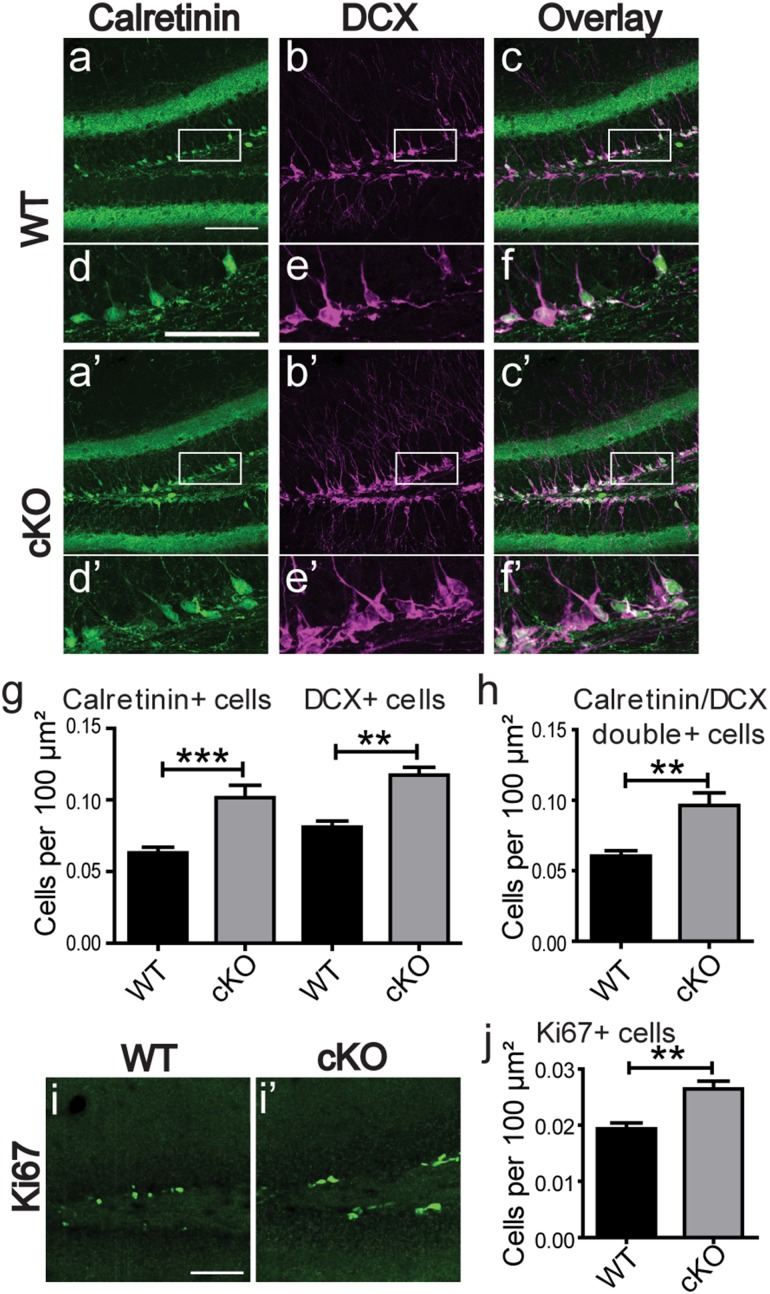
Bassoon is a large scaffolding protein of the presynaptic active zone involved in the development of presynaptic terminals and in the regulation of neurotransmitter release at both excitatory and inhibitory brain synapses. Mice with constitutive ablation of the Bassoon (Bsn) gene display impaired presynaptic function, show sensory deficits and develop severe seizures. To specifically study the role of Bassoon at excitatory forebrain synapses and its relevance for control of behavior, we generated conditional knockout (Bsn cKO) mice by gene ablation through an Emx1 promoter-driven Cre recombinase. In these animals, we confirm selective loss of Bassoon from glutamatergic neurons of the forebrain. Behavioral assessment revealed that, in comparison to wild-type littermates, Bsn cKO mice display selectively enhanced contextual fear memory and increased novelty preference in a spatial discrimination/pattern separation task. These changes are accompanied by an augmentation of baseline synaptic transmission at medial perforant path to dentate gyrus (DG) synapses, as indicated by increased ratios of field excitatory postsynaptic potential slope to fiber volley amplitude. At the structural level, an increased complexity of apical dendrites of DG granule cells can be detected in Bsn cKO mice. In addition, alterations in the expression of cellular maturation markers and a lack of age-dependent decrease in excitability between juvenile and adult Bsn cKO mice are observed. Our data suggest that expression of Bassoon in excitatory forebrain neurons is required for the normal maturation of the DG and important for spatial and contextual memory.

Keywords: Bassoon; Contextual fear memory; Immature DG; Knockout mice; Neurogenesis; Spatial memory.


Conflict of interest statement

The authors declare that they have no conflict of interest.

Figures

Fig. 1
Fig. 1
Bsn cKO mice lack Bassoon in forebrain region. Overview of sagittal brain sections from wild-type (WT) (a) and littermate Bsn cKO (a′) mice stained for Bassoon. Clear reduction in the expression of Bassoon is evident in the cKO forebrain regions (cerebral cortex, hippocampus); whereas cerebellum, midbrain and brain stem from both genotypes show no difference in Bassoon expression. High magnification details display Bassoon expression in the cerebral cortex of WT (b) and Bsn cKO mice (b′). c Western blots (10 µg protein/lane) of forebrain and cerebellum homogenates from WT and cKO brains showing expression levels of Bassoon and β-tubulin (loading control). d A strong reduction of Bassoon expression (~ 15% of WT levels) is evident in the forebrain of cKO mice (integrated density values normalized to WT). e No significant change in Bassoon expression can be observed in the cerebellum (N = 5). Scale bars 3 mm in a, 250 µm in b. All values are mean ± SEM; ***p ≤ 0.001, Student’s t test
Fig. 2
Fig. 2
Bsn cKO mice lack Bassoon in excitatory synapses of the hippocampus. Immunoreactivity of Bassoon (magenta, a, a′), VGLUT1 (green, b, b′) antibodies in hippocampal sections from WT and cKO mice depict the localization of Bassoon in all neuropil layers in WT (c, d) and loss of this immunoreactivity in cKO mice (c′, d′). For comparison, immunoreactivity of Bassoon (magenta, e, e′) and VGAT (green, f, f′) antibodies shown in the hippocampus of both WT (g) and cKO mice (g′) shows a more disparate distribution. Entangled areas from overlay images (high magnification images from molecular layer of DG, h and h′) demonstrate that Bassoon is still expressed in inhibitory synapses (indicated by white arrows). Residual labeling is evident in some non-GABAergic synapses, potentially arising from neuromodulatory afferences. Hi-Magn high magnification. Scale bar in a, e is 500 µm and high magnification d, h is 5 µm
Fig. 3
Fig. 3
Bsn cKO mice display increased contextual fear memory. a Analysis of home cage activity in WT (N = 20) and Bsn cKO (N = 19) mice suggests normal circadian rhythm with increased locomotion during the dark phase. Activity values of cKO mice are generally increased as compared to WT mice. b In an open field test WT and cKO mice show similar levels of exploratory activity under both low light and bright light illumination (distance explored) (WT: N = 24; cKO: N = 19). C Anxiety levels are unchanged in cKO mice as indicated by the percentage of time spent in light chamber during the light–dark test (WT: N = 12; cKO: N = 10). D Increased freezing towards the shock context is observed in cKO mice indicating an enhanced contextual fear memory. e By contrast no genotype difference is evident in the conditioned fear response towards the auditory tones in neutral context; both groups furthermore clearly differentiate the neutral acoustic stimulus (CS−) and conditioned acoustic stimulus (CS+) (WT: N = 13; cKO: N = 11). All values are mean ± SEM; **p ≤ 0.01, ***p ≤ 0.001, two-way repeated measures ANOVA with Bonferroni post hoc test (ae), Mann Whitney U test (c)
Fig. 4
Fig. 4
Bsn cKO mice display increased preference for the novel location in a spatial discrimination/pattern separation task. a Schematic illustration of the spatial discrimination/pattern separation task. b Both genotypes show a similar exploration of all three test objects during the sample phase (memory acquisition). c During the choice phase (memory test) WT mice spend more time exploring the object at the familiar location than the object at the novel location. By contrast, cKO mice clearly prefer the object at the novel location. d Preference ratio analysis reveal the increased preferences of the cKO mice for the object in the novel location during the choice phase (WT: N = 7; cKO: N = 9). e Schematic illustration of the novel object location task. f Both groups equally explore the objects in both the locations during the sample phase. g During the choice phase, cKO mice explore the object at the novel location much more than the object at the familiar location, whereas WT mice show only a weak preference. h Preference ratio reveal a non-significant trend towards an increased preference of cKO during the choice phase (WT: N = 8; cKO: N = 7). All values are mean ± SEM; **p ≤ 0.01, two-way ANOVA with Bonferroni post hoc test (b, f), Student’s t test and Mann Whitney U test (c, d, g, h)
Fig. 5
Fig. 5
Increased baseline transmission in Bsn cKO mice. a,b Merged traces of field excitatory postsynaptic potential (fEPSP) responses to increasing stimulation strengths (5–50 µA) at the MPP-DG (a) or SC-CA1 (b) synapse (WT: black; Bsn cKO: gray). Baseline recordings (5 ms) before each stimulation, the stimulation artifacts and fEPSPs are indicated by the arrows. Note the augmented fEPSPs in the cKO mice. c, d Summary graphs indicating increased synaptic excitability in both MPP-PP (c) and SC-CA1 (d) synapses of Bsn cKO mice (DG: N = 5 mice, n = 22 slices; CA1: N = 7 mice, n = 34 slices) compared to WT mice (DG: N = 6 mice, n = 21 slices; CA1: N = 5 mice, n = 27 slices). e, f Summary graphs indicating increased presynaptic fiber volley (FV) amplitude in both MPP-PP (e) and SC-CA1 (f) synapses of Bsn cKO mice (DG: N = 5 mice, n = 9 slices; CA1: N = 7 mice, n = 29 slices) compared to WT mice (DG: N = 6 mice, n = 11 slices; CA1: N = 5 mice, n = 23 slices). g, h Single FV amplitudes (mV) plotted against fEPSP slopes (mV/ms) for MPP-DG (g) and SC-CA1 (h) pathway. Note the specific increase in fEPSP slope values in response to similar preysnaptic FV amplitudes in the MPP-DG synapse of cKO mice. i, j Graphs summarizing fEPSP slope to FV amplitude ratios for MPP-DG (i) and SC-CA1 (j) pathway. Note the specific increase in ratios in the MPP-SC indicating an increased baseline synaptic efficacy. All values are expressed as mean ± SEM. *Significant difference to WT with p ≤ 0.05; **p ≤ 0.01; ns not significant (Two-way repeated ANOVA followed by posthoc comparison using Fisher LSD Method). MPP medial perforant path, DG dentate gyrus, SC Schaffer collaterals, CA1 Cornu ammonis area 1
Fig. 6
Fig. 6
Unaltered long- and short-term plasticity in the dorsal hippocampus of Bsn cKO mice. a, c Representative control fEPSP traces (WT: black line; Bsn cKO: gray line) and traces 35–40 min after (dashed lines) strong (4 × HFS, 1 s, 100 Hz; WT: N = 5 mice, n = 9 slices, cKO: N = 4 mice, n = 10 slices) (a) weak (1 × HFS, 1 s, 100 Hz; WT: N = 3 mice, n = 5 slices, cKO: N = 4 mice, n = 7 slices) (c) LTP induction protocols in the MPP-DG pathway. b, d Summary graphs showing similar LTP in both genotypes after (b) strong and (d) weak LTP induction. e Representative control fEPSP traces (WT: black line; Bsn cKO: gray line) and traces 35–40 min after (dashed lines) LTP induction (2 × HFS, 1 s, 100 Hz; WT: N = 3 mice, n = 8 slices, cKO: N = 3 mice, n = 10 slices) in the SC-CA1 pathway. f Summary graph showing comparable LTP in both genotypes in the SC-CA1 pathway. g, i Representative control fEPSP traces (WT: black line; Bsn cKO: gray line) and traces 35–40 min after (dashed lines) LTD induction (LFS, 900 s, 1 Hz) in the MPP-DG pathway (g; WT: N = 4 mice, n = 10 slices, cKO: N = 4 mice, n = 8 slices) and SC-CA1 (i WT: N = 4 mice, n = 7 slices, cKO: N = 4 mice, n = 7 slices) pathways. h, j Summary graphs showing no statistical difference between genotypes in the MPP-DG and SC-CA1 pathways. k, l Summary graphs indicating no significant difference in paired-pulse ratios at interval 10–500 ms between genotypes in the MPP-DG (k WT: N = 6 mice, n = 19 slices, cKO: N = 5 mice, n = 20 slices) and SC-CA1 synapses (l WT: N = 5 mice, n = 27 slices, cKO: N = 7 mice, n = 35 slices). All values are expressed as mean ± SEM. ns = not significant (aj Student’s t test or Mann Whitney U test; k, l Two-way repeated ANOVA followed by post hoc comparison using Fisher LSD Method)
Fig. 7
Fig. 7
Increased dendritic complexity, increased length and reduced spine density of DG granule cells in Bsn cKO mice. Example images of Golgi impregnation of dentate gyrus (DG) granule cells from WT (a) and Bsn cKO mice (a′) [high magnification of entangled area in lower panel showing spine density from WT (b) and cKO mice (b′)]. c Sholl analysis of apical dendrites shows an increased number of intersections in cKO mice compared to WT mice, indicating an enhanced dendritic arborization in cKO in a region 60–120 µm away from soma and d increased cumulative length of dendrites in cKO mice compared to WT mice (WT: N = 5 mice, n = 10 cells; cKO: N = 6 mice, n = 11 cells). e The density of spines measured in the region of increased dendritic arborization in cKO is reduced when compared WT littermates (N = 4 mice each; WT: n = 7 cells, cKO: n = 8 cells). Analysis of pyramidal cells in the CA1 region of WT (f) and cKO (f′) mice reveals no change in g, arborization of basal and apical dendrites or h, total dendritic branch length. Scale bar in a, f is 15 µm and in b is 5 µm. All values are mean ± SEM; *p ≤ 0.05, **p ≤ 0.01, two-way repeated measures ANOVA (c, g, h) and Student’s t test (d, e)
Fig. 8
Fig. 8
Lack of age-dependent electrophysiological maturation and reduced calbindin levels in the DG of Bsn cKO mice. a Summary graph showing the age-dependent decrease in baseline excitability in the MPP-DG synapse of WT mice (WT adult: N = 4 mice, n = 11 slices, WT young: N = 5 mice, n = 11 slices). b By contrast an age-dependent decrease in baseline excitability in the MPP-DG synapse cannot be seen in cKO mice (cKO adult: N = 4 mice, n = 11 slices, cKO young: N = 5 mice, n = 11 slices). c Summary graph showing a maturation-induced decrease in FV amplitudes in the MPP-DG synapse of WT mice (WT adult: N = 5 mice, n = 11 slices, WT young: N = 5 mice, n = 9 slices). d By contrast a similar age-dependent decrease in FV amplitudes is lacking at the MPP-DG synapse of cKO mice (cKO adult: N = 4 mice, n = 9 slices, cKO young: N = 5 mice, n = 10 slices). Representative dorsal hippocampus sections from WT (e) (N = 6) and cKO (e′) (N = 6) mice stained for calbindin as a marker of mature granule cells. f Quantification of calbindin labeling (integrated density values) confirms a reduced expression in cKO mice. Scale bar in e is 100 µm. All values are expressed as mean ± SEM. *p ≤ 0.05, **p ≤ 0.01, two-way repeated ANOVA followed by post hoc comparison using Fisher LSD Method (ac) Student’s t test (f)
Fig. 9
Fig. 9
Enhanced neurogenesis and increased numbers of immature granule cells in the DG of Bsn cKO mice. Representative dorsal hippocampus sections from WT (a, b) (N = 5) and cKO (a′, b′) (N = 6) mice were stained for calretinin and doublecortin (DCX) as markers of immature granule cells. Higher magnification of entangled area in lower panel depicting an increased labeling of both markers in cKO mice (d′, e′), when compared to WT mice (d, e). Overlay images showing the calretinin/DCX double positive cells in WT (c, f) and cKO mice (c′, f′). g, The densities of immature cells positive for calretinin or DCX, as well as h, double positive cells are significantly increased in cKO mice. Representative dorsal hippocampus sections from WT (i) (N = 5) and cKO (i′) (N = 5) mice stained for proliferative marker Ki67 in DG and j, increased number of Ki67 positive cells in cKO mice, indicating an increased neurogenesis. Scale bar in a, i is 100 µm and d is 50 µm. All values are expressed as mean ± SEM. **p ≤ 0.01, ***p ≤ 0.001, two-way repeated ANOVA followed by post hoc comparison using Bonferroni posttest (g) and Student’s t test (h, j)

References

    1. Ackermann F, Waites CL, Garner CC. Presynaptic active zones in invertebrates and vertebrates. EMBO Rep. 2015;16(8):923–938. - PMC - PubMed
    1. Akers KG, Arruda-Carvalho M, Josselyn SA, Frankland PW. Ontogeny of contextual fear memory formation, specificity, and persistence in mice. Learn Mem. 2012;19(12):598–604. - PubMed
    1. Albrecht A, Ivens S, Papageorgiou IE, Caliskan G, Saiepour N, Bruck W, Richter-Levin G, Heinemann U, Stork O. Shifts in excitatory/inhibitory balance by juvenile stress: a role for neuron-astrocyte interaction in the dentate gyrus. Glia. 2016;64(6):911–922. - PubMed
    1. Altmuller F, Pothula S, Annamneedi A, Nakhaei-Rad S, Montenegro-Venegas C, Pina-Fernandez E, Marini C, Santos M, Schanze D, Montag D, Ahmadian MR, Stork O, Zenker M, Fejtova A. Correction: aberrant neuronal activity-induced signaling and gene expression in a mouse model of RASopathy. PLoS Genet. 2017;13(6):e1006843. - PMC - PubMed
    1. Altrock WD, tom Dieck S, Sokolov M, Meyer AC, Sigler A, Brakebusch C, Fassler R, Richter K, Boeckers TM, Potschka H, Brandt C, Loscher W, Grimberg D, Dresbach T, Hempelmann A, Hassan H, Balschun D, Frey JU, Brandstatter JH, Garner CC, Rosenmund C, Gundelfinger ED. Functional inactivation of a fraction of excitatory synapses in mice deficient for the active zone protein bassoon. Neuron. 2003;37(5):787–800. - PubMed

MeSH terms

LinkOut - more resources