. 2018 Jun 19:7:e35987.
doi: 10.7554/eLife.35987.

Antibiotic-induced changes in the microbiota disrupt redox dynamics in the gut

Affiliations

Antibiotic-induced changes in the microbiota disrupt redox dynamics in the gut

Aspen T Reese et al. Elife. .

Abstract

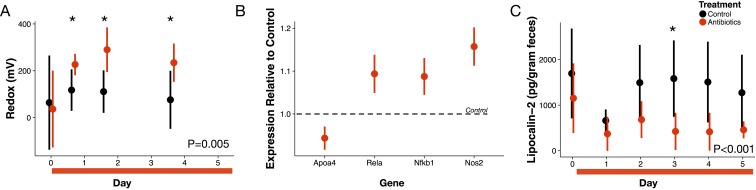
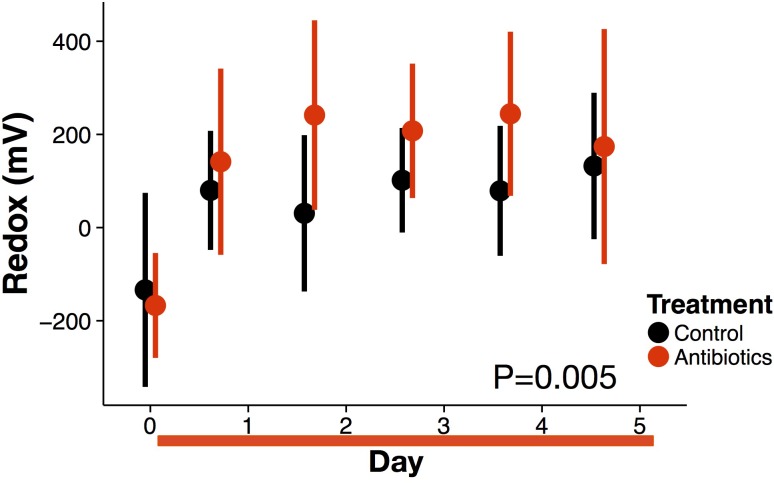
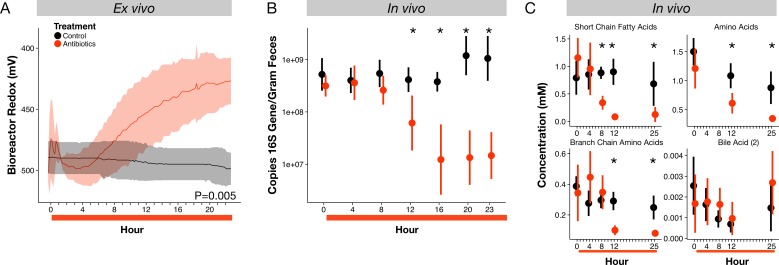
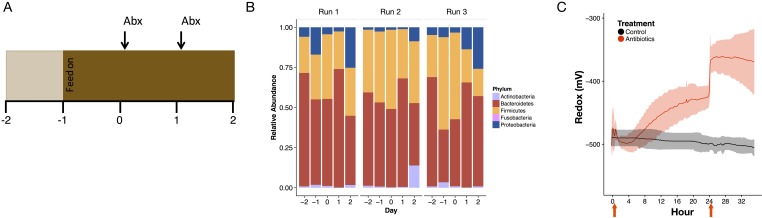
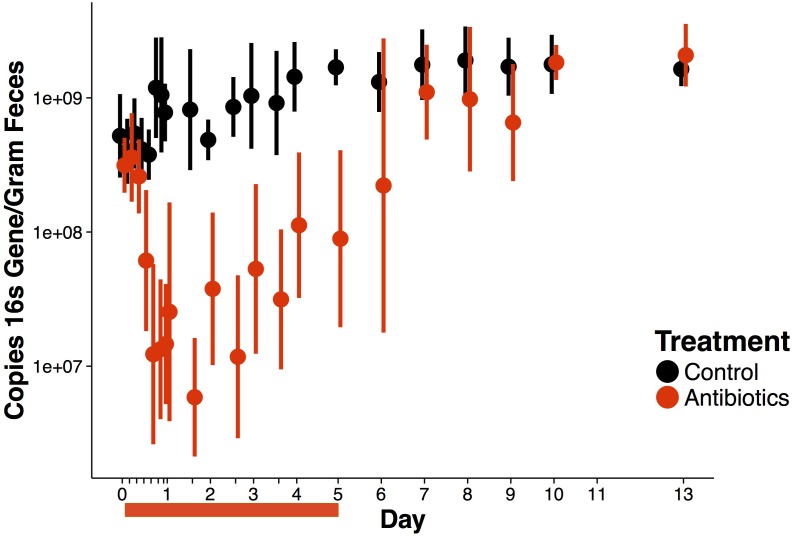
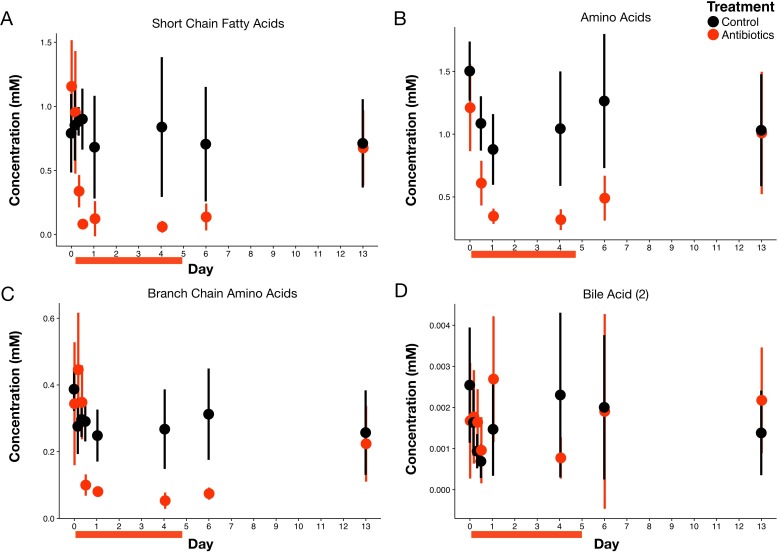
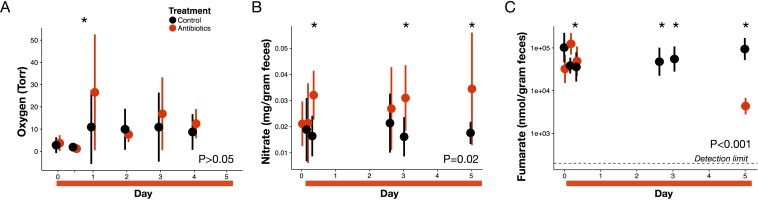
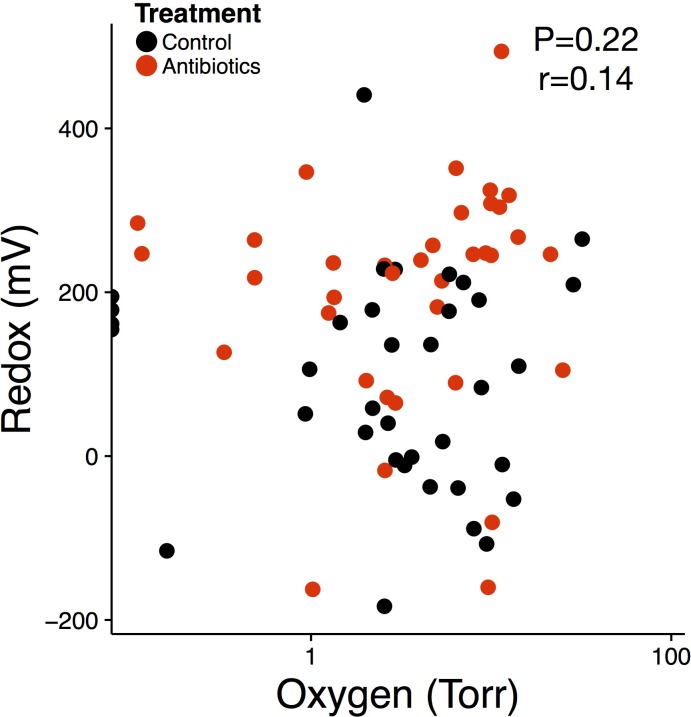
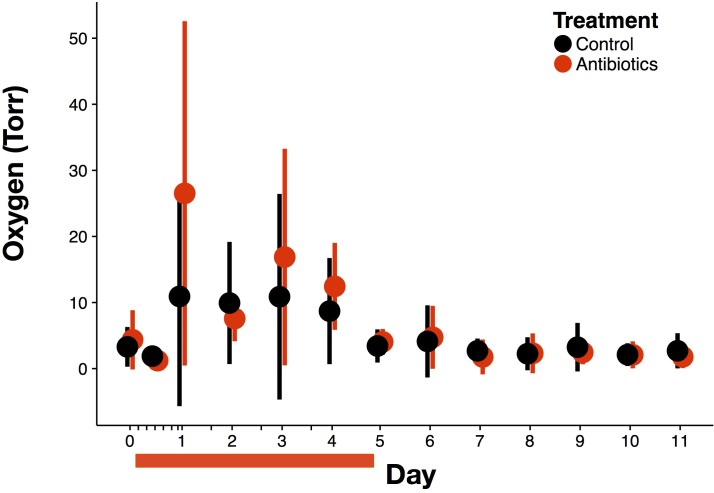
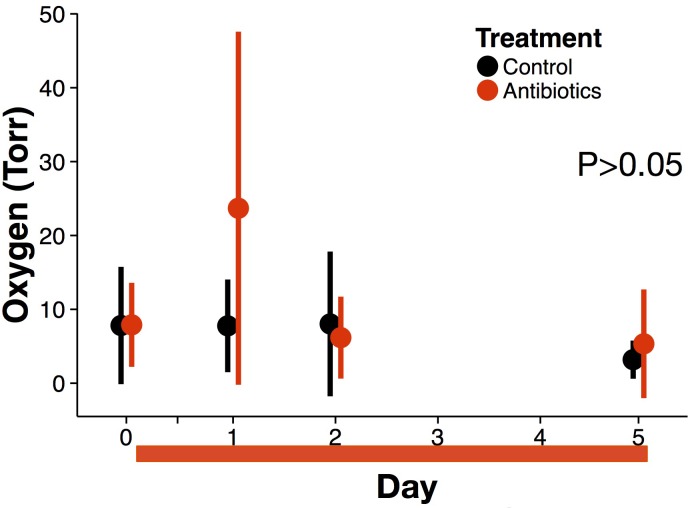
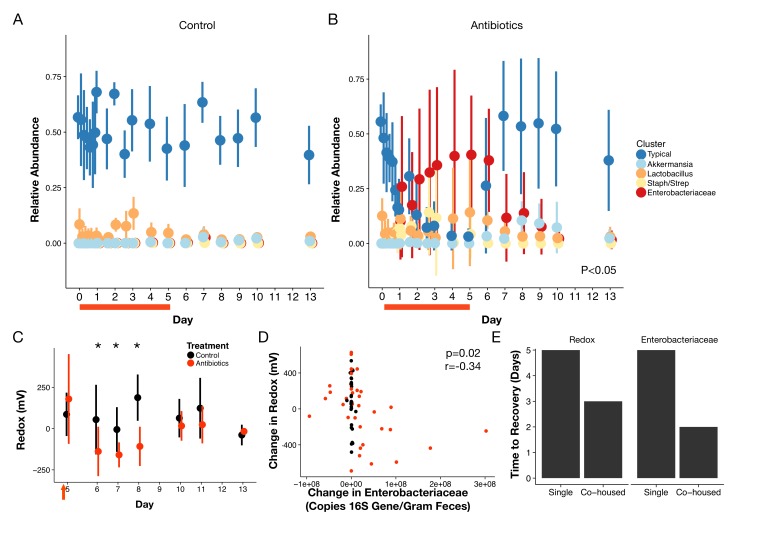
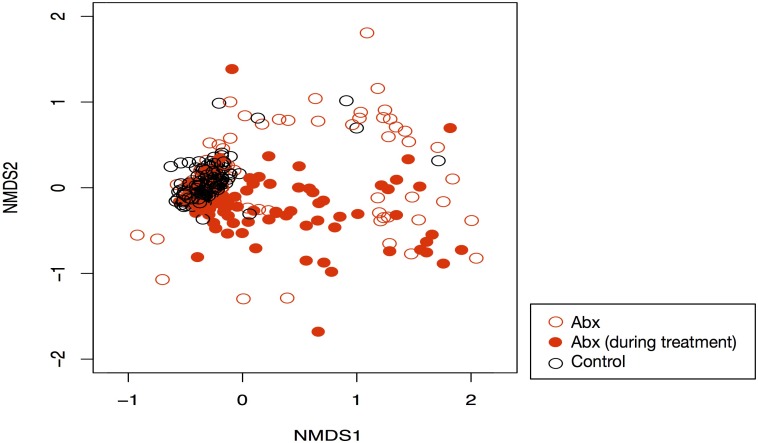
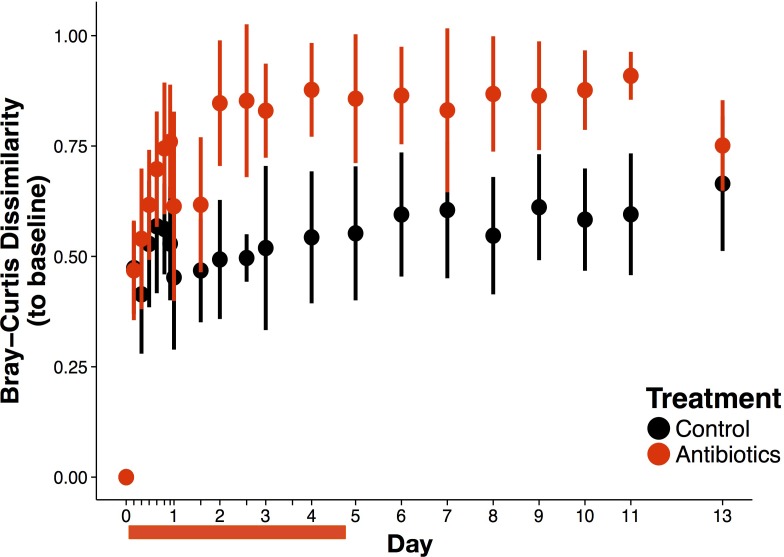
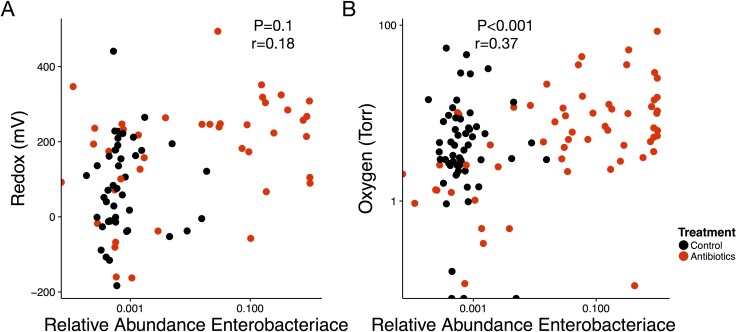
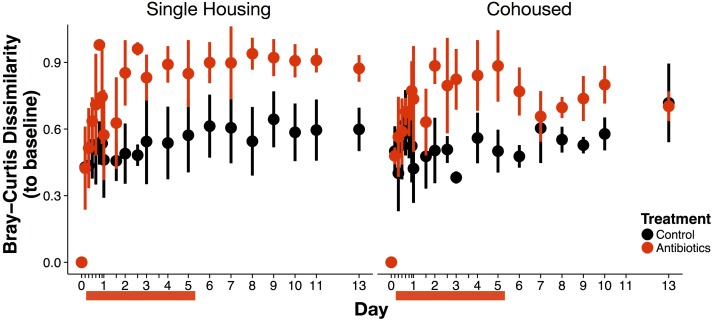
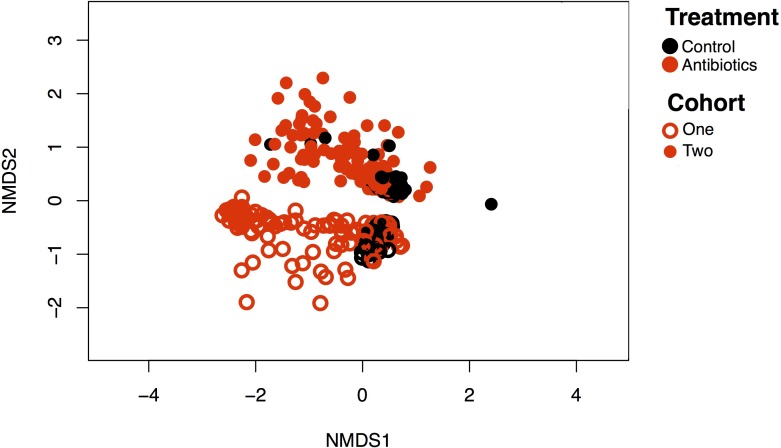
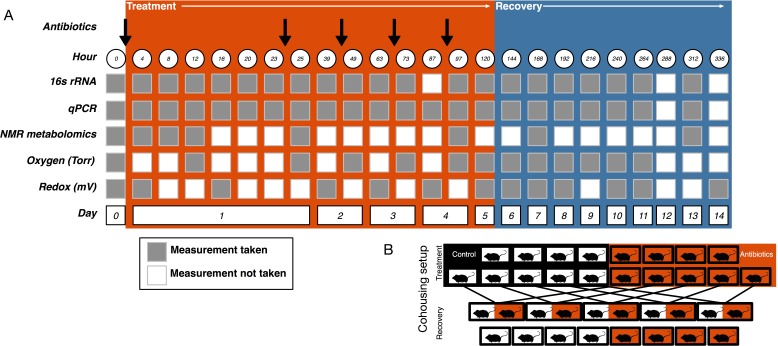
How host and microbial factors combine to structure gut microbial communities remains incompletely understood. Redox potential is an important environmental feature affected by both host and microbial actions. We assessed how antibiotics, which can impact host and microbial function, change redox state and how this contributes to post-antibiotic succession. We showed gut redox potential increased within hours of an antibiotic dose in mice. Host and microbial functioning changed under treatment, but shifts in redox potentials could be attributed specifically to bacterial suppression in a host-free ex vivo human gut microbiota model. Redox dynamics were linked to blooms of the bacterial family Enterobacteriaceae. Ecological succession to pre-treatment composition was associated with recovery of gut redox, but also required dispersal from unaffected gut communities. As bacterial competition for electron acceptors can be a key ecological factor structuring gut communities, these results support the potential for manipulating gut microbiota through managing bacterial respiration.

Keywords: antibiotics; gut microbiota; human; infectious disease; microbiology; mouse; redox potential; succession.


Conflict of interest statement

AR, EC, MV, HD, SJ, FM, SN, TO, JW, MD, LD No competing interests declared, BK Duke University has received support from Profusa, Inc. as an NIH subaward and additional corporate support for research. Dr. Klitzman has no equity ownership. He now has a consulting agreement and has received professorial sponsorship through Duke University from Profusa, Inc. SN Is the Director of Pre-Clinical and Advanced Technologies at Profusa, Inc. NW Is a Co-Founder and Chief Technology Officer of Profusa, Inc.

Figures

Figure 1.
Figure 1.. Antibiotic treatment effects on gut redox state and host inflammation.
(A) Redox state measured in freshly voided feces of treated (red) and control (black) mice (n = 9–10 per treatment) differed (p=0.005, linear mixed effects model likelihood tests). Replicate data is presented in Figure 1—figure supplement 2. (B) Gene expression for four inflammation associated genes measured with RT-qPCR of RNA isolated from feces on the final day of antibiotic treatment (n = 6–7) differed from control levels (p<0.05, Bonferroni-corrected one-sample t-tests). (C) Intestinal inflammation measured as fecal concentration of the biomarker lipocalin-2 (n = 9–10 per treatment) differed between treated and control mice (p<0.001 linear mixed effects model likelihood tests). Data are shown as means ± SD. Post-hoc test results for individual time points (* indicates p<0.05 Bonferroni-corrected Mann-Whitney U test) are included for visualization purposes. Antibiotic treatment began after Day 0 measurement; red bars indicate treatment duration.
Figure 1—figure supplement 1.
Figure 1—figure supplement 1.. Overall antibiotic effects on inflammation.
Intestinal inflammation measured as fecal concentration of the biomarker lipocalin-2 (n = 9–10 per treatment). Data are shown as means ± SD. Antibiotic treatment began after Day 0 measurement; red bars indicate treatment duration.
Figure 1—figure supplement 2.
Figure 1—figure supplement 2.. Redox potential data during treatment from replicate experimental run.
Redox state measured in freshly voided feces of treated (red) and control (black) mice (n = 9–10 per treatment) differed (p=0.005 linear mixed effects model likelihood tests). Data are shown as means ± SD. Antibiotic treatment began after Day 0 measurement; red bars indicate treatment duration.
Figure 2.
Figure 2.. Microbial response to antibiotics ex vivo and in vivo.
(A) Redox potential from control (black) and antibiotic treated (red) bioreactor vessels culturing human gut microbial communities (n = 3 per treatment) differed (p=0.005, linear mixed effects model likelihood tests). (B) Microbial load, measured as 16S rRNA gene copy number in antibiotic-treated and control mice decreased during the first 24 hr of treatment for antibiotic treated mice (n = 9–10 per treatment; p<0.001, Bonferroni-corrected Mann-Whitney U tests). (C) Metabolites measured with NMR spectrometry of feces (n = 9–10 per treatment; see Figure 2—figure supplement 3 and Supplementary file 1) decreased in antibiotic treated mice during the first 24 hr (p<0.001, Bonferroni-corrected Mann-Whitney U tests). Data are shown as means ± SD. Post-hoc test results for individual time points (* indicates p<0.05 Bonferroni-corrected Mann-Whitney U test) are included for visualization purposes. Antibiotic treatment began after Day 0 measurement; red bars indicate treatment duration.
Figure 2—figure supplement 1.
Figure 2—figure supplement 1.. Ex vivo bioreactor experiments demonstrate microbial change alone can alter redox levels.
(A) The experimental setup entailed the vessels acclimating for 2 days (the first day without new media feeding in) before experiencing two antibiotic doses of a cocktail including ampicillin, vancomycin, metronidazole, and neomycin (see Materials and methods). (B) Community composition of control vessels for each replicate run during the experimental timeframe. (C) Redox potential measured continuously with electrodes for two days with antibiotic doses (where relevant) at 0 and 24 (N = 3 per treatment). Red arrows indicate antibiotic dose.
Figure 2—figure supplement 2.
Figure 2—figure supplement 2.. Overall antibiotic effects on bacterial load.
Copies 16S rRNA gene as quantified by qPCR over time (n = 9–10 per treatment). Data are shown as means ± SD. Antibiotic treatment began after Day 0 measurement; red bars indicate treatment duration.
Figure 2—figure supplement 3.
Figure 2—figure supplement 3.. Overall antibiotic effects on metabolites.
Classes of metabolites measured with NMR spectrometry of feces (n = 9–10 per treatment) included short chain fatty acids (A), amino acids (B), branch chain amino acids (C), and a subclass of bile acids (D). See Supplementary file 1 for individual metabolite results with statistical analyses. Data are shown as means ± SD. Antibiotic treatment began after Day 0 measurement; red bars indicate treatment duration.
Figure 3.
Figure 3.. Electron acceptor levels during antibiotic treatment.
(A) Large intestine luminal oxygen concentration measured in vivo for treated (red) and control (black) mice (n = 9–10 per treatment) did not differ overall during treatment (p>0.05, linear mixed effects model likelihood tests). Replicate data are presented in Figure 3—figure supplement 2. (B) Fecal nitrate concentration (n = 2–9 per group per time point) did differ between treated and control mice during treatment (p=0.02, linear mixed effects model likelihood tests). (C) Fecal fumarate concentration (n = 2–9 per group per time point) also differed (p<0.001, linear mixed effects model likelihood tests). Electron acceptor levels below the detection level are not plotted here. For fumarate measurements where all treated animals were below the detection limit, values were set to 200 nmol for statistical tests. Data are shown as means ± SD. Post-hoc test results for individual time points (* indicates p<0.05 Bonferroni-corrected Mann-Whitney U test) are included for visualization purposes. Antibiotic treatment began after Day 0 measurement; red bars indicate treatment duration.
Figure 3—figure supplement 1.
Figure 3—figure supplement 1.. Redox level is not driven by oxygen concentration.
Repeated measures correlation between luminal oxygen concentration and gut redox potential of treated (red) and control (black) mice (n = 72).
Figure 3—figure supplement 2.
Figure 3—figure supplement 2.. Overall antibiotic effects on oxygen.
Luminal oxygen was measured in vivo during and following antibiotic treatment for all treated (red) and control (black) mice (n = 9–10 per treatment). Data are shown as means ± SD. Antibiotic treatment began after Day 0 measurement; red bars indicate treatment duration.
Figure 3—figure supplement 3.
Figure 3—figure supplement 3.. Oxygen data during treatment from replicate experimental run.
Oxygen measured in vivo of treated (red) and control (black) mice (n = 9–10 per treatment) did not differ (p>0.05 linear mixed effects model likelihood tests). Data are shown as means ± SD. Antibiotic treatment began after Day 0 measurement; red bars indicate treatment duration.
Figure 4.
Figure 4.. Gut community is resilient to antibiotic disturbance.
(A–B) Compositional dynamics of most abundant clusters during and after treatment for control (A) and treated (B) mice (n = 9–10 per treatment). Three groups (Typical, Staph/Strep, Enterobacteriaceae) differed significantly between groups (p<0.05, linear mixed effects model likelihood tests) during treatment and two (Enterobacteriaceae, Akkermansia) during recovery. (C) Redox potential measured in freshly voided feces of singly housed mice during the recovery period (n = 5 per treatment) was lower than treated mice initially (p<0.05, Bonferroni-corrected Mann-Whitney U tests). (D) Repeated measures correlation was significant (p=0.02) between change in Enterobacteriaceae abundance and change in redox potential during the first three days of post-antibiotic recovery (n = 64). (E) Days until there is no significant difference (p>0.05 Bonferroni-corrected Mann Whitney U test) between groups of control and treated animals for redox and Enterobacteriaceae abundance, under either singly- housed or co-housed settings. Red bars indicate treatment duration (A–B). Red arrows indicate the last antibiotic dose; day six measurements are more than 24 hr after the last dose (C). Data are shown as means ± SD. Post-hoc test results for individual time points (* indicates p<0.05 Bonferroni-corrected Mann-Whitney U test) are included for visualization purposes.
Figure 4—figure supplement 1.
Figure 4—figure supplement 1.. Antibiotic driven community composition changes.
NMDS of community dynamics during and after antibiotic treatment (filled red circles are treated mice during treatment; empty red circles are treated mice during recovery; black circles are controls). Treatment had a significant effect on composition (p<0.05, PERMANOVA).
Figure 4—figure supplement 2.
Figure 4—figure supplement 2.. Overall antibiotic effects on beta-diversity.
Bray-curtis dissimilarity to baseline composition of bacterial community over time (n = 9–10 per treatment). Data are shown as means ± SD. Antibiotic treatment began after Day 0 measurement; red bars indicate treatment duration.
Figure 4—figure supplement 3.
Figure 4—figure supplement 3.. Abundance of the Enterobacteriaceae is associated with abiotic conditions and changes in redox state.
(A) Repeated measures correlation between Enterobacteriaceae relative abundance in feces and redox potential of treated (red) and control (black) mice (n = 85). (B) Repeated measures correlation between Enterobacteriaceae relative abundance in feces and oxygen concentration (n = 116).
Figure 4—figure supplement 4.
Figure 4—figure supplement 4.. Post-antibiotic succession can occur within one week but is mediated by cohousing status of mice.
Community changes measured as Bray-Curtis dissimilarity relative to day 0 composition for singly- versus co-cohoused treated (red) and control (black) mice (n = 9–10 per treatment). Co-housed mice treated with antibiotics were indistinguishable from control mice at the end of the recovery period (p>0.05, Bonferroni-corrected Mann-Whitney U test), but singly housed treated mice were not. Data are shown as means ± SD. Red bars indicate the duration of antibiotic treatment.
Figure 4—figure supplement 5.
Figure 4—figure supplement 5.. Mouse cohorts differ in original community state but not response trends.
NMDS of community dynamics for the two cohorts of Charles River C57BL/6 mice purchased at different times (filled circles and empty circles are separate cohorts). Black symbols are control animals and red symbols are antibiotic-treated animals. Cohort had a significant effect on composition (p<0.05, R2 = 0.17 PERMANOVA) as did treatment (p<0.05, R2 = 0.07), but there was no significant interaction (p=0.3).
Figure 5.
Figure 5.. Experimental setup.
(A) Experimental sampling regime. (B) Cohousing treatment setup.

References

    1. Albenberg L, Esipova TV, Judge CP, Bittinger K, Chen J, Laughlin A, Grunberg S, Baldassano RN, Lewis JD, Li H, Thom SR, Bushman FD, Vinogradov SA, Wu GD. Correlation between intraluminal oxygen gradient and radial partitioning of intestinal Microbiota. Gastroenterology. 2014;147:1055–1063. doi: 10.1053/j.gastro.2014.07.020. - DOI - PMC - PubMed
    1. Allison SD, Martiny JB. Colloquium paper: resistance, resilience, and redundancy in microbial communities. PNAS. 2008;105 Suppl 1:11512–11519. doi: 10.1073/pnas.0801925105. - DOI - PMC - PubMed
    1. Antonopoulos DA, Huse SM, Morrison HG, Schmidt TM, Sogin ML, Young VB. Reproducible community dynamics of the gastrointestinal Microbiota following antibiotic perturbation. Infection and Immunity. 2009;77:2367–2375. doi: 10.1128/IAI.01520-08. - DOI - PMC - PubMed
    1. Armstrong GL, Conn LA, Pinner RW. Trends in infectious disease mortality in the United States during the 20th century. Jama. 1999;281:61–66. doi: 10.1001/jama.281.1.61. - DOI - PubMed
    1. Arumugam M, Raes J, Pelletier E, Le Paslier D, Yamada T, Mende DR, Fernandes GR, Tap J, Bruls T, Batto JM, Bertalan M, Borruel N, Casellas F, Fernandez L, Gautier L, Hansen T, Hattori M, Hayashi T, Kleerebezem M, Kurokawa K, Leclerc M, Levenez F, Manichanh C, Nielsen HB, Nielsen T, Pons N, Poulain J, Qin J, Sicheritz-Ponten T, Tims S, Torrents D, Ugarte E, Zoetendal EG, Wang J, Guarner F, Pedersen O, de Vos WM, Brunak S, Doré J, Antolín M, Artiguenave F, Blottiere HM, Almeida M, Brechot C, Cara C, Chervaux C, Cultrone A, Delorme C, Denariaz G, Dervyn R, Foerstner KU, Friss C, van de Guchte M, Guedon E, Haimet F, Huber W, van Hylckama-Vlieg J, Jamet A, Juste C, Kaci G, Knol J, Lakhdari O, Layec S, Le Roux K, Maguin E, Mérieux A, Melo Minardi R, M'rini C, Muller J, Oozeer R, Parkhill J, Renault P, Rescigno M, Sanchez N, Sunagawa S, Torrejon A, Turner K, Vandemeulebrouck G, Varela E, Winogradsky Y, Zeller G, Weissenbach J, Ehrlich SD, Bork P, MetaHIT Consortium Enterotypes of the human gut microbiome. Nature. 2011;473:174–180. doi: 10.1038/nature09944. - DOI - PMC - PubMed

Publication types

MeSH terms