. 2019 Feb 20;47(3):1294-1310.
doi: 10.1093/nar/gky519.

Perturbing cohesin dynamics drives MRE11 nuclease-dependent replication fork slowing

Affiliations

Perturbing cohesin dynamics drives MRE11 nuclease-dependent replication fork slowing

Denisse Carvajal-Maldonado et al. Nucleic Acids Res. .

Abstract

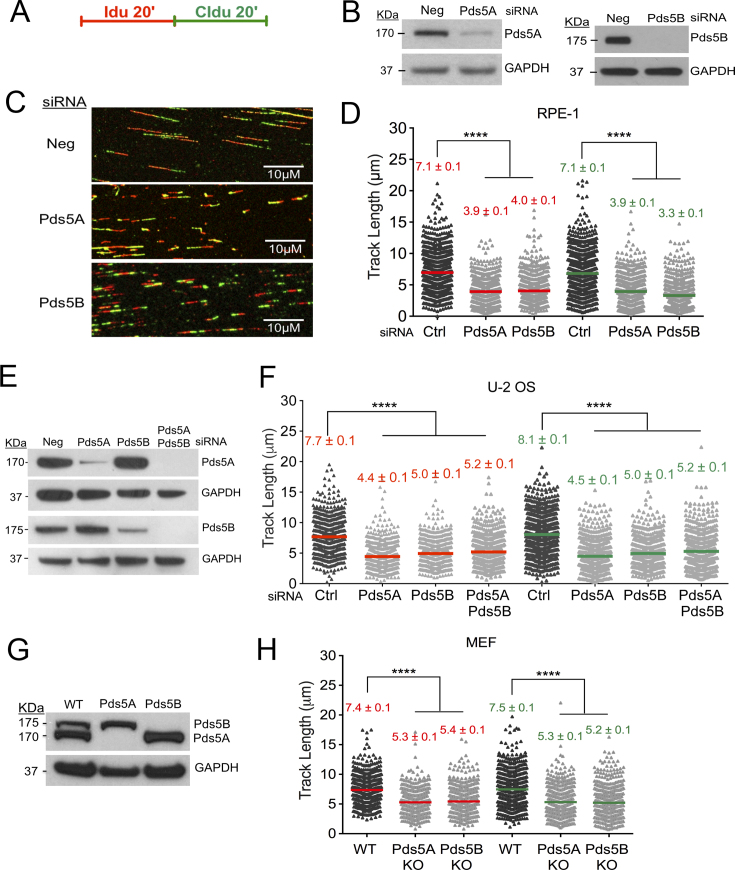
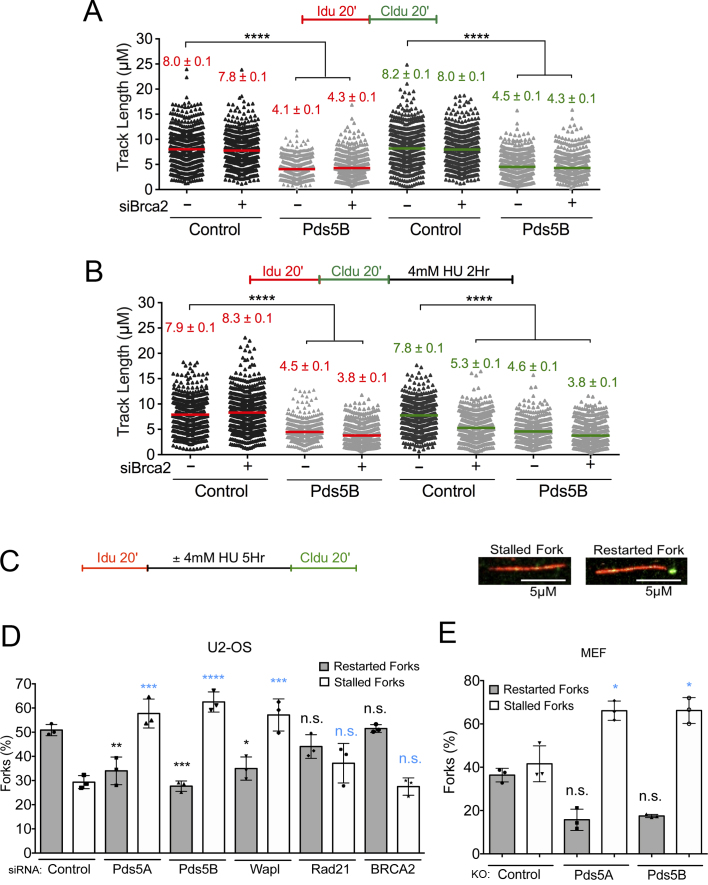
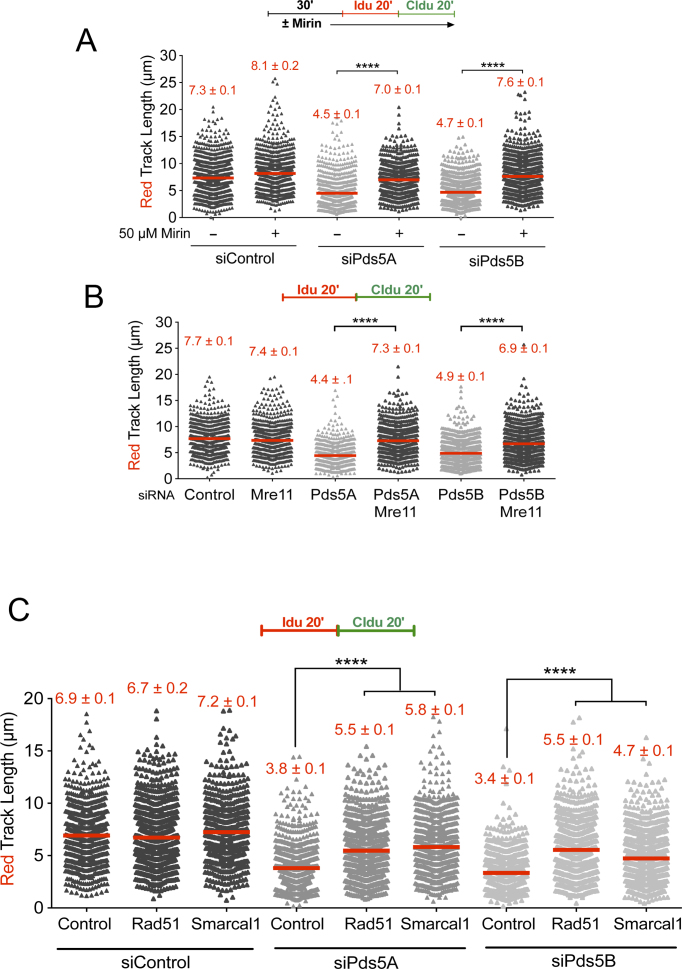
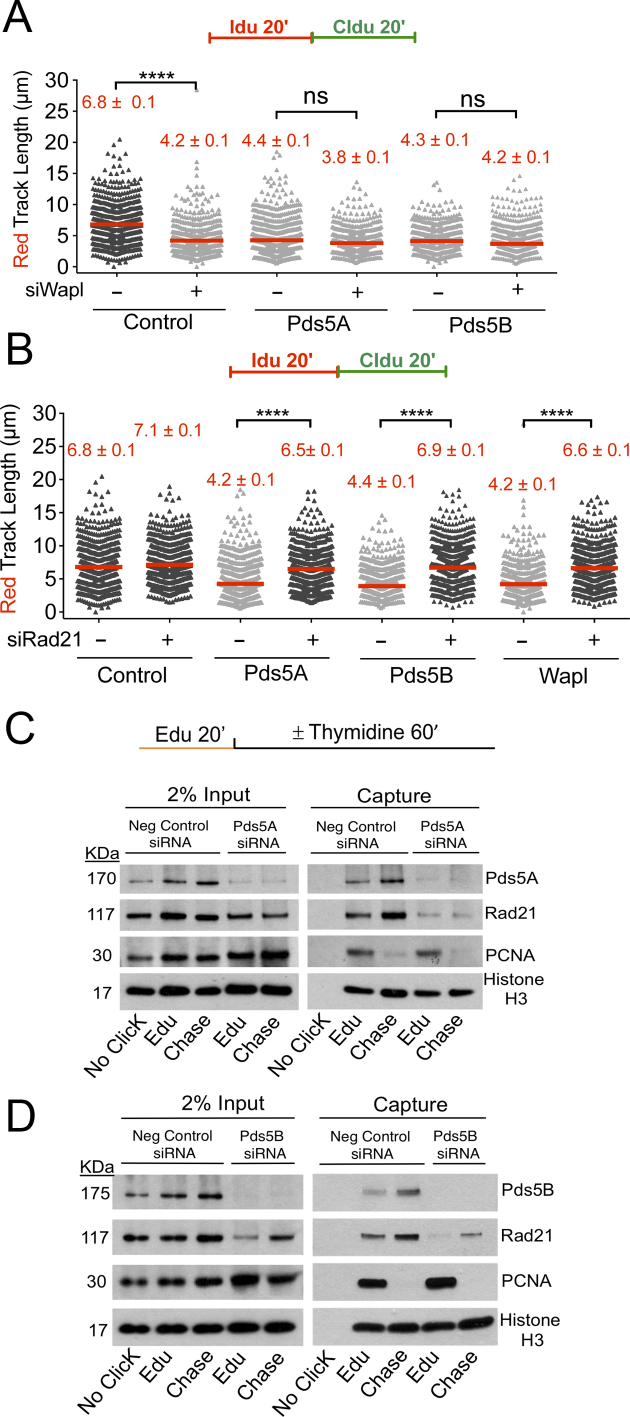
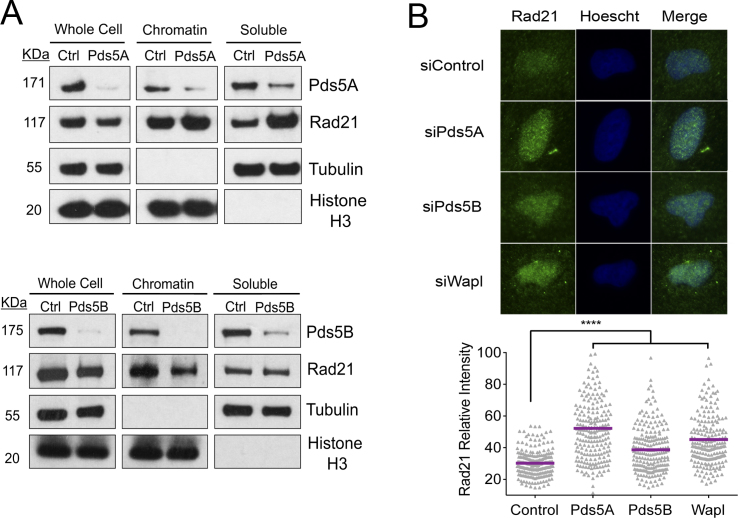
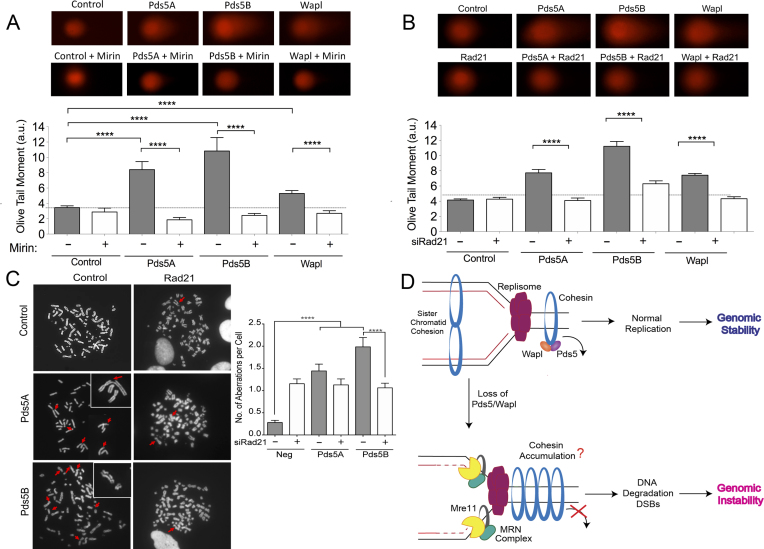
Pds5 is required for sister chromatid cohesion, and somewhat paradoxically, to remove cohesin from chromosomes. We found that Pds5 plays a critical role during DNA replication that is distinct from its previously known functions. Loss of Pds5 hinders replication fork progression in unperturbed human and mouse cells. Inhibition of MRE11 nuclease activity restores fork progression, suggesting that Pds5 protects forks from MRE11-activity. Loss of Pds5 also leads to double-strand breaks, which are again reduced by MRE11 inhibition. The replication function of Pds5 is independent of its previously reported interaction with BRCA2. Unlike Pds5, BRCA2 protects forks from nucleolytic degradation only in the presence of genotoxic stress. Moreover, our iPOND analysis shows that the loading of Pds5 and other cohesion factors on replication forks is not affected by the BRCA2 status. Pds5 role in DNA replication is shared by the other cohesin-removal factor Wapl, but not by the cohesin complex component Rad21. Interestingly, depletion of Rad21 in a Pds5-deficient background rescues the phenotype observed upon Pds5 depletion alone. These findings support a model where loss of either component of the cohesin releasin complex perturbs cohesin dynamics on replication forks, hindering fork progression and promoting MRE11-dependent fork slowing.


Figures

Figure 1.
Figure 1.
Pds5 controls replication fork progression. (A) Single-molecule DNA fiber-labeling scheme. (B) Expression of Pds5A and Pds5B after siRNA knockdown in RPE-1 cells. (C) Representative DNA fiber images of RPE-1 cells transfected with control siRNA (Ctrl), Pds5A, or Pds5B siRNA. Scale bar 10 μm. (D) Size distribution of IdU and CIdU tract length in Pds5A and Pds5B depleted RPE-1 cells. Cells were transfected with control siRNA (Ctrl), Pds5A, or Pds5B siRNA before IdU and CldU labeling, as indicated. Bars represent the mean. Out of two repeats; n ≥ 300 tracts scored for each data set. Statistics: Mann–Whitney; ****P < 0.0001. (E) Expression of Pds5A and Pds5B after siRNA knockdown in U-2 OS cells. (F) Size distribution of IdU and CIdU tract length in Pds5A and Pds5B depleted U-2 OS cells. Cells were transfected with control siRNA (Ctrl), Pds5A, Pds5B and Pds5A/Pds5B siRNA before IdU and CldU labeling, as indicated. Bars represent the mean. Out of two repeats; n ≥ 300 tracts scored for each data set. Statistics: Mann–Whitney; ****P < 0.0001. (G) Expression of Pds5A and Pds5B in the Pds5B and Pds5A knockout MEFs. (H) Size distribution of IdU and CIdU tract length in WT, Pds5B and Pds5A knockout MEF cells. Bars represent the mean. Out of two repeats; n ≥ 300 tracts scored for each data set. Statistics: Mann–Whitney; ****P < 0.0001.
Figure 2.
Figure 2.
The role of Pds5 in replication fork progression is uncoupled from BRCA2 and compromises fork restart upon prolonged HU treatment. (A, B) Size distribution of IdU and CldU tract length in Pds5B, BRCA2 and Pds5B/BRCA2 siRNA depleted U-2 OS Cells. Untreated cells (A) and HU treated cells (B). Bars represent the mean. Out of two repeats; n ≥ 300 tracts scored for each data set. Statistics: Mann–Whitney; ****P < 0.0001. (C) Single-molecule DNA fiber labeling scheme used for the fork restart experiments and representative images of stalled and restarting forks. Scale bar 5 μm. (D) Quantification of stalled/terminated forks and restarting forks after HU treatment in control, Pds5A, Pds5B, Wapl and Rad21, BRCA2 siRNA depleted U-2 OS cells. Out of three repeats, the percentage is established on at least 1000 tracts scored for each data set. Data are represented as mean ± SD. Statistics: two-way ANOVA. P values, restarted forks: siControl versus siPds5A **P = 0.0088; siControl versus siPds5B ***P = 0.0010; siControl versus siWapl *P = 0.0127; siControl versus siRad21 ns, P = 0.3881; siControl versus siBRCA2 ns, P = 0.9998. Stalled forks: siControl versus siPds5A ***P = 0.0002; siControl versus siPds5B ****P < 0.0001; siControl versus siWapl ***P = 0.0002; siControl versus siRad21 ns, P = 0.2757; siControl versus siBRCA2 ns, P = 0.9878. ns, not significant. (E) Quantification of stalled/terminated forks and restarting forks in WT, Pds5A, and Pds5B knockout MEF cells. Out of three repeats, the percentage is established on at least 1000 tracts scored for each data set. Data are represented as mean ± SD. Statistics: two-way ANOVA. P values, restarted forks: siControl versus siPds5A *P = 0.0474; siControl versus siPds5B ns, P = 0.0617. Stalled forks: siControl versus siPds5A *P = 0.0273; siControl versus siPds5B *P = 0.0269. ns, not significant.
Figure 3.
Figure 3.
MRE11 degrades reversed replication forks in the absence of Pds5. (A) Single-molecule DNA fiber labeling scheme (top). Size distribution of IdU tract length in Pds5A and Pds5B siRNA depleted U-2 OS cells treated with 50 μM Mirin. Bars represent the mean. Out of two repeats; n ≥ 300 tracts scored for each data set. Statistics: Mann–Whitney; ****P < 0.0001. (B) Size distribution of IdU tract length in Pds5A, Pds5B, MRE11, Pds5A/MRE11 and Pds5B/MRE11 siRNA depleted U-2 OS cells. Bars represent the mean. Out of two repeats; n ≥ 300 tracts scored for each data set. Statistics: Mann–Whitney; ****P < 0.0001. (C) Size distribution of IdU length in Rad51 or Smarcal1 siRNA depleted U-2 OS cells in the presence and absence of Pds5A or Pds5B. Bars represent the mean. Out of three repeats; n ≥ 300 tracts scored for each data set. Statistics: Mann–Whitney; ****P < 0.0001.
Figure 4.
Figure 4.
Cohesin depletion rescues the fork progression defects associated with the loss of Pds5 or Wapl. (A) Single-molecule DNA fiber labeling scheme (top). Size distribution of IdU tract length in Pds5A, Pds5B, Wapl, Pds5A/Wapl and Pds5B/Wapl siRNA depleted U-2 OS cells (bottom). Bars represent the mean. Out of two repeats; n ≥ 300 tracts scored for each data set. Statistics: Mann–Whitney; ****P < 0.0001. (B) Size distribution of IdU tract length in Pds5A, Pds5B, Wapl, Pds5A/Rad21, Pds5B/Rad21 and Wapl/Rad21 siRNA depleted U-2 OS cells. Bars represent the median. Out of two repeats; n ≥ 300 tracts scored for each data set. Statistics: Mann–Whitney; ****P < 0.0001. (C) AniPOND of Pds5A siRNA depleted U-2 OS cells. (D) AniPOND of Pds5B siRNA depleted U-2 OS cells. No-Click control: no biotin was added. Edu: cells treated with EdU for 20 minutes and then harvested. Chase: cells treated with Edu for 20 min, washed and treated with a thymidine chase for 1 h and then harvested. Proteins present at the replication forks were recovered using streptavidin beads. Proteins enriched at the fork were detected by western blot.
Figure 5.
Figure 5.
Loss of Pds5 does not alter cohesin loading on chromatin. (A) Levels of Rad21 bound to chromatin after depletion of Pds5A (top) or Pds5B (bottom). Chromatin Fractionation of Pds5 depleted U-2 OS cells. Fractions separated included whole cell, chromatin bound and soluble cytoplasmic proteins. Samples were probed with Pds5A, Pds5B, Rad21, Tubulin and H3 antibodies. (B) Relative intensity of Rad21 bound to chromatin after immunofluorescence staining of Pds5A or Pds5B depleted cells. Cells were pre-extracted to remove soluble proteins, leaving chromatin bound proteins intact. Quantification of the Rad21 relative intensity signal. At least 100 cells were scored for each data set. n = 2. Data are represented as mean ± SEM. Statistics: Mann–Whitney; ****P < 0.0001.
Figure 6.
Figure 6.
Loss of Pds5 leads to increased DSBs and chromosomal aberrations. (A) Neutral Comet assay monitoring DSB formation in in Pds5A, Pds5B or Wapl siRNA depleted U-2 OS cells treated with 50 μM Mirin or left untreated. Representative images of comets of Pds5A, Pds5B, Rad21 or Wapl siRNA depleted cells with or without 50 μM Mirin (top). Out of three repeats; n ≥ 100 comets scored for each data set. Data are represented as mean ± SEM. Statistics: Mann–Whitney; ****P < 0.0001 (bottom). (B) Neutral Comet assay monitoring DSB formation in Pds5A, Pds5B, Wapl, Pds5A/Rad21, Pds5B/Rad21 and Wapl/Rad21 siRNA depleted U-2 OS cells. Representative images of comets of Pds5A, Pds5B, Rad21, Wapl, Pds5A/Rad21, Pds5B/Rad21 and Wapl/Rad21 siRNA depleted cells (top). Out of three repeats; n ≥ 100 comets scored for each data set. Data are represented as mean ± SEM Statistics: Mann–Whitney; ****P < 0.0001 (bottom). (C) Accumulation of DSB as measured by chromosome spread. Representative images of metaphases of Pds5A, Pds5B, Rad21, Pds5A/Rad21 and Pds5B/Rad21 siRNA depleted cells (left). Red arrows point to DSBs. Bar graph, distribution of number of chromosomal abnormalities per metaphase. At least 50 metaphases were counted from three independent experiments. Mean shown, n = 3. Statistics: unpaired t-test; ****P < 0.0001. (D) Proposed model. Cohesin is recruited to origins in early S-Phase. Pds5/Wapl unload cohesin ahead of the fork to allow fork passage. Cohesin is promptly re-assembled behind the replication fork to achieve sister chromatid cohesion. Whether the two sister chromatids are embraced by two interacting cohesin complexes, as shown in the figure, or by a single-complex is still controversial in the field (84–87). In the absence of Pds5 or Wapl, there is a reduction in cohesin loading behind the forks suggesting that there might be a consequent accumulation of cohesin rings ahead of replication forks. This aberrant re-distribution of the cohesin rings might cause MRE11-dependent degradation of the newly synthesized DNA strands, leading tract shortening, DSB accumulation and chromosomal instability. Tract shortening could also be due to an inhibitory effect of MRE11 on fork movement independent of fork degradation as discussed in the main text.

Similar articles

Cited by

References

    1. Berti M., Vindigni A.. Replication stress: getting back on track. Nat. Struct. Mol. Biol. 2016; 23:103–109. - PMC - PubMed
    1. Zeman M.K., Cimprich K.A.. Causes and consequences of replication stress. Nat. Cell Biol. 2014; 16:2–9. - PMC - PubMed
    1. Gligoris T., Lowe J.. Structural insights into ring formation of cohesin and related Smc complexes. Trends Cell Biol. 2016; 26:680–693. - PMC - PubMed
    1. Gruber S., Haering C.H., Nasmyth K.. Chromosomal cohesin forms a ring. Cell. 2003; 112:765–777. - PubMed
    1. Peters J.M., Tedeschi A., Schmitz J.. The cohesin complex and its roles in chromosome biology. Genes Dev. 2008; 22:3089–3114. - PubMed

Publication types