. 2018 Sep;596(17):4219-4235.
doi: 10.1113/JP276079. Epub 2018 Jul 30.

Classification of GABAergic neuron subtypes from the globus pallidus using wild-type and transgenic mice

Affiliations

Classification of GABAergic neuron subtypes from the globus pallidus using wild-type and transgenic mice

Karina P Abrahao et al. J Physiol. 2018 Sep.

Abstract

Key points: Classifying different subtypes of neurons in deep brain structures is a challenge and is crucial to better understand brain function. Understanding the diversity of neurons in the globus pallidus (GP), a brain region positioned to influence afferent and efferent information processing within basal ganglia, could help to explain a variety of brain functions. We present a classification of neurons from the GP using electrophysiological data from wild-type mice and confirmation using transgenic mice. This work will help researchers to identify specific neuronal subsets in the GP of wild-type mice when transgenic mice with labelled neurons are lacking.

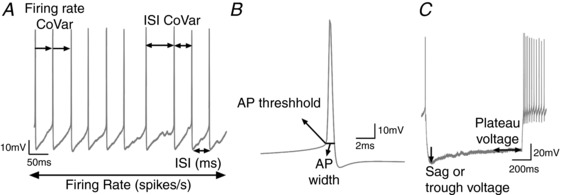
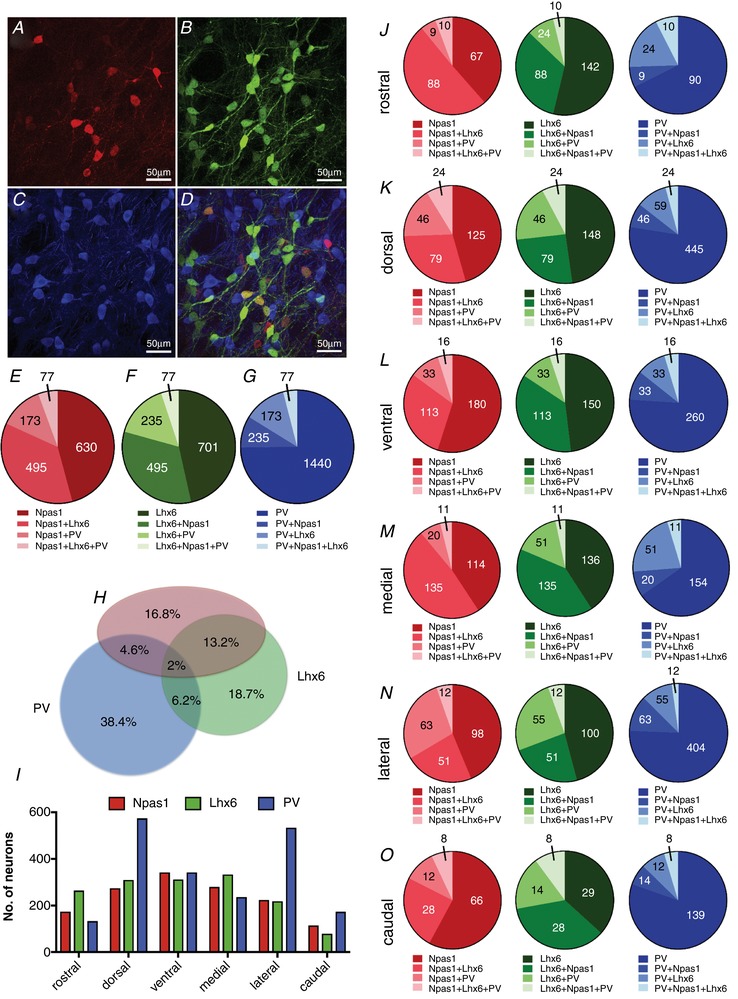
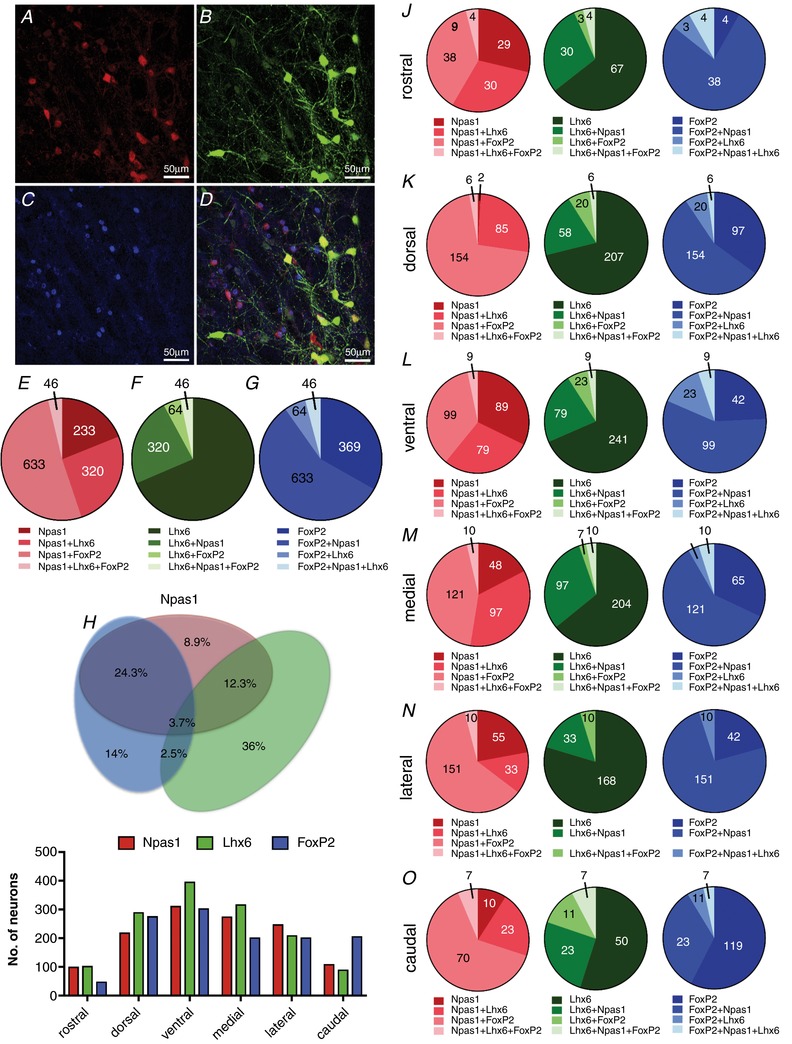
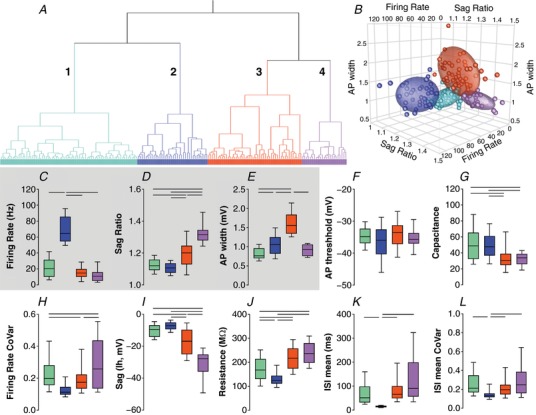
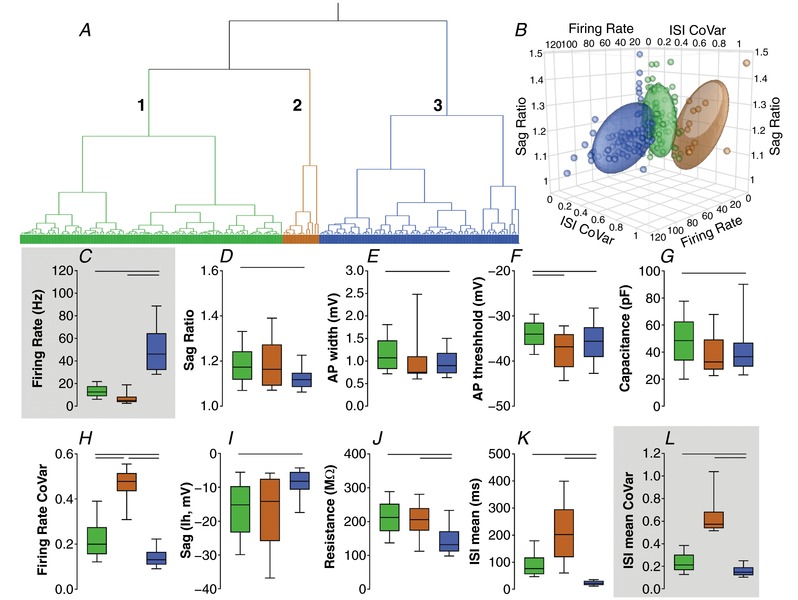
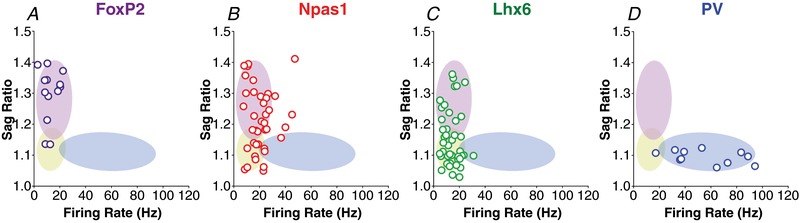
Abstract: Classification of the extensive neuronal diversity in the brain is fundamental for neuroscience. The globus pallidus external segment (GPe), also referred to as the globus pallidus in rodents, is a large nucleus located in the core of the basal ganglia whose circuitry is implicated in action control, decision-making and reward. Although considerable progress has been made in characterizing different GPe neuronal subtypes, no work has directly attempted to characterize these neurons in non-transgenic mice. Here, we provide data showing the degree of overlap in expression of neuronal PAS domain protein (Npas1), LIM homeobox 6 (Lhx6), parvalbumin (PV) and transcription factor FoxP2 biomarkers in mouse GPe neurons. We used an unbiased statistical method to classify neurons based on electrophysiological properties from nearly 200 neurons from C57BL/6J mice. In addition, we examined the subregion distribution of the neuronal subtypes. Cluster analysis using firing rate and hyperpolarization-induced membrane potential sag variables revealed three distinct neuronal clusters: type 1, characterized by low firing rate and small sag potential; type 2, with low firing rate and larger sag potential; and type 3, with high firing rate and small sag potential. We used other electrophysiological variables and data from marker-expressing neurons to evaluate the clusters. We propose that the GPe GABAergic neurons should be classified into three subgroups: arkypallidal, low-firing prototypical and high-firing prototypical neurons. This work will help researchers identify GPe neuron subtypes when transgenic mice with labelled neurons cannot be used.

Keywords: cluster analysis; electrophysiology signature; molecular signature.


Figures

Figure 1
Figure 1. Definitions and calculation descriptions of the electrophysiological variables
A, firing rate, firing rate coefficient of variation (CoVar), interspike interval (ISI) and ISI CoVar were calculated using positive threshold event detection in ClampFit 10.3. B, after averaging action potentials (AP) for 1 min during the fifth minute of recording, a single vector was exported to Excel and the first derivative was calculated. The AP threshold voltage was measured at 10 mV ms−1 change in the initial rising phase of the action potential. Another linear regression was calculated to determine the AP threshold on the descending phase of the AP to allow measurement of the AP width. C, input resistance was calculated in Clampfit from voltage responses to −200 pA hyperpolarizing current steps, by measuring the plateau voltage at 800–900 ms after the step onset relative to the baseline current injection. The hyperpolarization‐induced sag (Sag) (or trough voltage) was calculated in Clampfit from voltage responses to −200 pA hyperpolarizing current steps, by calculating the peak negative amplitude between 0 and 400 ms after step onset. sag ratio = trough voltage/plateau voltage. Capacitance was calculated by Clampex and shows the change in charge/change in potential.
Figure 2
Figure 2. Molecular signature and overlap among Npas1, Lhx6 and PV biomarkers in neurons of the GPe
A, representative image of Tdtm (Npas1) immunofluorescence. B, representative image of EGFP (Lhx6) immunofluorescence. C, representative image of PV immunofluorescence. These images have the background fluorescence subtracted. D, merged image showing the overlap among neurons with different biomarkers. E, number of Npas1 neurons expressing different molecular markers (percentages are given in the text). F, number of Lhx6 neurons expressing different molecular markers (percentages are given in the text). G, number of PV neurons expressing different molecular markers (percentages are given in the text). H, proportional Euler diagram showing the percentages of different expression profiles of all GPe GABAergic neurons expressing Npas1, Lhx6 and PV biomarkers. I, distribution of Npas1‐, Lhx6‐ and PV‐positive neurons in subregions of the GPe. Number of images measured by subregion: rostral, 9; dorsal, 22; ventral, 21; medial, 18; lateral, 18; caudal, 8. J–O, GPe subregional distribution of Npas1, Lhx6 and PV neurons
Figure 3
Figure 3. Molecular signature and overlap among Npas1, Lhx6 and FoxP2 biomarkers in neurons of the GPe
A, representative image of Tdtm (Npas1) immunofluorescence. B, representative image of EGFP (Lhx6) immunofluorescence. C, representative image of FoxP2 immunofluorescence. These images have the background fluorescence subtracted. D, merged image showing the overlap among the biomarkers. E, number of Npas1 neurons expressing different molecular markers (percentages are given in the text). F, number of Lhx6 neurons expressing different molecular markers (percentages are given in the text). G, number of FoxP2 neurons expressing different molecular markers (percentages are given in the text). H, proportional Euler diagram for the percentages of different expression profiles of all GPe GABAergic neurons expressing Npas1, Lhx6 and FoxP2 biomarkers. I, distributions of Npas1‐, Lhx6‐ and FoxP2‐positive neurons in subregions of the GPe. Number of images measured by subregion: rostral, 3; dorsal, 16; ventral, 15; medial, 14; lateral, 14; caudal, 8. J–O, GPe subregional distribution of Npas1, Lhx6 and FoxP2 neurons
Figure 4
Figure 4. Representative electrophysiological traces of identified GPe neurons
Each column represents one type of GPe neuron coded by different colours. AD, example traces of the firing during 1 s. EH, average traces and standard deviation of the action potential shape in the 5th minute of recording after forming the whole‐cell configuration. Phase plot analyses of action potentials are inserted (arrow represents the beginning of the action potential). IL, example voltage traces for –200, –150 and –100pA current injections for 1 s.
Figure 5
Figure 5. Molecularly identified GPe neurons differ in their electrophysiological signatures
Box plots show the median and interquartile ranges, and the whiskers show 10th to 90th percentiles. A, autonomous firing rate. PV neurons were significantly different from all other cell classes (P < 0.01). Npas1 neurons presented higher firing rate than FoxP2 and Lhx6 neurons (P < 0.05). B, firing rate coefficient of variation (CoVar) was not strongly different among the subtypes of neurons; only Npas1 neurons showed lower firing rate CoVar than FoxP2 neurons (P < 0.05). C, sag or I h shows significant variability among the recorded neurons. Lhx6 neurons show smaller sag than FoxP2 neurons (P < 0.05) and PV neurons have the smallest sag among all the other identified neurons (P < 0.05). D, membrane resistance was smaller in PV neurons (P < 0.05). E, sag ratio was smaller in PV neurons when compared to FoxP2 and Npas1 (P < 0.05), but not to Lhx6. In addition, Lhx6 neurons have smaller sag ratio than FoxP2 neurons (P < 0.05). F, interspike interval (ISI) differences followed the firing rate differences, as expected. G, ISI CoVar was lower in Npas1 when compared to FoxP2 (P < 0.05), but no other significant difference was observed. H, action potential (AP) threshold was significantly higher in Npas1 and Lhx6 neurons when compared to FoxP2 neurons only (P < 0.05). I, AP width was not different among FoxP2, Npas1 and Lhx6, but was lower in PV neurons (P < 0.05). J, capacitance was higher in PV neurons when compared to all other subtypes (P < 0.05). Lhx6 neurons also had higher capacitance than FoxP2 and Npas1 neurons (P < 0.05). Comparisons were made by Kruskal–Wallis ANOVA test followed by Dunn's multiple comparison test. Horizontal bars represent statistically significant differences between 2 clusters (P < 0.05).
Figure 6
Figure 6. Cluster analysis based on firing rate, sag ratio and AP width
Colours outline 4 clusters: cluster 1 in light green, cluster 2 in blue, cluster 3 in red and cluster 4 in purple. A, Ward's method of hierarchical unsupervised clustering applied to 177 neurons recorded in the GPe of C57BL/6J mice. The x‐axis of the dendogram shows individual neurons and the y‐axis represents the linkage distance between the clusters. B, 3D scatter plot graph showing the distribution of the firing rate, sag ratio and AP width of individual neurons and the 60% elliptical shadow coverage of each cluster identified by the analysis. CE, box plots showing the median and interquartile range with whiskers showing 10th–90th percentiles of the variables used for the cluster analysis. FL, variables not included in the cluster analyses used to allow internal evaluation of the quality of this cluster. Horizontal bars represent statistically significant differences between 2 clusters (Kruskal–Wallis test followed by Dunn's multiple comparisons test).
Figure 7
Figure 7. Cluster analysis based on firing rate and ISI mean CoVar
Colours outline 3 clusters: cluster 1 in light green, cluster 2 in brown and cluster 3 in blue. A, Ward's method of hierarchical unsupervised clustering applied to 177 neurons recorded in the GPe of C57BL/6J mice. The x‐axis of the dendogram shows individual neurons and the y‐axis represents the linkage distance between the clusters. B, 3D scatter plot graph showing the distribution of the firing rate, ISI mean CoVar and sag ratio of individual neurons and the 60% elliptical shadow coverage of each cluster identified by the analysis. CE, box plots showing the median and interquartile range with whiskers showing 10th–90th percentiles of the variables used for the cluster analysis. FL, variables not included in the cluster analyses used to allow internal evaluation of the quality of this cluster. Horizontal bars represent statistically significant differences between 2 clusters (Kruskal–Wallis test followed by Dunn's multiple comparisons test).
Figure 8
Figure 8. Cluster analysis based on firing rate and sag ratio
Colours outline 3 clusters: cluster 1 in yellow, cluster 2 in purple, cluster 3 in blue. A, Ward's method of hierarchical unsupervised clustering applied to 177 neurons recorded in the GPe of C57BL/6J mice. The x‐axis of the dendrogram shows individual neurons and the y‐axis represents the linkage distance between the clusters. B, 3D scatter plot graph showing the distribution of the firing rate, sag ratio and AP width of individual neurons and the 60% elliptical shadow coverage of each cluster identified by the analysis. CD, box plots showing the median and interquartile ranges with whiskers showing 10th–90th percentiles of the variables used for the cluster analysis. EL, variables not included in the cluster analyses used to allow testing of the quality of this cluster. Horizontal bars represent statistically significant differences between 2 clusters (Kruskal–Wallis test followed by Dunn's multiple comparisons test).
Figure 9
Figure 9. 2D scatter plot graph showing the distribution of the firing rate and sag ratio of labelled neurons, FoxP2, Npas1, Lhx6 and PV (in each column); and the 75% elliptical shadow coverage of each cluster identified by the analysis shown in Figure 6
Colours outline 3 clusters: cluster 1 in yellow, cluster 2 in purple, cluster 3 in blue. Firing rate and sag ratio explain the variability among different labelled neurons of the GPe, but AP width does not add further information.

References

    1. Abdi A, Mallet N, Mohamed FY, Sharott A, Dodson PD, Nakamura KC, Suri S, Avery SV, Larvin JT, Garas FN, Garas SN, Vinciati F, Morin S, Bezard E, Baufreton J & Magill PJ (2015). Prototypic and arkypallidal neurons in the dopamine‐intact external globus pallidus. J Neurosci 35, 6667–6688. - PMC - PubMed
    1. Abrahao KP, Chancey JH, Chan CS & Lovinger DM (2017). Ethanol‐sensitive pacemaker neurons in the mouse external globus pallidus. Neuropsychopharmacology 42, 1070–1081. - PMC - PubMed
    1. Albin RL, Young AB & Penney JB (1989). The functional anatomy of basal ganglia disorders. Trends Neurosci 12, 366–375. - PubMed
    1. Armananzas R & Ascoli GA (2015). Towards the automatic classification of neurons. Trends Neurosci 38, 307–318. - PMC - PubMed
    1. Carpenter AE, Jones TR, Lamprecht MR, Clarke C, Kang IH, Friman O, Guertin DA, Chang JH, Lindquist RA, Moffat J, Golland P & Sabatini DM (2006). CellProfiler: image analysis software for identifying and quantifying cell phenotypes. Genome Biol 7, R100. - PMC - PubMed

Publication types

LinkOut - more resources