. 2018 Aug 31;128(9):3853-3865.
doi: 10.1172/JCI121309. Epub 2018 Aug 6.

Th1/Th17 polarization persists following whole-cell pertussis vaccination despite repeated acellular boosters

Affiliations

Th1/Th17 polarization persists following whole-cell pertussis vaccination despite repeated acellular boosters

Ricardo da Silva Antunes et al. J Clin Invest. .

Abstract

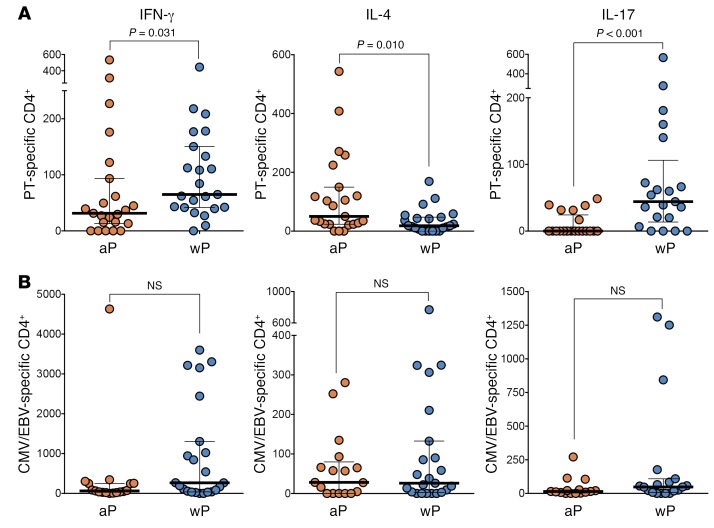
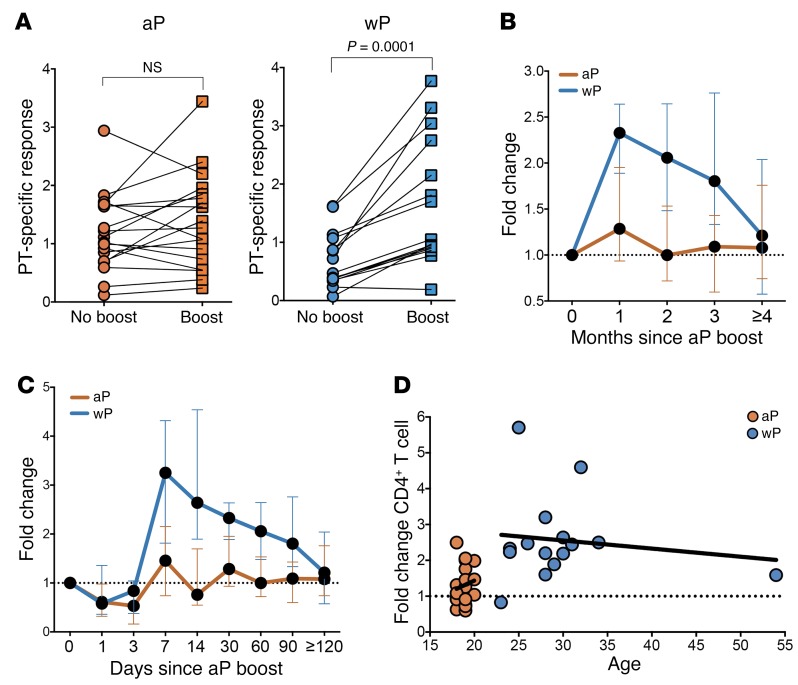
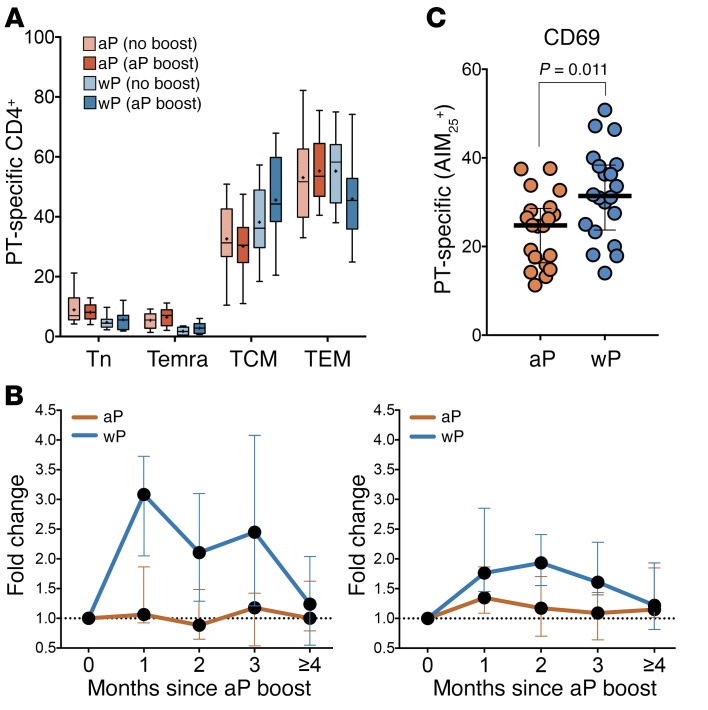
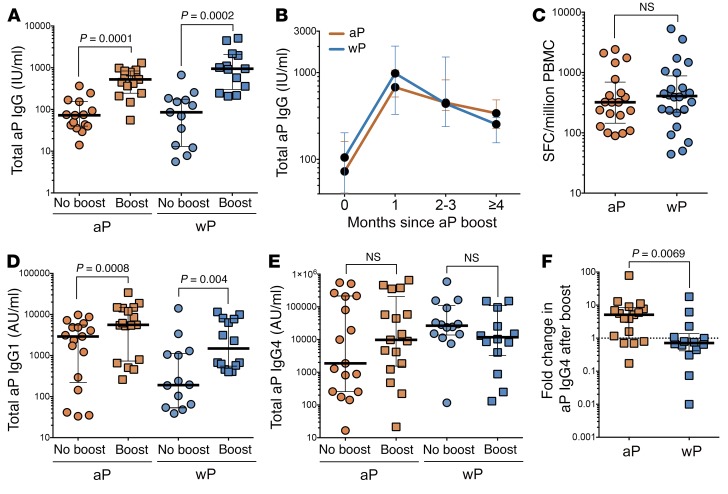
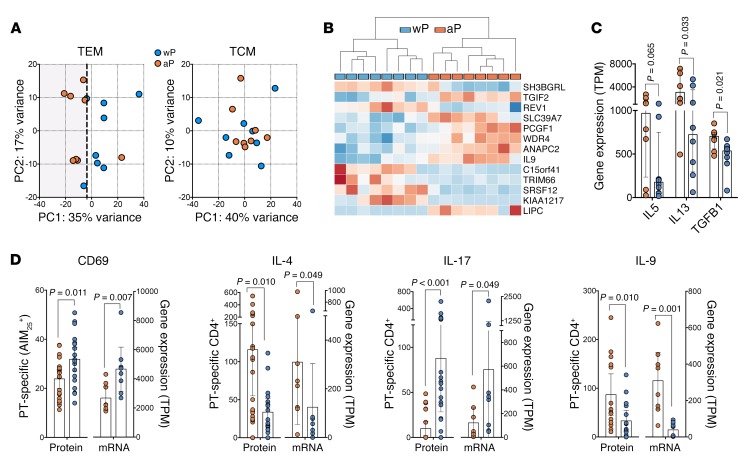
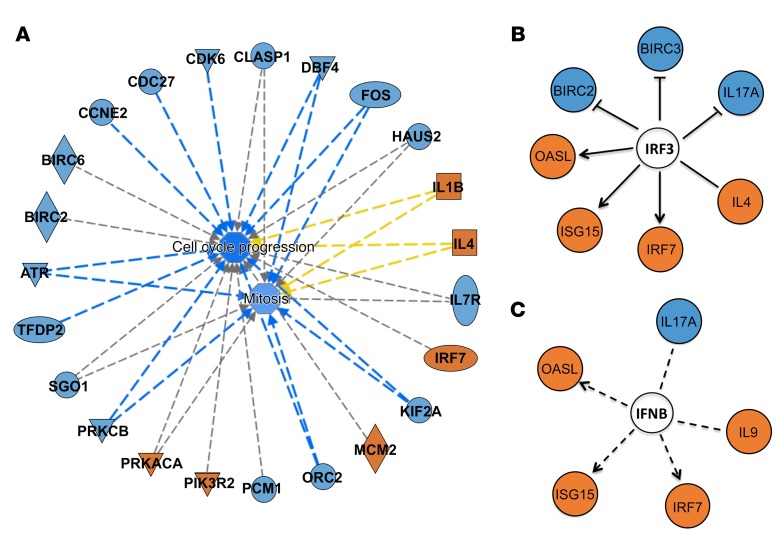
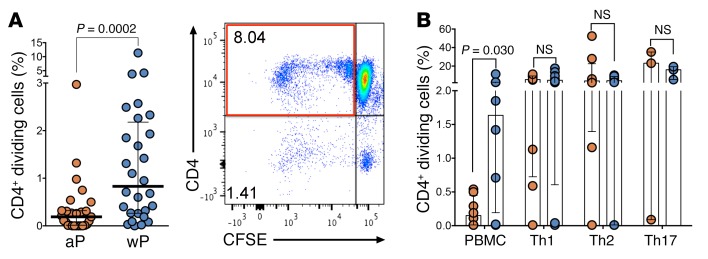
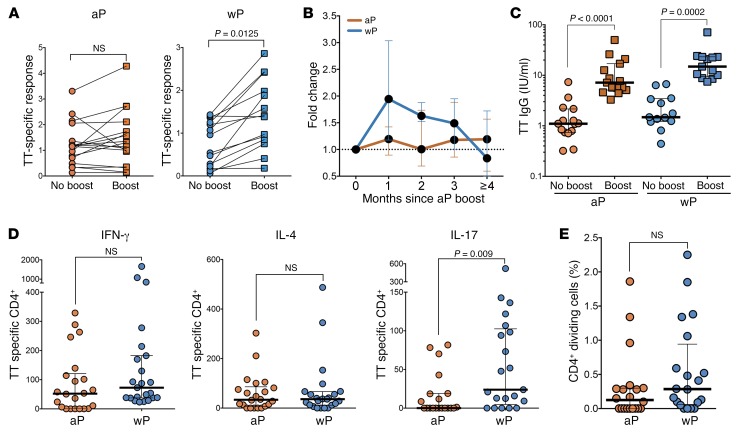
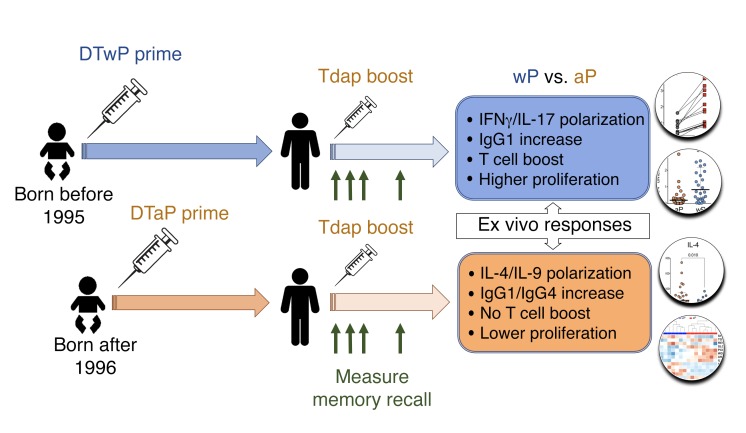
In the mid-1990s, whole-cell pertussis (wP) vaccines were associated with local and systemic adverse events that prompted their replacement with acellular pertussis (aP) vaccines in many high-income countries. In the past decade, rates of pertussis disease have increased in children receiving only aP vaccines. We compared the immune responses to aP boosters in individuals who received their initial doses with either wP or aP vaccines using activation-induced marker (AIM) assays. Specifically, we examined pertussis-specific memory CD4+ T cell responses ex vivo, highlighting a type 2/Th2 versus type 1/Th1 and Th17 differential polarization as a function of childhood vaccination. Remarkably, after a contemporary aP booster, cells from donors originally primed with aP were (a) associated with increased IL-4, IL-5, IL-13, IL-9, and TGF-β and decreased IFN-γ and IL-17 production, (b) defective in their ex vivo capacity to expand memory cells, and (c) less capable of proliferating in vitro. These differences appeared to be T cell specific, since equivalent increases of antibody titers and plasmablasts after aP boost were seen in both groups. In conclusion, our data suggest that there are long-lasting effects and differences in polarization and proliferation of T cell responses in adults originally vaccinated with aP compared with those that initially received wP, despite repeated acellular boosters.

Keywords: Adaptive immunity; Cellular immune response; Immunology; Th1 response; Vaccines.


Conflict of interest statement

Conflict of interest: The authors have declared that no conflict of interest exists.

Figures

Figure 1
Figure 1. Differential polarization of PT-specific CD4+ T cells as a function of childhood vaccination.
IFN-γ–, IL-4–, and IL-17–secreting cells were measured by ICS staining in PT- (A) or CMV/EBV-specific (B) CD4+ T cells by AIM25 assay. Responses represent the cohorts of donors originally DTaP or DTwP vaccinated, 1 to 3 months after Tdap-boosting vaccination. Each dot represents the number of total CD4+ T cells that were ascribed to each cytokine. For all panels, data are expressed as median ± the interquartile range for each cohort and each data point represent a single donor (n = 23 for each cohort). P value is shown as statistically significant by 2-tailed Mann-Whitney U test.
Figure 2
Figure 2. Original wP prime, but not aP prime, is associated with significantly higher CD4+ T cells after aP boost.
(A) Percentage of PT-specific CD4+ memory T cells by AIM25 assay for donors originally primed with wP or aP vaccine before or after the earliest boost time for each individual (0.5- to 2-month range). Each dot represents a single donor determination followed longitudinally (n = 18 for aP and n = 15 for wP cohorts). Wilcoxon’s paired t test. (B and C) Longitudinal kinetics of PT-specific CD4+ T cell responses after boost represented as fold increase of the percentage of AIM25+ cells to nonboost responses for aP- or wP-primed cohorts. Data are expressed as median ± the interquartile range for each cohort. B, n = 18 for aP and n = 17 for wP; C, n = 12 for aP and n = 12 for wP. (D) PT-specific CD4+ T cell responses after boost represented as function of age for aP or wP cohorts. Each data point represents the fold increase to nonboost response from each donor (n = 18 for aP and n = 15 for wP cohorts). The best fit of each data set is represented by linear regression lines (black).
Figure 3
Figure 3. Memory subset composition of PT-specific responses.
(A) Percentage of PT-specific CD4+ T cell subsets followed longitudinally (naive T cells [Tn]: CD45RA+CCR7+; effector memory RA T cells [Temra]: CD45RA+CCR7; TCM: CD45RACCR7+; and TEM: CD45RACCR7) gated in AIM25+ cells. Asterisks indicate median. Minimum and maximum error bars are shown (aP boost: 0.5- to 2-month range; n = 16 for aP and n = 14 for wP cohorts). (B) Longitudinal kinetics of PT-specific CD4+ responses from TCM (left panel) or TEM (right panel) subsets after aP boost. Data are expressed as median ± the interquartile range for each cohort (n = 18 for aP and n = 17 for wP in both panels). (C) Expression of CD69 in aP versus wP cohorts as the percentage of AIM25+ cells after aP boost (1- to 3-month range). Differences between cohorts analyzed via 2-tailed Mann-Whitney U test. Each data point represents a single donor determination. n = 20 for each cohort.
Figure 4
Figure 4. wP- and aP-primed donors elicit elevated pertussis-specific IgG and IgG1, but not IgG4, titers after aP boost.
(A) Sum of IgG antibody titers for aP antigens (FHA, PT, and PRN) in respective cohorts. Response before and after vaccine analyzed via Wilcoxon’s paired t test. (B) Kinetic representation of antibody titers. (C) Analysis of plasmablast memory B cell responses at day 7 after Tdap boost. Data represent overall Ab secretion against aP antigens as measured by ELISPOT. (D) Sum of pertussis (FHA, PT, PRN, and FIM2/3) IgG1 and (E) IgG4 levels as representative responses to aP for each cohort. Response before and after vaccine analyzed via Wilcoxon’s paired t test. (F) Fold change in aP IgG4 levels after aP boost for each cohort. Data represent average fold change of all aP antigens (PT, FHA, PRN, and FIM2/3) for each individual. Comparison between aP and wP fold change analyzed via Mann-Whitney unpaired t test. For all panels, data are expressed as median ± the interquartile range for each cohort and each data point represents a single donor. n = 19 for aP and n = 14 for wP cohorts except for C, in which n = 20 for aP and n = 24 for wP.
Figure 5
Figure 5. Comparison of gene expression profiles of PT-stimulated T cells for aP- and wP-vaccinated donors after boost.
PT-specific CD4+ T cells were isolated by AIM25 assay and sorted as a function of memory TEM and TCM subsets. RNA-seq was performed. (A) Unbiased PCA of TEM and TCM subsets from aP and wP donors based on the top 1,000 variable genes. Each data point represents a single donor. n = 8 for each cohort. (B) TEM cells from aP and wP donors (n = 8) were clustered based on the 13 differentially expressed genes (adjusted P < 0.05) (C and D) Expression of indicated cytokines and CD69 at the mRNA (n = 8 for each cohort)or protein level. Protein data are represented as percentage of CD69 in AIM25+ cells (n = 20 for each cohort) or the number of IL-4– and IL-17– (n = 23 for each cohort) or IL-9–secreting (n = 15 for each cohort) cells measured in ICS staining by pertussis-specific AIM25 assay. mRNA data are represented as the number of transcripts per million (TPM) after RNA-seq normalization for the respective gene. Results are presented as median ± interquartile range. All determinations were performed in recently boosted donors (1- to 3-month range) Each dot represents 1 donor from aP (orange) versus wP (blue). Differences analyzed via 2-tailed Mann-Whitney U test.
Figure 6
Figure 6. Modular transcriptomic and pathway analysis reveals alterations linked to differential priming.
(A) Network analysis for gene functions involved in mitosis and cell cycle progression. These functions were significantly enriched for the 500 genes with the highest value of fold change between aP and wP donors. Lines indicate relationships between genes and functions. Blue lines indicate activation effects, and gray lines indicate genes known to be involved in function, but with unknown effect. Orange and blue nodes indicate upregulated in aP and wP, respectively. Yellow lines indicate that the relationships are inconsistent with the state of the node. (B) IRF3 and (C) IFNB were identified as upstream regulators. Solid and broken lines denote a direct or indirect effect, respectively. Line with an arrowhead indicates activation, while a flat end indicates inhibitory effect.
Figure 7
Figure 7. Original wP priming is associated with higher proliferative capacity.
The proliferative capacity of PT-specific cells was assessed by CFSE assay after 6 days of stimulation. (A) Percentage of dividing CD4+ T cells by CFSE quenching in both cohorts. Results are presented as median ± interquartile range for each cohort, and each data point represents a single recently boosted donor (1- to 3-month range; n = 27 for aP and n = 28 for wP cohorts). Dot plot shows double labeling of CD4 versus CFSE for a representative wP-primed donor. (B) Percentage of dividing CD4+ T cells in purified T cell subsets from aP (red) versus wP (blue). Differences between cohorts analyzed via 2-tailed Mann-Whitney U test. Donor samples obtained from leukapheresis after Tdap boost (1- to 12-month range). n = 8 donors.
Figure 8
Figure 8. Some, but not all, alterations extend to TT-specific responses.
(A) Percentage of TT-specific CD4+ T cell subsets gated in AIM25+ cells before or following boost. Each dot represents 1 donor followed longitudinally (n = 17 for aP and n = 14 for wP cohorts). Wilcoxon’s paired t test. (B) Longitudinal kinetics of PT-specific CD4+ T cell responses after boost represented as fold increase of the percentage of AIM25+ cells to nonboost responses for aP- or wP-primed cohorts. Data are expressed as median ± the interquartile range for each cohort (n = 18 for aP and n = 17 for wP cohorts). (C). Ab titers for TT toxoid antigen in respective cohorts (n = 19 for aP and n = 14 for wP cohorts). Response before and after boost vaccine analyzed via Wilcoxon’s paired t test. (D) Total TT-specific CD4+ T cell number response after AIM25 assay to each indicated cytokine. Each dot represents 1 donor (n = 23 for each cohort). P value is shown as statistically significant by 2-tailed Mann-Whitney U test. (E) Percentage of TT-specific CD4+ T cells after 6 days of CFSE assay. Results are presented as median ± interquartile range (n = 20 for each cohort).
Figure 9
Figure 9. Experimental design and major findings of the study.
Primary vaccination with 5 doses (3 doses at 2, 4, and 6 months and then 2 doses between 15 and 18 months and 4 and 6 years) of whole-cell (DTwP) or acellular vaccine (DTaP) occurred during the first years of life. A contemporary acellular vaccine (Tdap) boost was administered more than 15 years later and memory recall response measured using ex vivo analysis of T cell or B cell reactivity, proliferation assays, and transcriptomic profiling. The major immunological differences for each cohort (wP vs. aP) are depicted in the boxes (blue and orange, respectively).

Comment in

Similar articles

Cited by

References

    1. Epidemiology and Prevention of Vaccine-Preventable Diseases. CDC Website. https://www.cdc.gov/vaccines/pubs/pinkbook/pert.html Accessed June 22, 2018.
    1. Fulton TR, Phadke VK, Orenstein WA, Hinman AR, Johnson WD, Omer SB. Protective effect of contemporary pertussis vaccines: a systematic review and meta-analysis. Clin Infect Dis. 2016;62(9):1100–1110. doi: 10.1093/cid/ciw051. - DOI - PMC - PubMed
    1. Sheridan SL, Frith K, Snelling TL, Grimwood K, McIntyre PB, Lambert SB. Waning vaccine immunity in teenagers primed with whole cell and acellular pertussis vaccine: recent epidemiology. Expert Rev Vaccines. 2014;13(9):1081–1106. doi: 10.1586/14760584.2014.944167. - DOI - PubMed
    1. Zhang L, Prietsch SO, Axelsson I, Halperin SA. Acellular vaccines for preventing whooping cough in children. Cochrane Database Syst Rev. 2014;2014(9):CD001478. - PMC - PubMed
    1. Snyder J, Fisher D. Pertussis in childhood. Pediatr Rev. 2012;33(9):412–420. doi: 10.1542/pir.33-9-412. - DOI - PubMed

Publication types

MeSH terms