. 2018 Aug 31;128(9):4008-4024.
doi: 10.1172/JCI99287. Epub 2018 Aug 13.

Expression of mutant Sftpc in murine alveolar epithelia drives spontaneous lung fibrosis

Affiliations

Expression of mutant Sftpc in murine alveolar epithelia drives spontaneous lung fibrosis

Shin-Ichi Nureki et al. J Clin Invest. .

Abstract

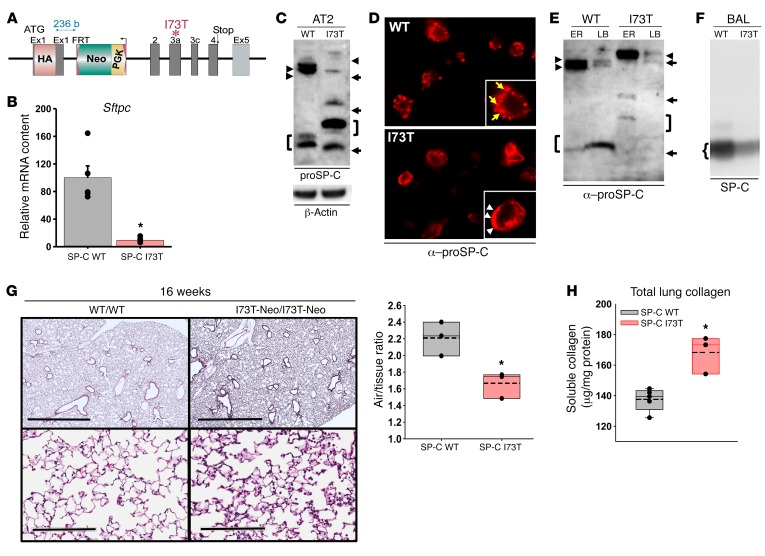
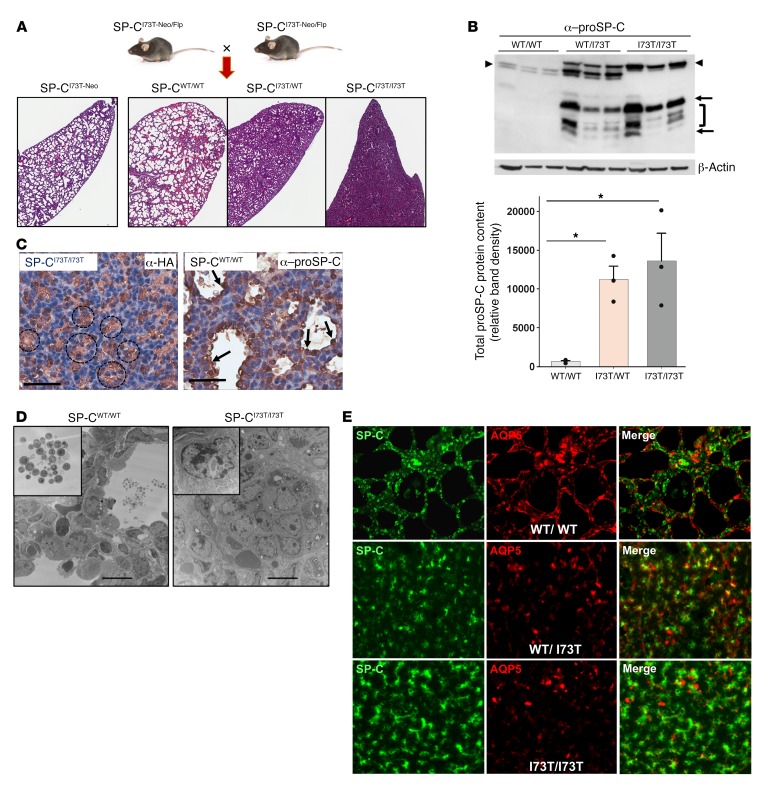
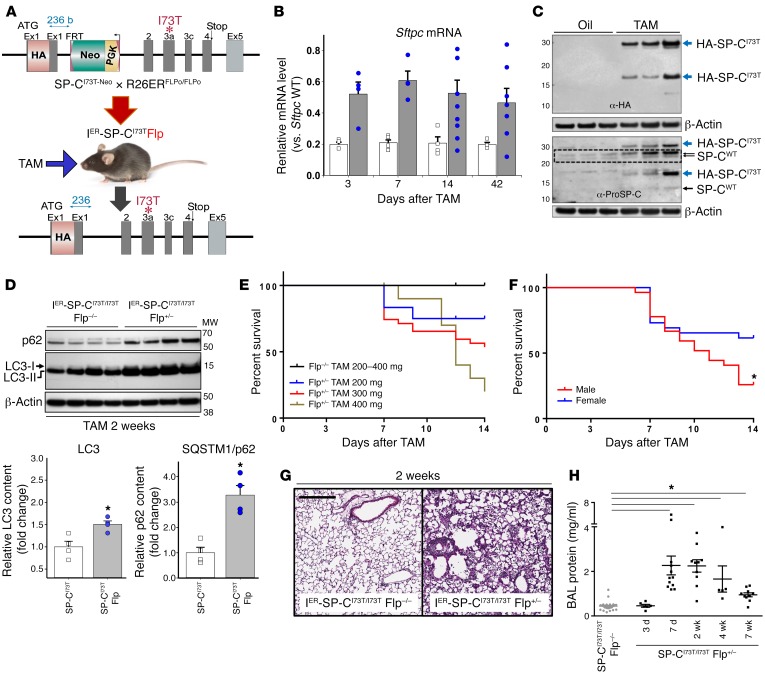
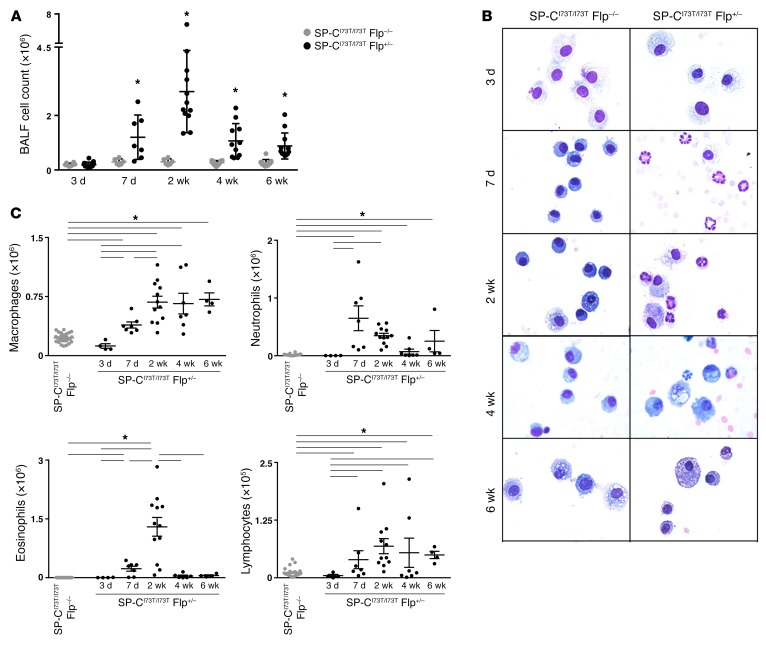
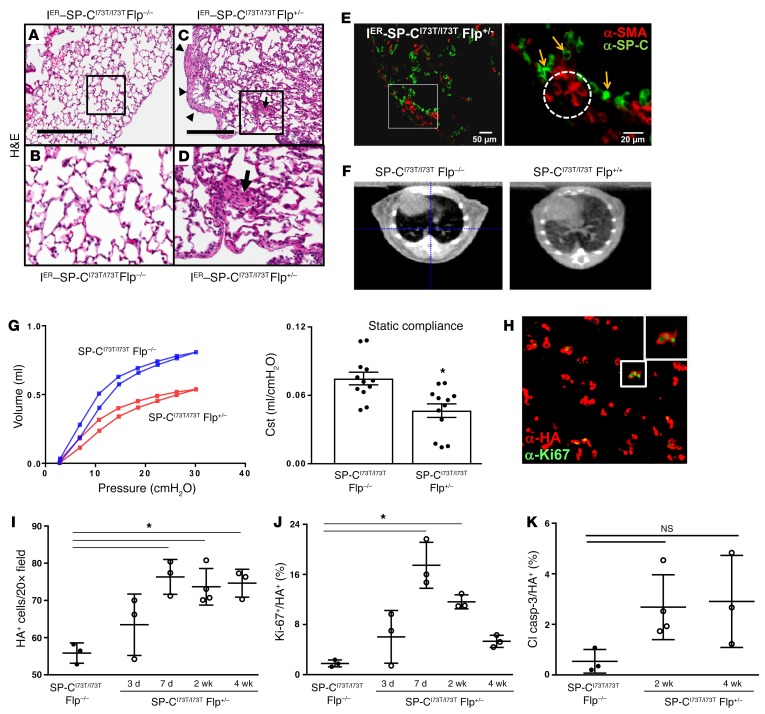
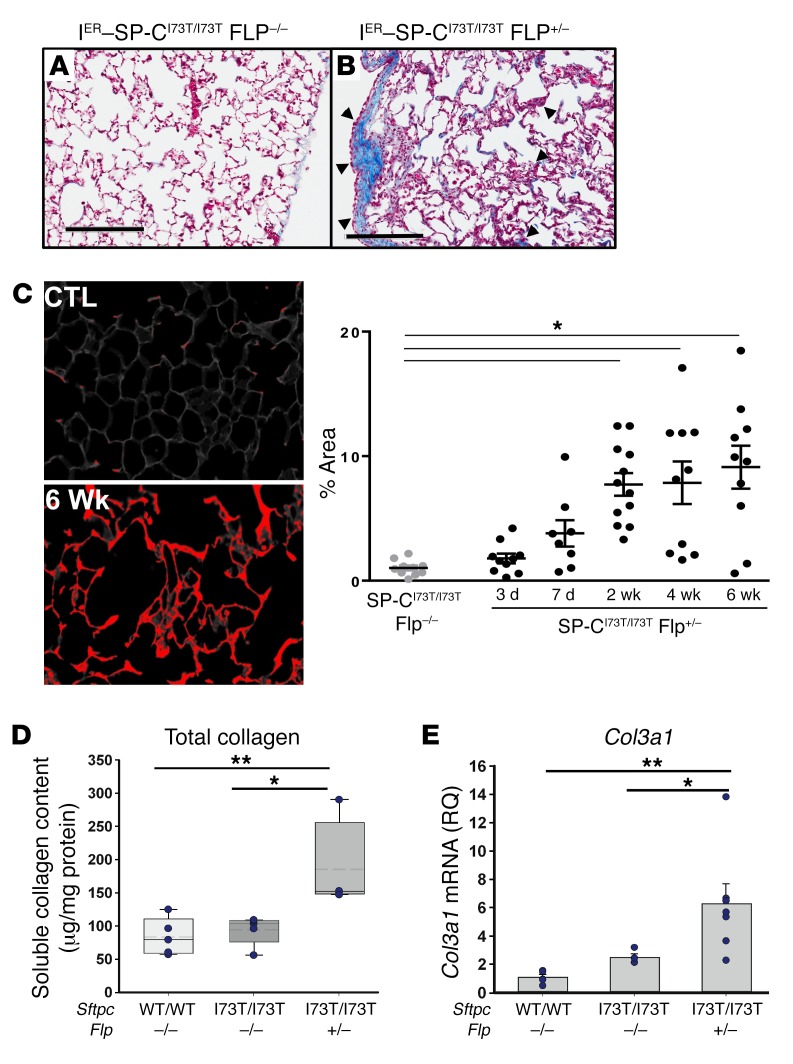
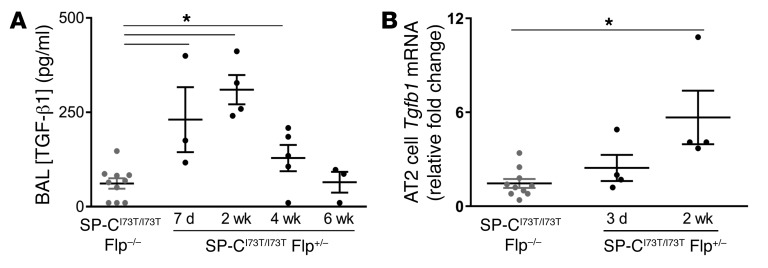
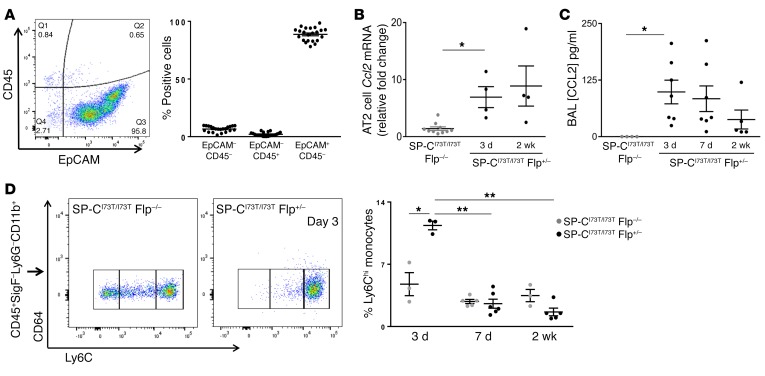
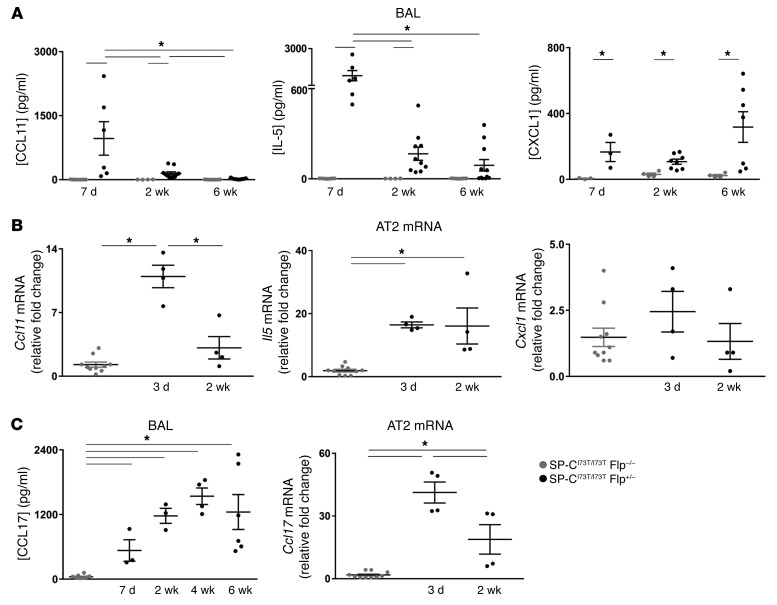
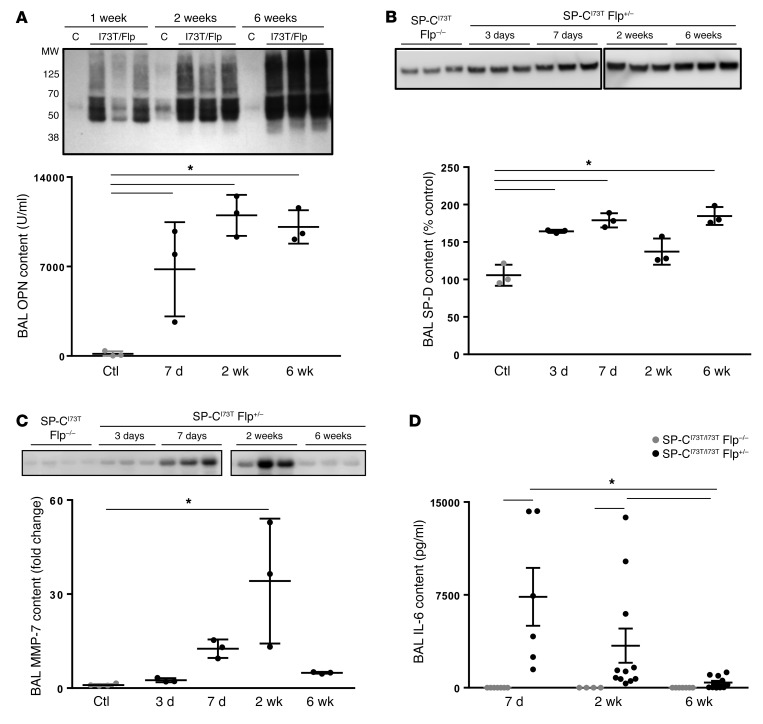
Epithelial cell dysfunction is postulated as an important component in the pathogenesis of idiopathic pulmonary fibrosis (IPF). Mutations in the surfactant protein C (SP-C) gene (SFTPC), an alveolar type II (AT2) cell-restricted protein, have been found in sporadic and familial IPF. To causally link these events, we developed a knockin mouse model capable of regulated expression of an IPF-associated isoleucine-to-threonine substitution at codon 73 (I73T) in Sftpc (SP-CI73T). Tamoxifen-treated SP-CI73T cohorts developed rapid increases in SftpcI73T mRNA and misprocessed proSP-CI73T protein accompanied by increased early mortality (days 7-14). This acute phase was marked by diffuse parenchymal lung injury, tissue infiltration by monocytes, polycellular alveolitis, and elevations in bronchoalveolar lavage and AT2 mRNA content of select inflammatory cytokines. Resolution of alveolitis (2-4 weeks), commensurate with a rise in TGF-β1, was followed by aberrant remodeling marked by collagen deposition, AT2 cell hyperplasia, α-smooth muscle actin-positive (α-SMA-positive) cells, and restrictive lung physiology. The translational relevance of the model was supported by detection of multiple IPF biomarkers previously reported in human cohorts. These data provide proof of principle that mutant SP-C expression in vivo causes spontaneous lung fibrosis, strengthening the role of AT2 cell dysfunction as a key upstream driver of IPF pathogenesis.

Keywords: Fibrosis; Pulmonary surfactants; Pulmonology.


Conflict of interest statement

Conflict of interest: The authors have declared that no conflict of interest exists.

Figures

Figure 1
Figure 1. Cellular and histopathological phenotype of the SP-CI73T-Neo founder line.
(A) Schematic of the HA-tagged SftpcI73T knockin allele showing the PGK-Neo cassette in intron 1. (B) qRT-PCR analysis for Sftpc mRNA expression in 12- to 28-week-old WT and homozygous SP-CI73T-Neo/I73T-Neo (SP-C I73T) mice. (C) Western blot of AT2 lysates for proSP-C (20 μg protein/lane). SP-CI73T-Neo/I73T-Neo mice accumulate an HA-tagged primary translation product (arrowheads) and misprocessed isoforms (arrows, right bracket). In WT/WT mice, both the primary translation product (arrowheads) and major processing intermediate (left bracket) were detected. (D) Immunohistochemistry for proSP-C of lung sections from 8-week-old WT and SP-CI73T-Neo/I73T-Neo mice revealed proSP-CI73T expression on AT2 cell plasma membranes (arrowheads); proSP-CWT is expressed in cytosolic vesicles of AT2 cells (arrows). (E) proSP-C Western blot of subcellular fractions enriched in ER or lamellar bodies (LB) from 8-week-old SP-CWT/WT and SP-CI73T-Neo/I73T-Neo mice. ER from each line contained the corresponding proSP-C primary translation product (arrowheads). The major proSP-CWT intermediate (Mr, 6,000) was enriched in LB (left bracket). All aberrantly processed proSP-CI73T isoforms were excluded from SP-CI73T-Neo LB (arrows, right bracket). (F) Western blot of surfactant showing decreased mature SP-C in SP-CI73T-Neo/I73T-Neo mice. (G) H&E-stained sections from 16-week-old mice (scale bars: 2 mm (upper panels); 200 μm (lower panels). Quantitative morphometry using ImageJ expressed as airspace/tissue ratio. (H) Total soluble collagen content in the left lobe from 32-week-old mice. Data represent mean ± SEM with dot plot overlays. *P < 0.05 versus SP-CWT by 2-tailed t test.
Figure 2
Figure 2. Constitutive deletion of PGK-Neo from SP-CI73T-Neo mice disrupts lung development.
(A) Backcross of SP-CI73T-Neo founder mice to FLP-e recombinase mice generated multiple genotypes of CFlp-SP-CI73T mice, including unexcised (SP-CI73T-Neo), excised (SP-CI73T), or WT alleles. Representative ×1.5 photomicrographs of H&E-stained lungs harvested from E18.5 CFlp-SP-CI73T mice with 1 (SP-CI73T/WT) or 2 (SP-CI73T/I73T) excised SftpcI73T allele(s) reveal a graded arrest of saccular lung development. (B) Immunoblotting of E18.5 WT or Neo-excised CFlp-SP-CI73T lung homogenates for proSP-C with β-actin as a loading control. Densitometric quantitation of aberrant proSP-CI73T (arrows, bracket) and WT proSP-C (arrowheads). *P < 0.05 versus WT/WT by 1-way ANOVA with Tukey’s post hoc test. (C) Staining of E18.5 CFlp-SP-CI73T/I73T embryos for HA revealed tufts of HA+ AT2 cells within obliterated saccules. CFlp-SP-CWT/WT controls showed normal developing saccules lined by proSP-C+ cells. Scale bars: 70 μm. (D) TEM of E18.5 CFlp-SP-CI73T/I73T and CFlp-SP-CWT/WT lungs. SP-CWT/WT saccules contained intraluminal surfactant (inset). CFlp-SP-CI73T/I73T lungs contained disrupted saccules filled with poorly differentiated epithelial cells (inset). Scale bars: 10 μm. (E) Representative ×60 immunofluorescence micrographs of E18.5 lungs from CFlp-SP-CI73T/I73T, CFlp-SP-CI73T/WT, and CFlp-SP-CWT mice stained for proSP-C (green) and AQP5 (red), showing loss of AQP5 and increase in proSP-C staining in CFlp-SP-CI73T animals.
Figure 3
Figure 3. Tamoxifen induction of SftpcI73T expression in IER-SP-CI73TFlp mice causes mortality and lung injury.
(A) IER-SP-CI73TFlp mice were generated by crossing a Rosa26-ER2-Flp-O (deleter) line (R26ERFLPo/FLPo) with SP-CI73T-Neo mice. (B) qRT-PCR analysis of Sftpc mRNA in IER-SP-CI73T/I73TFlp+/– (gray bars) or IER-SP-CI73T/I73TFlp–/– (white bars) mice at 3, 7, 14, and 42 days after tamoxifen (TAM). Normalized data are expressed as percent Sftpc WT (C57BL/6) mRNA standard. *P < 0.05 versus time point control by 2-tailed t test. (C) Top: Anti-HA Western blot of lung homogenates from double-heterozygous IER-SP-CI73T/WTFlp+/– mice 2 weeks after tamoxifen (200 mg/kg) or vehicle (oil) treatment showing upregulation of HA-proSP-CI73T isoforms (blue arrows). Bottom: Reprobing for α–proSP-C showing 22/21-kDa proSP-CWT (dotted rectangle) and 6-kDa proSP-C intermediate (black arrows), plus aberrant proSP-CI73T isoforms (blue arrows). (D) Western blot of AT2 lysates from IER-SP-CI73T/I73TFlp–/– or IER-SP-CI73T/I73TFlp+/– mice 2 weeks after iTAM for LC3 and SQSTM1/p62. Dot plots of densitometry for LC3 and p62 normalized to β-actin. *P < 0.05 versus control by 2-tailed t test. (E) Kaplan-Meier analysis for control IER-SP-CI73T/I73TFlp–/– mice treated with 300 mg/kg iTAM and IER-SP-CI73T/I73TFlp+/– groups treated with 200, 300, or 400 mg/kg iTAM (n = 11–33 / group). Mean survival using death or body weight <75% on 2 consecutive days as end points is shown. P < 0.05 for TAM IER-SP-CI73T/I73TFlp+/– at each iTAM dosage group (200, 300, or 400 mg/kg) versus TAM IER-SP-CI73T/I73TFlp–/– group using log-rank testing. (F) Survival of 8- to 12-week-old male (n =26) and female (n = 29) IER-SP-CI73T/I73TFlp+/– mice treated with 250–300 mg/kg iTAM. *P < 0.05 males versus females. (G) Representative H&E histology from surviving control and IER-SP-CI73T/I73TFlp+/– mice 14 days after 300 mg/kg iTAM. Scale bar: 300 μm. (H) BALF protein content in non-inducible IER-SP-CI73T/I73TFlp–/– or inducible IER-SP-CI73T/I73TFlp+/– mice after iTAM. Data from all time points for the non-inducible control group (gray dots) were combined. *P < 0.05 vs. IER-SP-CI73T/I73TFlp–/– by 1-way ANOVA.
Figure 4
Figure 4. Ontogeny of alveolitis induced by SP-CI73T expression.
(A) Dot plot with group mean ± SEM shown of total BALF cells recovered from IER-SP-CI73T/I73TFlp–/– (control) and IER-SP-CI73T/I73TFlp+/– mice 3, 7, 14, 28, and 42 days after tamoxifen. *P < 0.05 versus corresponding IER-SP-CI73T/I73TFlp–/– group for each time point by 2-tailed t test. (B) Representative Giemsa-stained BALF cytospins from IER-SP-CI73T/I73TFlp+/– and IER-SP-CI73T/I73TFlp–/– groups 3, 7, 14, 28, and 42 days after tamoxifen administration. (C) Dot plots with mean ± SEM of absolute numbers of macrophages, neutrophils, eosinophils, and lymphocytes determined by manual counting (>200 cells per slide). *P < 0.05 versus pooled IER-SP-CI73T/I73TFlp–/– controls by 1-way ANOVA.
Figure 5
Figure 5. SftpcI73T expression induces diffuse parenchymal lung remodeling, restrictive lung physiology, and AT2 cell expansion.
H&E sections of control (IER-SP-CI73T/I73TFlp–/–) (A and B) and inducible IER-SP-CI73T/I73TFlp+/– (C and D) mice 6 weeks after 300 mg/kg iTAM showing extensive parenchymal (D, box) and subpleural remodeling (C, arrowheads). On higher power, focal consolidations with features of fibroblastic foci are identified (D, arrow). (E) Double-label immunohistochemistry of 6-week iTAM-treated IER-SP-CI73T/I73TFlp+/– lungs showing focal airspace enlargement lined by proSP-C AT2 cells (arrows) with adjacent α-SMA–positive myofibroblasts (dashed circle). Scale bars: 50 μm (left), 20 μm (right). (F) MicroCT scans of IER-SP-CI73T/I73TFlp–/– and IER-SP-CI73T/I73TFlp+/+ mice at 6 weeks after 200 mg/kg tamoxifen. (G) Control (IER-SP-CI73T/I73TFlp–/–) and IER-SP-CI73T/I73TFlp+/– mice 4 weeks after 250–300 mg/kg tamoxifen administration were subjected to pulmonary function testing. Pooled flow volume loops (left) from each cohort (n = 12) and calculated static compliance (Cst, right) demonstrating restrictive physiology. *P < 0.05 versus IER-SP-CI73T/I73TFlp–/– control. (H) Representative ×20 fluorescence micrograph from IER-SP-CI73T/I73TFlp+/– lung 7 days after iTAM induction stained with anti-HA (red) and Ki-67 (green). (I and J) Sections were analyzed by manual counting. Dot plots with mean ± SEM are shown as the absolute number of HA+ cells per ×20 field (I) or percent of double-positive Ki-67+HA+ cells (J). *P < 0.05 versus IER-SP-CI73T/I73TFlp–/– control by 1-way ANOVA. (K) Sections double stained for α-HA and α–cleaved caspase-3 (Cl Casp-3) were manually counted as for I and J. Dot plots of double-positive (Cl Casp-3/HA+) cells expressed as a percentage of total HA+ AT2 cells are shown with mean and SEM. NS: P > 0.05 versus IER-SP-CI73T/I73TFlp–/– control by 1-way ANOVA.
Figure 6
Figure 6. SftpcI73T expression in AT2 cells increases lung collagen content.
Histological sections, homogenates, and RNA were prepared from lungs of IER-SP-CI73T/I73TFlp+/– mice and IER-SP-CI73T/I73TFlp–/– controls 6 weeks after 300 mg /kg tamoxifen. (A and B) Representative trichrome staining showing focal collagen deposition (blue) in both subpleural and parenchymal areas (arrowheads) of IER-SP-CI73T/I73TFlp+/– mice. Scale bars: 300 μm. (C) Representative Picrosirius red stained field from IER-SP-CI73T/I73TFlp+/– and IER-SP-CI73T/I73TFlp–/– (CTL) mice with quantitation performed using ImageJ. Data represent percentage of total section area, with dot plots and mean ± SEM shown. *P < 0.05 versus ER-SP-CI73T/I73TFlp+/– by One-way ANOVA with Tukey’s post hoc test. Scale bars: 50 μm (left), 20 μm (right). (D) Soluble collagen in left lung homogenates measured by Sircol assay. Shown are dot plots with mean ± SEM. The x axis depicts groups by Sftpc allele and Flp allele status. *P = 0.022 for IER-SP-CI73T/I73TFlp+/– versus IER-SP-CI73T/I73TFlp–/– and **P = 0.011 versus untreated WT (WT/WT) group by 1-way ANOVA with Tukey’s post hoc test. (E) The relative quantity (RQ) of Col3a1 mRNA was determined by qRT-PCR and expressed as fold change from untreated WT animals (WT/WT) (mean RQ = 1). x axis depicts groups by Sftpc and Flp allele status. Bar graphs with superimposed dot plots with mean ± SEM are shown. *P = 0.032 for IER-SP-CI73T/I73TFlp+/– versus IER-SP-CI73T/I73TFlp–/–; **P = 0.010 versus WT/WT by 1-way ANOVA with Tukey’s post hoc test.
Figure 7
Figure 7. BALF TGF-β1 and AT2 Tgfb1 mRNA increase prior to fibrotic remodeling.
(A) TGF-β1 levels in BALF collected at the indicated times after tamoxifen treatment were measured using Luminex. Gray dots represent values from iTAM-treated IER-SP-CI73T/I73TFlp–/– control mice pooled from all 4 time points and black dots values for IER-SP-CI73T/I73TFlp+/– mice at each time point. (B) qRT-PCR for Tgfb1 mRNA expression in AT2 cells isolated from IER-SP-CI73T/I73TFlp+/– mice at 3 and 14 days after tamoxifen (black dots) and iTAM-treated IER-SP-CI73T/I73TFlp–/– control mice pooled from both time points (gray dots). Data expressed as fold change from IER-SP-CI73T/I73TFlp–/– control group are presented as dot plots with mean ± SEM shown. *P < 0.05 versus IER-SP-CI73T/I73TFlp–/– control by 1-way ANOVA with Tukey’s post hoc test.
Figure 8
Figure 8. Ccl2 mRNA expression by SftpcI73T AT2 cells precedes BALF CCL2 and recruitment of Ly6ChiCD64 monocytes in lung tissue.
(A) Flow cytometry analysis for EpCAM (CD326) and CD45 expression in AT2 cells isolated from IER-SP-CI73T/I73TFlp–/– and IER-SP-CI73T/I73TFlp+/– mice. Dot plot showing EpCAM+CD45 (epithelial), EpCAMCD45+ (immune), and double-negative populations as a percentage of total cells from each preparation (n = 22 animals). (B) qRT-PCR of AT2 RNA for Ccl2 expression (18S-normalized) for IER-SP-CI73T/I73TFlp+/– group expressed as fold change (black dots) over IER-SP-CI73T/I73TFlp–/– controls pooled from both time points (gray dots). *P < 0.05 versus using 1-way ANOVA followed by Tukey’s post hoc test. (C) CCL2 (MCP-1) ELISA of BALF from IER-SP-CI73T/I73TFlp–/– and IER-SP-CI73T/I73TFlp+/– cohorts. Dot plots with mean ± SEM are shown. Controls were pooled from IER-SP-CI73T/I73TFlp–/– at all 3 time points (all less than detectable limit). *P < 0.05 versus control group using 1-way ANOVA followed by Tukey’s post hoc test. (D) Representative flow cytometry plot of lung cell suspensions for CD45+Ly6ChiCD64 populations in IER-SP-CI73T/I73TFlp–/– and IER-SP-CI73T/I73TFlp+/– mice on day 3. Dot plot (3 mice pooled per data point) with mean ± SEM showing relative percentage of Ly6ChiCD11cCD64CD11b+CD24Ly6G monocytes. Multiple comparisons were made by 1-way ANOVA followed by Tukey’s post hoc test. For Ly6Chi populations, *P < 0.05 for IER-SP-CI73T/I73TFlp+/– versus day 3 IER-SP-CI73T/I73TFlp–/–; **P < 0.05 for 3 day IER-SP-CI73T/I73TFlp+/– group versus IER-SP-CI73T/I73TFlp+/– at 7 or 14 days.
Figure 9
Figure 9. Cytokine expression profiles of IER-SP-CI73TFlp mice after tamoxifen treatment.
(A) IL-5, CCL11 (eotaxin), and CXCL1 (KC) were measured in BALF of IER-SP-CI73T/I73TFlp–/– (gray dots) and IER-SP-CI73T/I73TFlp+/– (black dots) cohorts at the indicated times after induction. Dot plots with mean ± SEM are shown. *P < 0.05 versus IER-SP-CI73T/I73TFlp–/– or IER-SP-CI73T/I73TFlp+/– as indicated using 1-way ANOVA followed by Tukey’s post hoc test. (B) qRT-PCR for Il5, Ccl11, and Cxcl1 mRNA in isolated AT2 cells. dCT values were normalized to 18S RNA and data expressed as fold change in IER-SP-CI73T/I73TFlp+/– samples (black dots) versus IER-SP-CI73T/I73TFlp–/– controls (gray dots). *P < 0.05 versus IER-SP-CI73T/I73TFlp–/– or 2-week IER-SP-CI73T/I73TFlp+/– groups as indicated by 1-way ANOVA followed by Tukey’s post hoc test. (C) Left: BALF CCL17 (TARC) levels at 1, 2, 4, and 6 weeks after iTAM determined by Luminex assay. Right: qRT-PCR for Ccl17 mRNA expression in AT2 cells from IER-SP-CI73T/I73TFlp+/– (black dots) and IER-SP-CI73T/I73TFlp–/– controls (gray dots) 3 and 14 days after iTAM. Data are presented as dot plots with mean ± SEM shown. *P < 0.05 versus IER-SP-CI73T/I73TFlp–/– or IER-SP-CI73T/I73TFlp+/– using 1-way ANOVA followed by Tukey’s post hoc test.
Figure 10
Figure 10. IER-SP-CI73TFlp mice express IPF biomarkers.
Western blotting of BALF (20 μl/lane) for OPN (A), SP-D (B), and MMP-7 (C) from IER-SP-CI73T/I73TFlp+/– mice obtained at 3 days to 6 weeks after tamoxifen as indicated. Controls (Ctl) consisted of IER-SP-CI73T/I73TFlp–/– mice 2 weeks after tamoxifen treatment. Densitomteric band intensities, expressed as relative units (A), percent control (B), or fold increase (C), are presented as dot plots with mean ± SEM. *P < 0.05 versus IER-SP-CI73T/I73TFlp–/– (CTL) by 1-way ANOVA followed by Tukey’s post hoc test. (D) ELISA for IL-6 content of BALF obtained 1, 2, and 6 weeks after tamoxifen treatment. Dot plots with mean ± SEM are shown for IER-SP-CI73T/I73TFlp+/– mice (black dots) and IER-SP-CI73T/I73TFlp–/– controls (gray dots). At all 3 time points, controls were below the limit of detection. *P < 0.05 versus IER-SP-CI73T/I73TFlp–/– by 1-way ANOVA followed by Tukey’s post hoc test.

Comment in

Similar articles

Cited by

  • Human-Based Advanced in vitro Approaches to Investigate Lung Fibrosis and Pulmonary Effects of COVID-19.
    Kiener M, Roldan N, Machahua C, Sengupta A, Geiser T, Guenat OT, Funke-Chambour M, Hobi N, Kruithof-de Julio M. Kiener M, et al. Front Med (Lausanne). 2021 May 7;8:644678. doi: 10.3389/fmed.2021.644678. eCollection 2021. Front Med (Lausanne). 2021. PMID: 34026781 Free PMC article. Review.
  • Functional Genomics of ABCA3 Variants.
    Wambach JA, Yang P, Wegner DJ, Heins HB, Luke C, Li F, White FV, Cole FS. Wambach JA, et al. Am J Respir Cell Mol Biol. 2020 Oct;63(4):436-443. doi: 10.1165/rcmb.2020-0034MA. Am J Respir Cell Mol Biol. 2020. PMID: 32692933 Free PMC article.
  • Innovations in Childhood Interstitial and Diffuse Lung Disease.
    Casey A, Fiorino EK, Wambach J. Casey A, et al. Clin Chest Med. 2024 Sep;45(3):695-715. doi: 10.1016/j.ccm.2024.04.002. Clin Chest Med. 2024. PMID: 39069332 Free PMC article. Review.
  • A census of the lung: CellCards from LungMAP.
    Sun X, Perl AK, Li R, Bell SM, Sajti E, Kalinichenko VV, Kalin TV, Misra RS, Deshmukh H, Clair G, Kyle J, Crotty Alexander LE, Masso-Silva JA, Kitzmiller JA, Wikenheiser-Brokamp KA, Deutsch G, Guo M, Du Y, Morley MP, Valdez MJ, Yu HV, Jin K, Bardes EE, Zepp JA, Neithamer T, Basil MC, Zacharias WJ, Verheyden J, Young R, Bandyopadhyay G, Lin S, Ansong C, Adkins J, Salomonis N, Aronow BJ, Xu Y, Pryhuber G, Whitsett J, Morrisey EE; NHLBI LungMAP Consortium. Sun X, et al. Dev Cell. 2022 Jan 10;57(1):112-145.e2. doi: 10.1016/j.devcel.2021.11.007. Epub 2021 Dec 21. Dev Cell. 2022. PMID: 34936882 Free PMC article.
  • Alveolar lipids in pulmonary disease. A review.
    Agudelo CW, Samaha G, Garcia-Arcos I. Agudelo CW, et al. Lipids Health Dis. 2020 Jun 3;19(1):122. doi: 10.1186/s12944-020-01278-8. Lipids Health Dis. 2020. PMID: 32493486 Free PMC article. Review.

References

    1. Travis WD, et al. An official American Thoracic Society/European Respiratory Society statement: Update of the international multidisciplinary classification of the idiopathic interstitial pneumonias. Am J Respir Crit Care Med. 2013;188(6):733–748. doi: 10.1164/rccm.201308-1483ST. - DOI - PMC - PubMed
    1. King TE, Pardo A, Selman M. Idiopathic pulmonary fibrosis. Lancet. 2011;378(9807):1949–1961. doi: 10.1016/S0140-6736(11)60052-4. - DOI - PubMed
    1. Raghu G, Weycker D, Edelsberg J, Bradford WZ, Oster G. Incidence and prevalence of idiopathic pulmonary fibrosis. Am J Respir Crit Care Med. 2006;174(7):810–816. doi: 10.1164/rccm.200602-163OC. - DOI - PubMed
    1. Kropski JA, Lawson WE, Young LR, Blackwell TS. Genetic studies provide clues on the pathogenesis of idiopathic pulmonary fibrosis. Dis Model Mech. 2013;6(1):9–17. doi: 10.1242/dmm.010736. - DOI - PMC - PubMed
    1. Mulugeta S, Nureki S, Beers MF. Lost after translation: insights from pulmonary surfactant for understanding the role of alveolar epithelial dysfunction and cellular quality control in fibrotic lung disease. Am J Physiol Lung Cell Mol Physiol. 2015;309(6):L507–L525. doi: 10.1152/ajplung.00139.2015. - DOI - PMC - PubMed

Publication types

MeSH terms