Case Reports
. 2018 Aug 31;128(9):3819-3825.
doi: 10.1172/JCI120787. Epub 2018 Aug 6.

Oncogenic TRK fusions are amenable to inhibition in hematologic malignancies

Affiliations
Case Reports

Oncogenic TRK fusions are amenable to inhibition in hematologic malignancies

Justin Taylor et al. J Clin Invest. .

Abstract

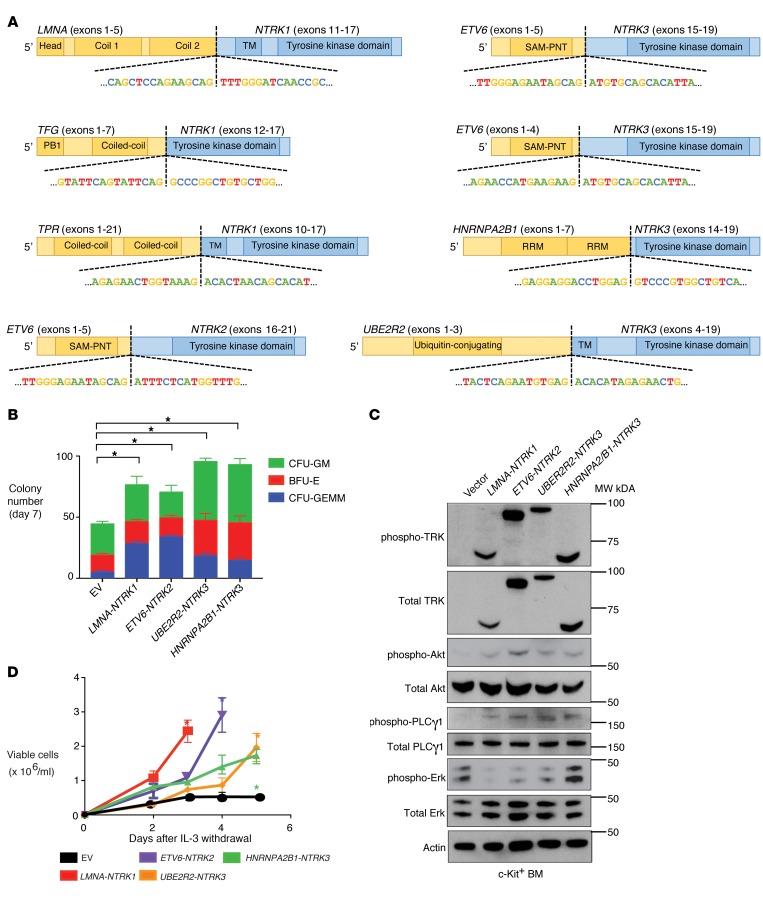
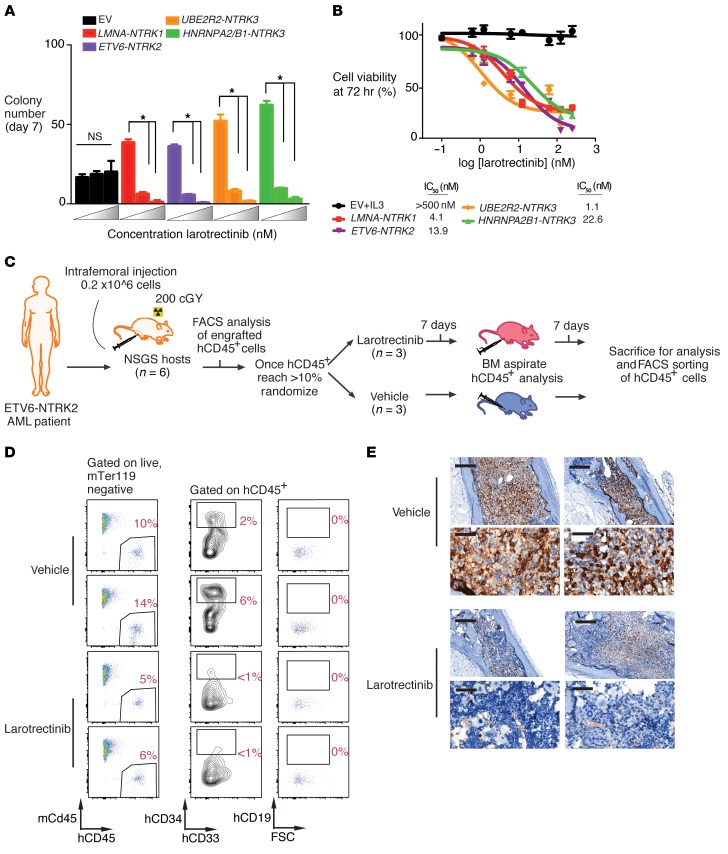
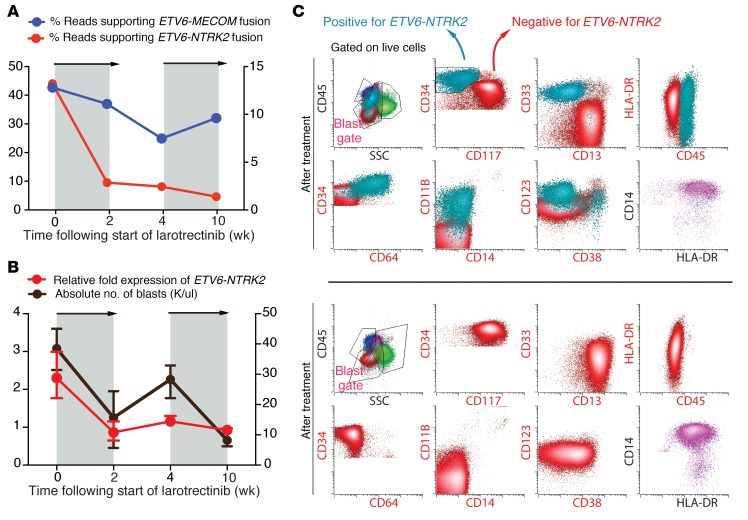
Rearrangements involving the neurotrophic receptor kinase genes (NTRK1, NTRK2, and NTRK3; hereafter referred to as TRK) produce oncogenic fusions in a wide variety of cancers in adults and children. Although TRK fusions occur in fewer than 1% of all solid tumors, inhibition of TRK results in profound therapeutic responses, resulting in Breakthrough Therapy FDA approval of the TRK inhibitor larotrectinib for adult and pediatric patients with solid tumors, regardless of histology. In contrast to solid tumors, the frequency of TRK fusions and the clinical effects of targeting TRK in hematologic malignancies are unknown. Here, through an evaluation for TRK fusions across more than 7,000 patients with hematologic malignancies, we identified TRK fusions in acute lymphoblastic leukemia (ALL), acute myeloid leukemia (AML), histiocytosis, multiple myeloma, and dendritic cell neoplasms. Although TRK fusions occurred in only 0.1% of patients (8 of 7,311 patients), they conferred responsiveness to TRK inhibition in vitro and in vivo in a patient-derived xenograft and a corresponding AML patient with ETV6-NTRK2 fusion. These data identify that despite their individual rarity, collectively, TRK fusions are present in a wide variety of hematologic malignancies and predict clinically significant therapeutic responses to TRK inhibition.

Keywords: Cancer; Hematology; Oncogenes; Oncology; Signal transduction.


Conflict of interest statement

Conflict of interest: DP, LAA, TM, and SA are employees of Foundation Medicine Inc. KE, BBT, and NK are employees of LOXO Oncology Inc.

Figures

Figure 1
Figure 1. Transforming TRK fusions are present across hematologic malignancies and cause transformation in a cell-type specific manner.
(A) Diagram of the TRK fusions identified across 7,311 patients with hematologic malignancy, with the domain of each protein included in the fusion and the nucleotide sequence at the break points shown. The carboxy-terminal kinase domains of TRK proteins are fused in-frame to the amino-terminal fusion partners. (B) Methylcellulose colony numbers formed by murine c-Kit+ bone marrow transduced with the indicated fusion proteins (CFU-GM, colony-forming unit granulocyte-macrophage; CFU-GEMM, colony-forming unit granulocyte, erythrocyte, monocyte, megakaryocyte; and BFU-E, burst-forming unit erythroid). (C) Western blot performed on lysates from cells in B. Blots were stripped and reprobed for total proteins after respective phospho-proteins. (D) Growth of 32D cells in media lacking IL-3 either expressing the indicated fusion protein or transduced with the empty vector (EV) as negative control. Error bars represent mean and SD from triplicate samples. Differences were calculated using a 2-sided Student’s t test and corrected for multiple testing using the Bonferroni method (*P < 0.0125).
Figure 2
Figure 2. TRK fusions confer responsiveness to TRK inhibition in hematopoietic malignancies in vitro and in vivo.
(A) Colony numbers derived from c-Kit+ murine bone marrow cells stably expressing the indicated constructs grown in increasing concentrations (0, 25, and 50 nM) of larotrectinib in methylcellulose. (B) Cell viability of IL-3–independent 32D cells expressing TRK fusions following 72 hours of larotrectinib or vehicle treatment. The IC50 is calculated from the slope of the log inhibitor versus response curve. (C) Schematic of creation and testing of larotrectinib in a PDX from a patient with AML with an ETV6-NTRK2 fusion. (D) Flow cytometric analysis of mouse versus human cell subsets (mCD45 versus hCD45) in BM of a PDX after larotrectinib or vehicle treatment. Each row represents a distinct individual mouse xenografted with the same patient sample; all percentages represent percentage of live mouse Ter119–negative (mTer119-negative) cells. (E) Anti-hCD45 immunohistochemical analysis in BM from PDX mice treated with vehicle or larotrectinib for 14 days (top row scale bar, 200 μm; bottom row scale bar, 50 μm). Each column represents a distinct individual mouse xenografted with the same patient sample. Error bars represent mean and SD from triplicate samples. Differences were calculated using a 2-sided Student’s t test and corrected for multiple testing using the Bonferroni method (*P < 0.0125).
Figure 3
Figure 3. Response of ETV6-NTRK2 fusion AML to larotrectinib and clinical relapse due to outgrowth of TRK fusion–negative clone.
(A) Targeted RNA sequencing of peripheral blood mononuclear cells (PBMNCs) during larotrectinib treatment of the patient showing sequencing reads supporting ETV6-NTRK2 (red line) or ETV6-MECOM (blue line). Gray areas denote time when larotrectinib was being administered to the patient. (B) ETV6-NTRK2 expression in PBMNCs measured by qRT-PCR (red line) during treatment of the patient as well as absolute number of PB blasts (black line). Error bars represent mean and SD from triplicate samples (error bars for blast percentage in B represent average of 3 consecutive days of blast percentage surrounding this time point). Relative fold expression of ETV6-NTRK2 was defined relative to the last time point. (C) Serial FACS analysis of bone marrow samples before treatment (top 2 rows) and after treatment (bottom 2 rows) with larotrectinib. All cells were gated on live cells and gates with red labels were gated on blasts as well. Changes in the frequency of TRK fusion–positive (turquoise; CD34+ CD117- cells in the blast gate) and –negative (red; CD34+ CD117+ cells in the blast gate) blasts before and after treatment are shown. Normal monocytes (CD45+HLA-DR+CD11b+CD14+) are shown in purple.

References

    1. Pulciani S, Santos E, Lauver AV, Long LK, Aaronson SA, Barbacid M. Oncogenes in solid human tumours. Nature. 1982;300(5892):539–542. doi: 10.1038/300539a0. - DOI - PubMed
    1. Martin-Zanca D, Hughes SH, Barbacid M. A human oncogene formed by the fusion of truncated tropomyosin and protein tyrosine kinase sequences. Nature. 1986;319(6056):743–748. doi: 10.1038/319743a0. - DOI - PubMed
    1. Tognon C, et al. Expression of the ETV6-NTRK3 gene fusion as a primary event in human secretory breast carcinoma. Cancer Cell. 2002;2(5):367–376. doi: 10.1016/S1535-6108(02)00180-0. - DOI - PubMed
    1. Skálová A, et al. Mammary analogue secretory carcinoma of salivary glands, containing the ETV6-NTRK3 fusion gene: a hitherto undescribed salivary gland tumor entity. Am J Surg Pathol. 2010;34(5):599–608. - PubMed
    1. Nagasubramanian R, Wei J, Gordon P, Rastatter JC, Cox MC, Pappo A. Infantile fibrosarcoma with NTRK3-ETV6 fusion successfully treated with the tropomyosin-related kinase inhibitor LOXO-101. Pediatr Blood Cancer. 2016;63(8):1468–1470. doi: 10.1002/pbc.26026. - DOI - PMC - PubMed

Publication types

MeSH terms