. 2018 Aug 31;128(9):3794-3805.
doi: 10.1172/JCI99169. Epub 2018 Jul 30.

Itaconic acid mediates crosstalk between macrophage metabolism and peritoneal tumors

Affiliations

Itaconic acid mediates crosstalk between macrophage metabolism and peritoneal tumors

Jonathan M Weiss et al. J Clin Invest. .

Abstract

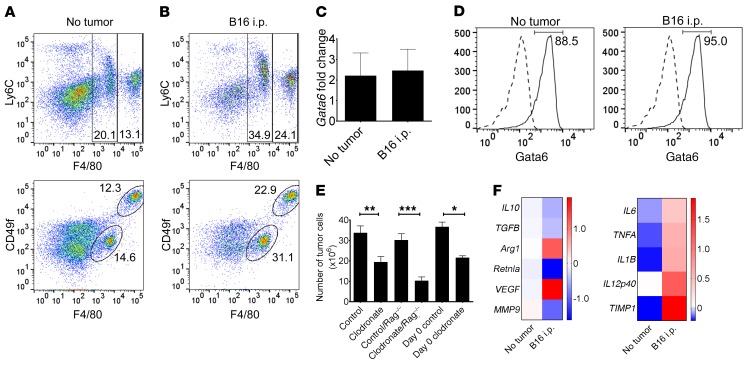
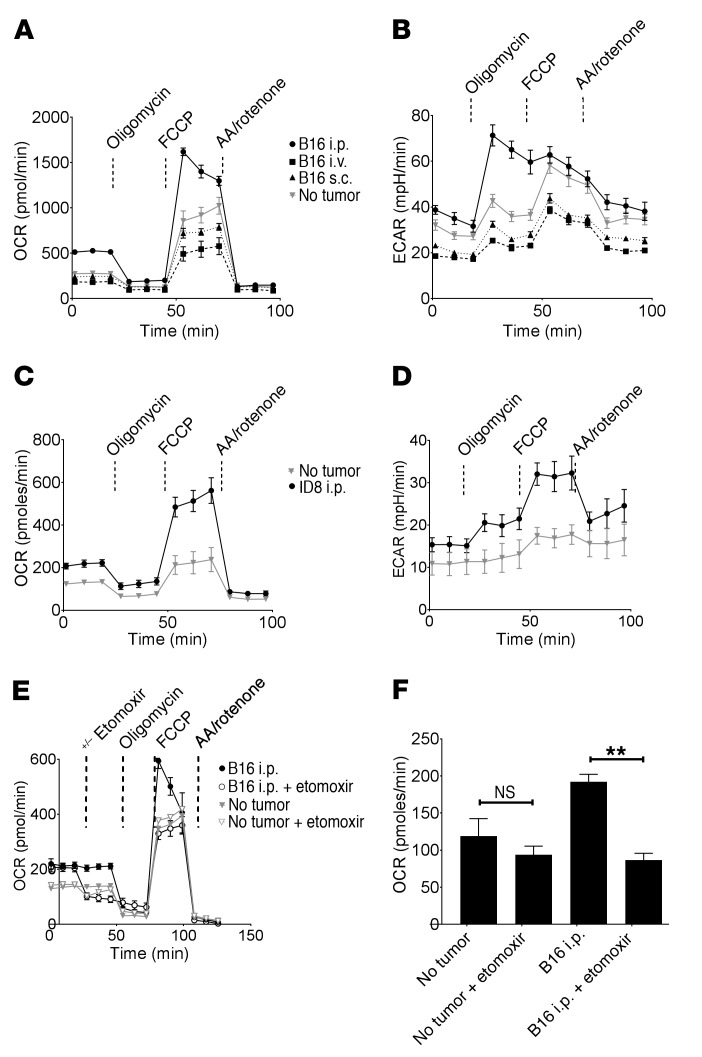
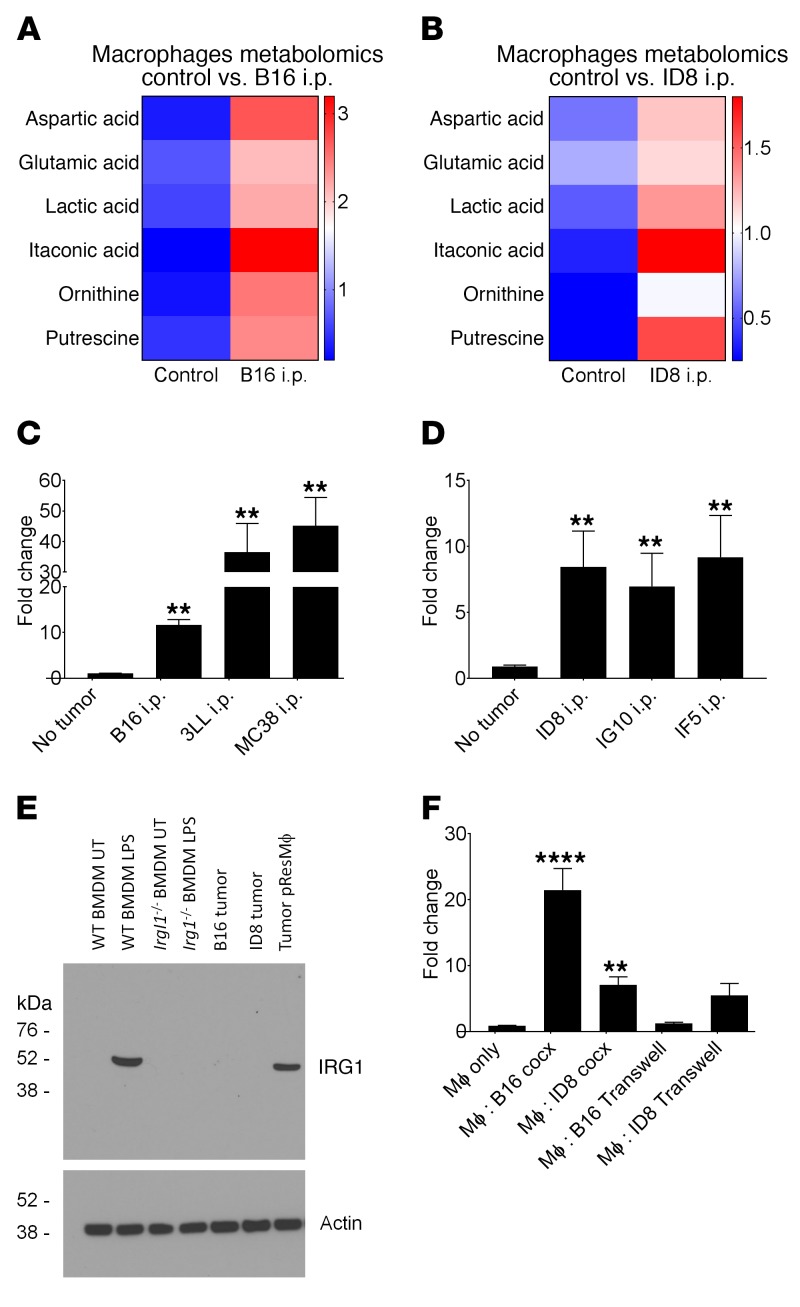
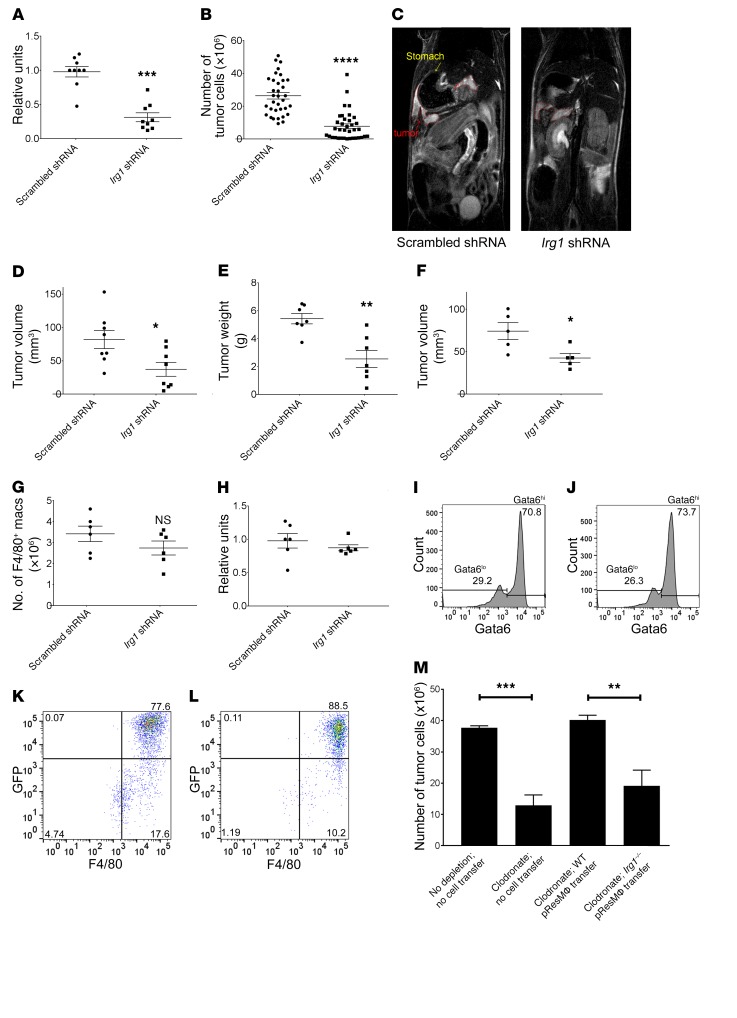
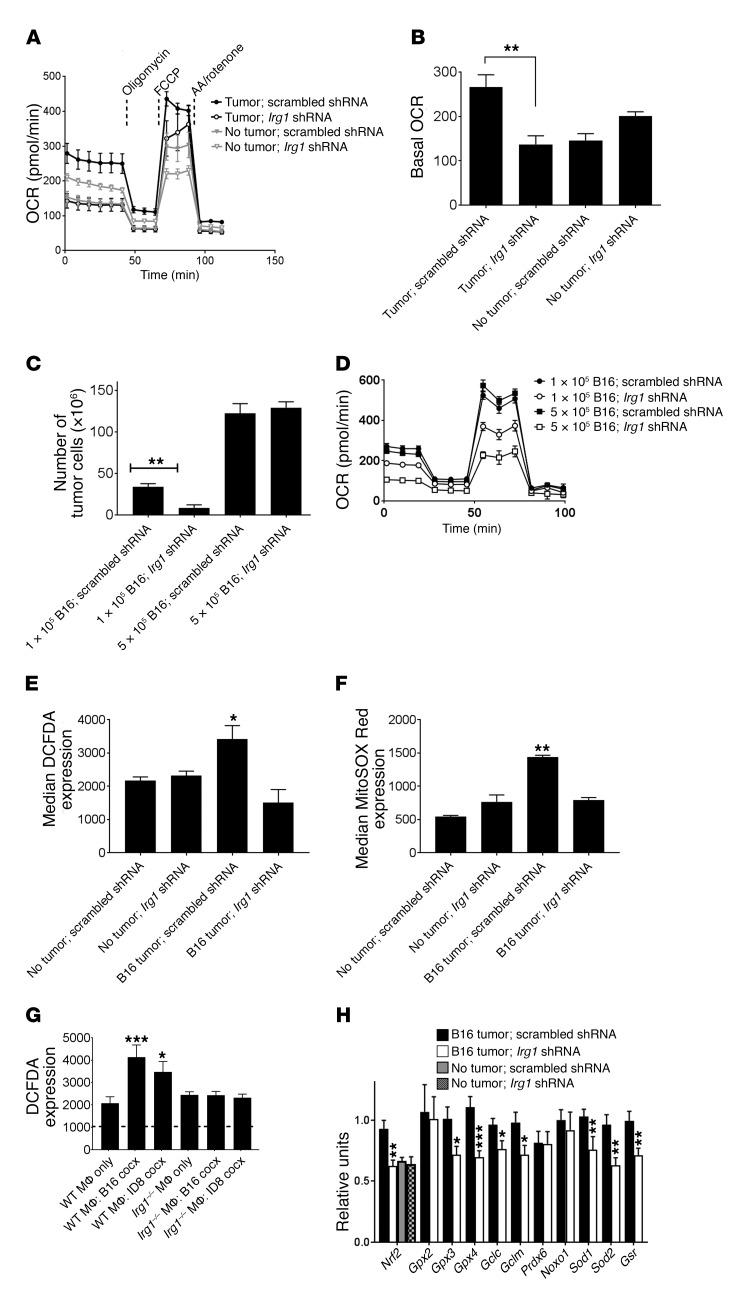
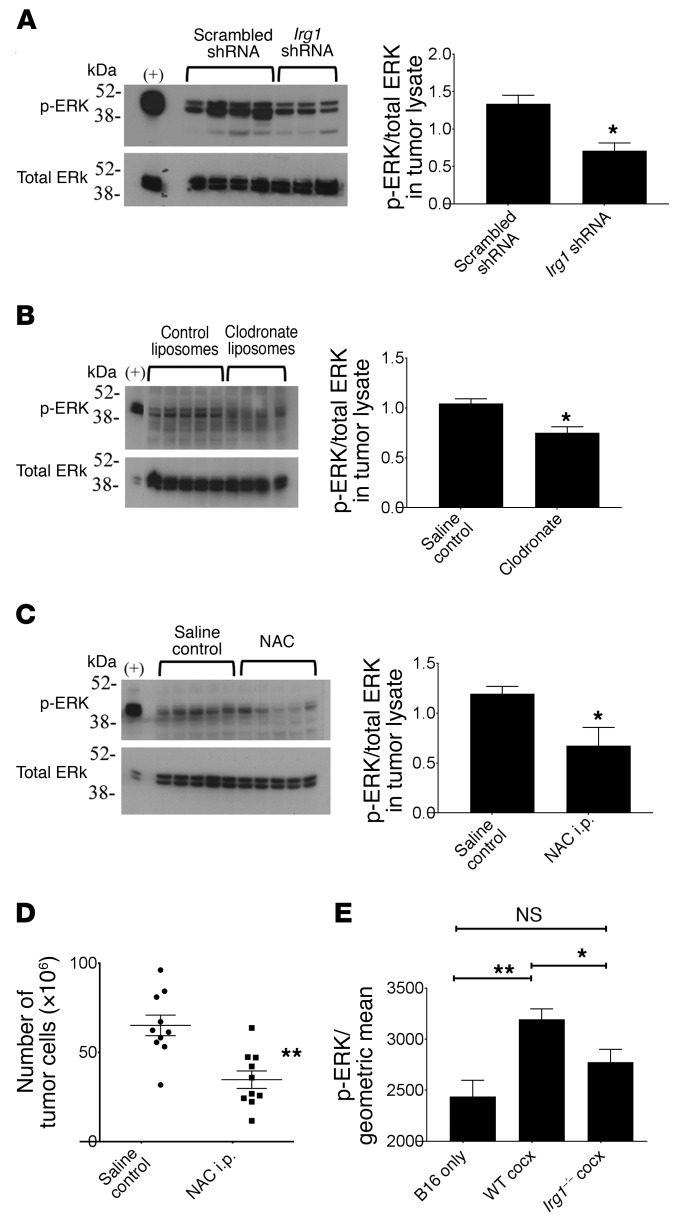
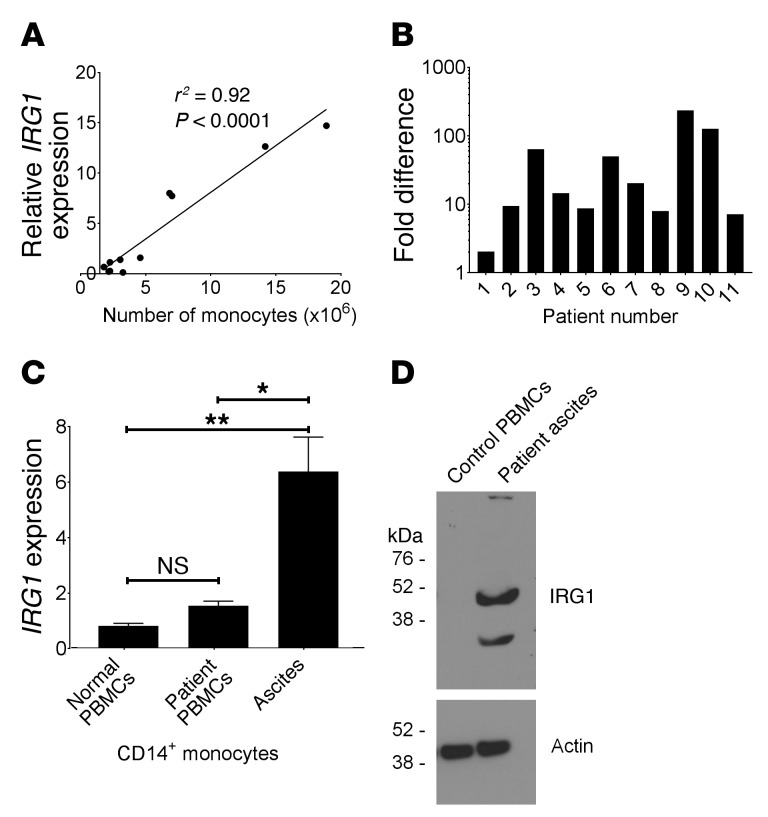
Control of cellular metabolism is critical for efficient cell function, although little is known about the interplay between cell subset-specific metabolites in situ, especially in the tumor setting. Here, we determined how a macrophage-specific (Mϕ-specific) metabolite, itaconic acid, can regulate tumor progression in the peritoneum. We show that peritoneal tumors (B16 melanoma or ID8 ovarian carcinoma) elicited a fatty acid oxidation-mediated increase in oxidative phosphorylation (OXPHOS) and glycolysis in peritoneal tissue-resident macrophages (pResMϕ). Unbiased metabolomics identified itaconic acid, the product of immune-responsive gene 1-mediated (Irg1-mediated) catabolism of mitochondrial cis-aconitate, among the most highly upregulated metabolites in pResMϕ of tumor-bearing mice. Administration of lentivirally encoded Irg1 shRNA significantly reduced peritoneal tumors. This resulted in reductions in OXPHOS and OXPHOS-driven production of ROS in pResMϕ and ROS-mediated MAPK activation in tumor cells. Our findings demonstrate that tumors profoundly alter pResMϕ metabolism, leading to the production of itaconic acid, which potentiates tumor growth. Monocytes isolated from ovarian carcinoma patients' ascites fluid expressed significantly elevated levels of IRG1. Therefore, IRG1 in pResMϕ represents a potential therapeutic target for peritoneal tumors.

Keywords: Intermediary metabolism; Metabolism; Monocytes; Mouse models; Oncology.


Conflict of interest statement

Conflict of interest: The authors have declared that no conflict of interest exists.

Figures

Figure 1
Figure 1. Characterization of peritoneal leukocytes from tumor-bearing hosts.
Flow cytometric analysis was performed on the peritoneal lavage cells from (A) naive and (B) B16 tumor–bearing mice. Among F4/80-sorted leukocytes, Gata6 expression was evaluated by (C) qPCR and (D) intracellular flow cytometry. Flow cytometric plots are representative of 6 samples (2 experiments each consisting of triplicate samples). The dotted lines represent isotype control staining. (E) B16 tumor burden was quantified in WT or Rag–/– mice that received control or clodronate liposomes on day 2 (after tumor) or day 0 (before tumor) (n ≥5). *P < 0.05, **P < 0.01, and ***P < 0.001, by ANOVA with Tukey’s multiple comparisons test. (F) F4/80-sorted Mϕ were evaluated by qPCR for M2 (left) and M1 (right) prototypic gene expression. Triplicate samples were evaluated, with one of the no-tumor samples set to 1.0 as a reference point (heatmaps depict log2-transformed, relative-based results of gene expression; all genes shown were significantly altered in the B16 group to at least P < 0.05 as compared with the no-tumor group; unpaired Student’s t test). Data represent the mean ± SEM.
Figure 2
Figure 2. Tumors increase oxidative and glycolytic metabolism in pResMϕ.
Extracellular flux analysis of F4/80-sorted pResMϕ from non–tumor-bearing control mice or mice inoculated with B16 via the indicated routes were analyzed. The (A) OCR and (B) ECAR were graphed over time as indicators of OXPHOS and glycolysis, respectively. Drugs were injected into the ports at the indicated time points. F4/80-sorted pResMϕ from no–tumor-bearing control mice or mice bearing ID8 ovarian carcinoma (day 47) were similarly evaluated for (C) cellular OCR and (D) ECAR. (E) OXPHOS of peritoneal Mϕ from control and B16 tumor–bearing mice were evaluated following injection of etomoxir into the first port at the indicated time point. (F) Basal OCRs for the treatment groups were graphed. **P < 0.01, by ANOVA with Tukey’s multiple comparisons test. All plots are representative of 3 experiments. Data represent the mean ± SEM. AA, Antimycin A.
Figure 3
Figure 3. Irg1 and itaconic acid are upregulated in pResMϕ by peritoneal tumors.
Unbiased metabolomic analysis was performed on F4/80-sorted pResMϕ from control and either (A) B16 melanoma– or (B) ID8 ovarian carcinoma–bearing mice. The mean values from at least 5 replicate samples were log10 transformed and plotted (P < 0.05 for all metabolites by unpaired Student’s t test). Irg1 gene expression was evaluated by qPCR in F4/80-sorted pResMϕ from control mice and mice bearing either (C) day-9 B16 melanoma, 3LL, or MC38 tumors or (D) day-30 ID8, IG10, or IF5 ovarian carcinomas. Triplicate samples were evaluated, with one of the no-tumor control samples serving as the 1.0 relative reference point. **P < 0.01, by unpaired Student’s t test. (E) IRG1 protein levels in B16 and ID8 tumor lysates and pResMϕ purified from tumors were determined by Western blotting. Unstimulated or LPS-stimulated bone marrow–derived Mϕ from WT and Irg1–/– mice were used as controls. (F) pResMϕ were cocultured in vitro with the indicated tumor cells for 48 hours. Irg1 expression was evaluated by qPCR (n = 3). cocx, co-culture. **P < 0.01 and ****P < 0.0001, by ANOVA with Tukey’s multiple comparisons test. Data represent the mean ± SEM.
Figure 4
Figure 4. Irg1 silencing in pResMϕ reduces peritoneal tumor burden.
B16 tumor–bearing mice were treated with lentiviral shRNA (scrambled control or Irg1 silencing). (A) Gene expression of Irg1 was evaluated by qPCR (n = 9). (B) B16 tumor burden was quantitated and (C) evaluated by MRI of live tumor-bearing mice (MRI images are representative of 8 mice). (D) Tumor volumes were calculated by computing the tumor area on each plane and multiplying by the thickness of each slice (n = 8). The tumor weight (E) and volume (F) of ID8 ovarian carcinoma–bearing mice were measured (n ≥5). (G) Total numbers of F4/80+ pResMϕ were comparable among 6 scrambled shRNA and Irg1 shRNA recipient mice. Gata6 gene expression by qPCR (H) and protein levels were indistinguishable among scrambled (I) and Irg1 (J) shRNA recipient mice. A similar uptake of lentiviral shRNA was confirmed by EGFP visualization in F4/80+ pResMϕ isolated from mice receiving scrambled (K) or Irg1 (L) shRNA constructs. All FACS plots are representative of at least 6 mice per group. (M) Clodronate-depleted CD45.1 congenic mice (5 mice/group) were inoculated i.p. with peritoneal lavage cells from WT or Irg1–/– mice 1 day prior to tumor inoculation, and the B16 tumor burden was quantitated. Data represent the mean ± SEM. *P < 0.05, **P < 0.01, ***P < 0.001, and ****P < 0.0001, by Mann-Whitney U test.
Figure 5
Figure 5. Itaconate regulates OXPHOS and mitochondrial ROS expression in pResMϕ.
Extracellular flux was analyzed on F4/80-sorted pResMϕ from B16 tumor–bearing mice receiving either scrambled or Irg1 shRNA (A). The OCR over time (A) and the basal OCR (B) were graphed. Data are representative of 3 experiments. **P < 0.01, by ANOVA with Tukey’s multiple comparisons test. Tumor burden (C) and pResMϕ extracellular flux (D) were evaluated in mice that received 1 × 10⁵ or 5 × 10⁵ B16 tumor cells and either scrambled or Irg1 shRNA (n = 5). **P < 0.01, by ANOVA with Tukey’s multiple comparisons test. pResMϕ ROS production was assessed by measuring the median CM-H2DCFDA (E) and MitoSOX Red (F) expression by flow cytometry (n = 6). *P < 0.05 and **P < 0.01, by ANOVA with Tukey’s multiple comparisons test. (G) pResMϕ from WT or Irg1–/– mice were cocultured in vitro with the indicated tumor cells for 48 hours. Median CM-H2DCFDA expression was evaluated by flow cytometry (n = 3). The dotted line denotes no DCFDA control staining. *P < 0.05 and ***P < 0.001, by ANOVA with Tukey’s multiple comparisons test. (H) Gene expression levels modulated by oxidative stress and ROS in mice that received scrambled or Irg1 shRNA were evaluated by qPCR (n = 14). *P < 0.05, **P < 0.01, and ***P < 0.001, by Mann-Whitney U test. Data represent the mean ± SEM.
Figure 6
Figure 6. pResMϕ regulate MAPK activation in peritoneal tumors via itaconate and ROS.
B16 tumor lysates were prepared as described in Methods and analyzed by Western blotting for expression of p-ERK and total ERK. (A) Tumor lysates from mice that received scrambled or Irg1 shRNA constructs were compared (n ≥4). *P < 0.05, by Mann-Whitney U test. (B) Tumor lysates from mice that received control or clodronate liposomes were compared. *P < 0.05, by Mann-Whitney U test. (C) Tumor lysates from saline control– or NAC-treated mice were analyzed (n = 5). *P < 0.05, by Mann-Whitney U test. (D) NAC i.p. treatment reduced the number of B16 tumor cells (n = 10). **P < 0.01, by Mann-Whitney U test. (E) B16 tumor cells were cultured in vitro alone or in coculture with the indicated pResMϕ. After 48 hours, tumor cells, gated by CD146+F4/80 expression, were analyzed by flow cytometry for intracellular p-ERK expression. *P < 0.05 and **P < 0.01, by ANOVA, corrected for multiple comparisons. Data represent the mean ± SEM.
Figure 7
Figure 7. IRG1 is expressed in monocytes associated with human peritoneal tumors.
IRG1 expression was evaluated by qPCR using total RNA isolated from cell fractions from 11 human patients with ovarian carcinoma. (A) IRG1 expression levels were established by setting normal PBMC values to 1.0, and the relative levels in ascites monocytes were graphed in relation to the total number of CD45+CD14+ monocytes in each sample. Linear regression analysis was performed (GraphPad Prism) to obtain the best curve fit (r2 = 0.93; P < 0.0001). (B) The fold difference in IRG1 expression among monocytes and non-monocyte fractions is shown. CD14+ monocytes were purified as described in Methods. For each patient sample, the level of IRG1 expression in the non-monocyte fraction was set to 1.0, and the relative level of IRG1 expression in the corresponding monocyte fraction was graphed (log10). Significance was determined by a 1-sample Student’s t test using 1.0 as a theoretical mean (P < 0.05). (C) IRG1 expression levels in CD14+ PBMCs isolated from 6 healthy volunteers and 5 patients were compared with IRG1 levels in the 11 ascites samples. *P < 0.0 and **P < 0.01, by ANOVA corrected for multiple comparisons. (D) IRG1 protein expression in CD14+ monocytes isolated from healthy blood and patients’ ascites was analyzed by Western blotting.

References

    1. Romero I, Bast RC. Minireview: human ovarian cancer: biology, current management, and paths to personalizing therapy. Endocrinology. 2012;153(4):1593–1602. doi: 10.1210/en.2011-2123. - DOI - PMC - PubMed
    1. Davies LC, Jenkins SJ, Allen JE, Taylor PR. Tissue-resident macrophages. Nat Immunol. 2013;14(10):986–995. doi: 10.1038/ni.2705. - DOI - PMC - PubMed
    1. Davies LC, Rice CM, Palmieri EM, Taylor PR, Kuhns DB, McVicar DW. Peritoneal tissue-resident macrophages are metabolically poised to engage microbes using tissue-niche fuels. Nat Commun. 2017;8(1):2074. doi: 10.1038/s41467-017-02092-0. - DOI - PMC - PubMed
    1. Ruffell B, Affara NI, Coussens LM. Differential macrophage programming in the tumor microenvironment. Trends Immunol. 2012;33(3):119–126. doi: 10.1016/j.it.2011.12.001. - DOI - PMC - PubMed
    1. Robinson-Smith TM, et al. Macrophages mediate inflammation-enhanced metastasis of ovarian tumors in mice. Cancer Res. 2007;67(12):5708–5716. doi: 10.1158/0008-5472.CAN-06-4375. - DOI - PubMed

Publication types

MeSH terms