. 2018 Jun 18;45(6):681-695.e4.
doi: 10.1016/j.devcel.2018.05.027.

EMT Subtype Influences Epithelial Plasticity and Mode of Cell Migration

Affiliations

EMT Subtype Influences Epithelial Plasticity and Mode of Cell Migration

Nicole M Aiello et al. Dev Cell. .

Abstract

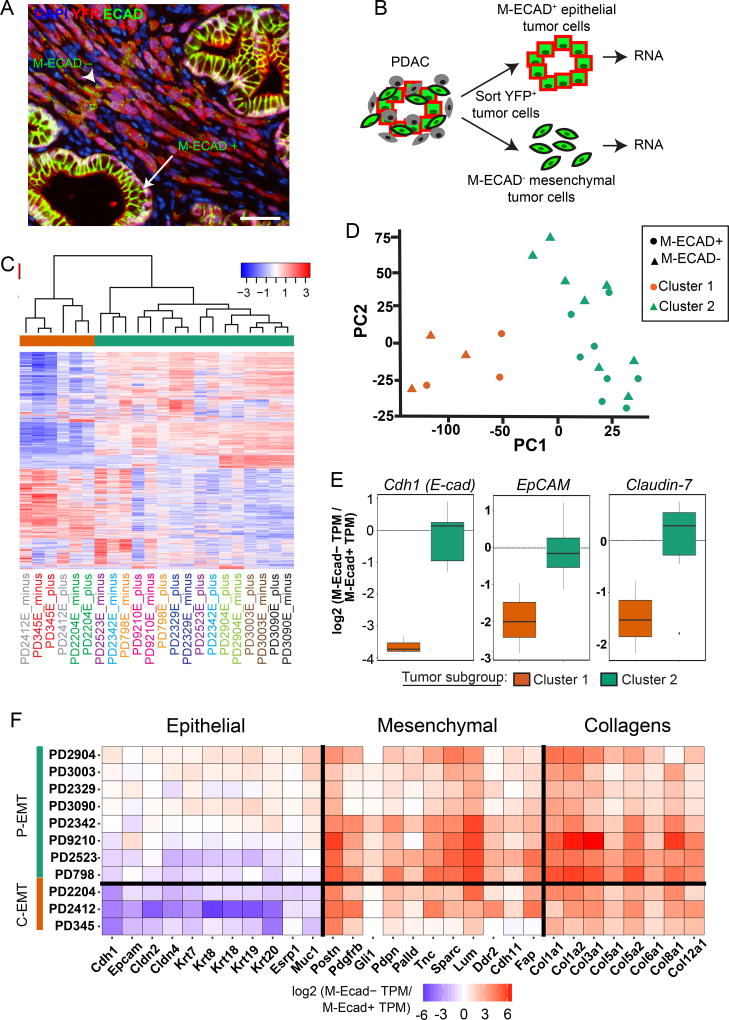
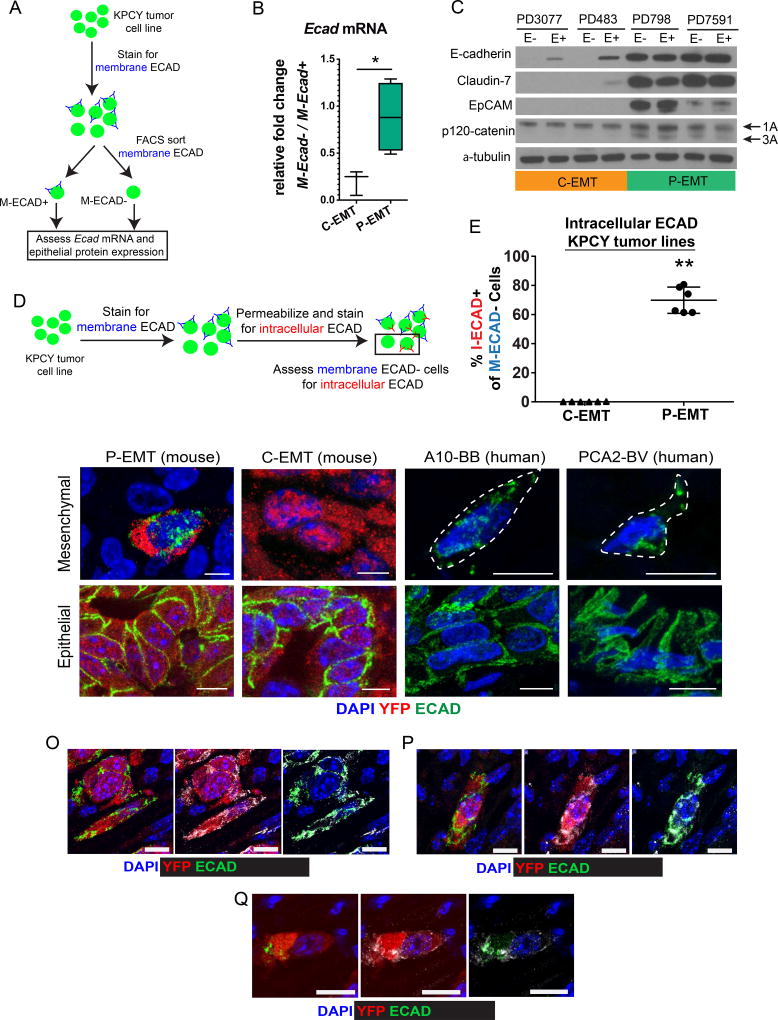
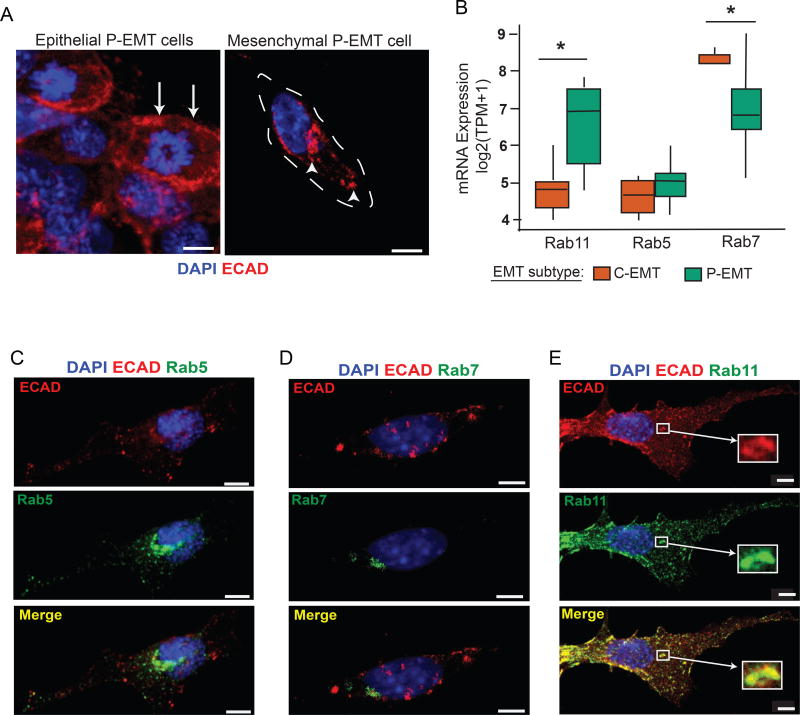
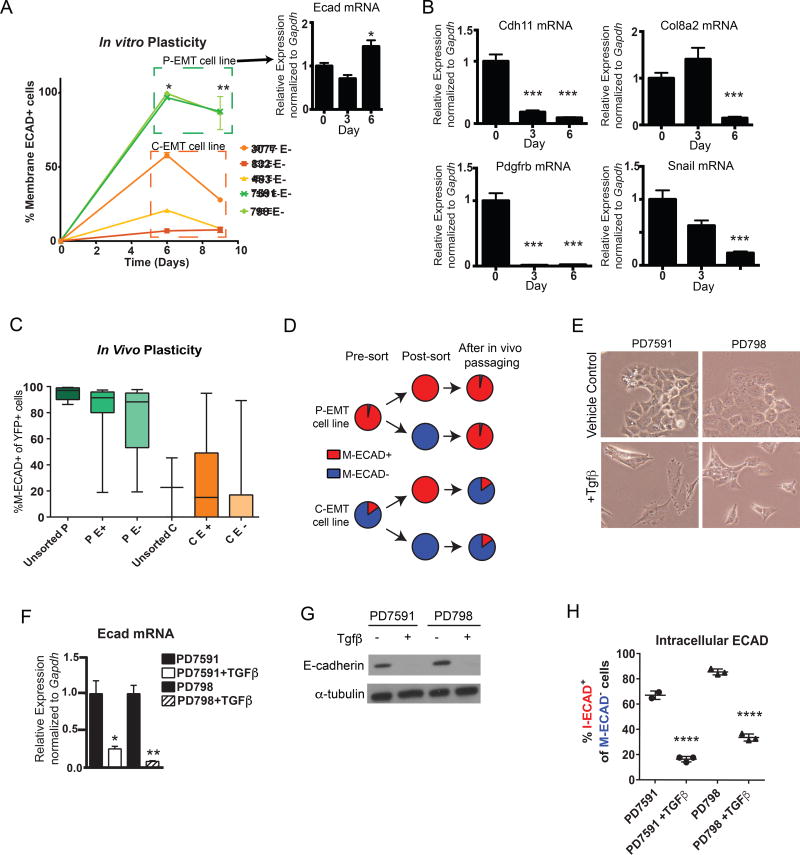
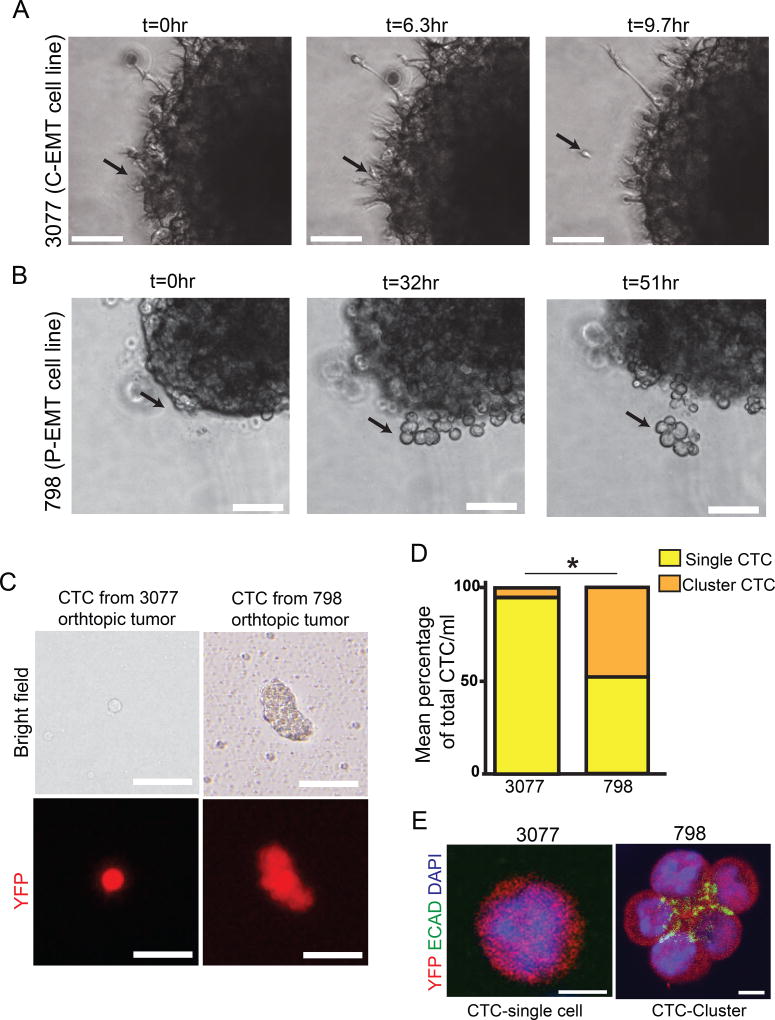
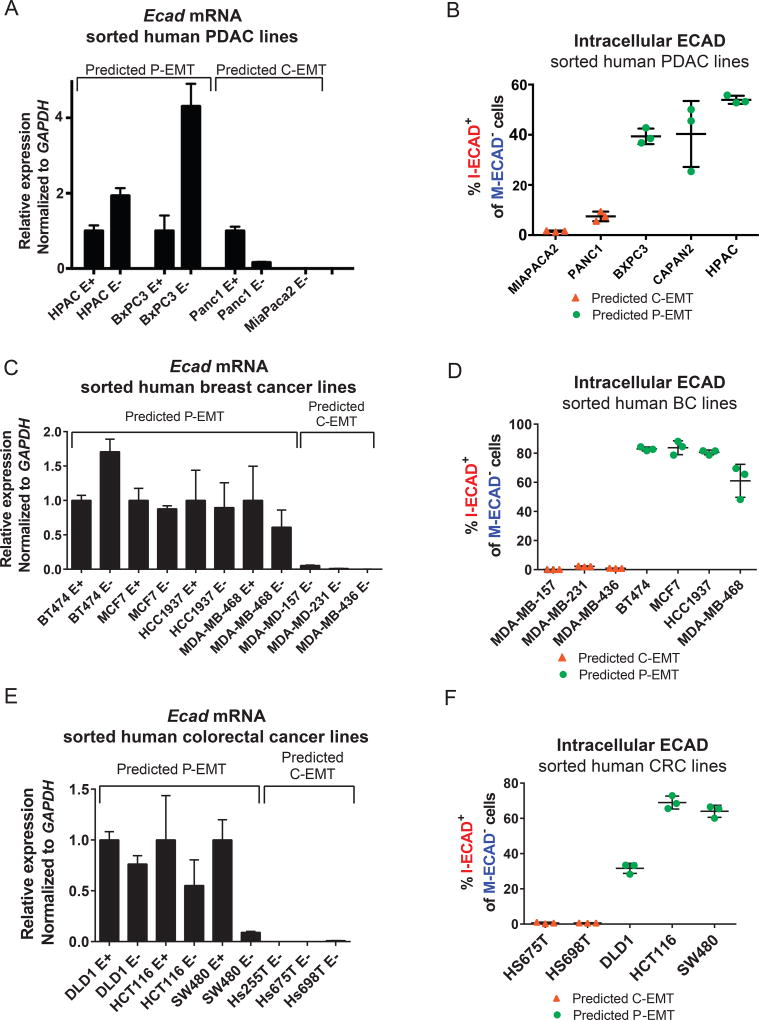
Epithelial-mesenchymal transition (EMT) is strongly implicated in tumor cell invasion and metastasis. EMT is thought to be regulated primarily at the transcriptional level through the repressive activity of EMT transcription factors. However, these classical mechanisms have been parsed out almost exclusively in vitro, leaving questions about the programs driving EMT in physiological contexts. Here, using a lineage-labeled mouse model of pancreatic ductal adenocarcinoma to study EMT in vivo, we found that most tumors lose their epithelial phenotype through an alternative program involving protein internalization rather than transcriptional repression, resulting in a "partial EMT" phenotype. Carcinoma cells utilizing this program migrate as clusters, contrasting with the single-cell migration pattern associated with traditionally defined EMT mechanisms. Moreover, many breast and colorectal cancer cell lines utilize this alternative program to undergo EMT. Collectively, these results suggest that carcinoma cells have different ways of losing their epithelial program, resulting in distinct modes of invasion and dissemination.

Keywords: E-cadherin; circulating tumor cells; collective migration; epithelial-mesenchymal transition; lineage tracing; metastasis; pancreatic cancer; partial EMT; tumor cell clusters.


Conflict of interest statement

Declaration of Interest

The authors declare no competing interests.

Figures

Figure 1
Figure 1. Two distinct EMT programs exist among KPCY tumors
(A) Representative image of a KPCY tumor (n=9 mice, 115 fields examined) stained for YFP (red) and ECAD (green) (DAPI nuclear counterstain, blue). Arrow: YFP+ tumor cells within epithelial structures that are positive for membranous ECAD (M-ECAD). Arrowhead: YFP+ tumor cells that have delaminated from epithelial structures and are negative for M-ECAD. Scale bar, 25µm (B) Strategy for isolating epithelial and mesenchymal tumor cells by fluorescence activated cell sorting. (C) Heatmap of unsupervised hierarchical clustering of expression of the 2000 most variable genes between epithelial and mesenchymal tumor cells from KPCY tumors. Tumor IDs are color-coded and listed below the heatmap, with M-ECAD+ (plus) and M-ECAD− (minus) fractions indicated. (D) Principal components of 2000 most variable genes across all samples. Shape represents M-ECAD sorting status (Triangles = M-ECAD+, Circles = M-ECAD−) and color represents clustering identity (Orange = Cluster 1, Green = Cluster 2). (E) Fold-difference in mRNA levels for Ecad, EpCAM, and Claudin-7 comparing mesenchymal (M-ECAD−) and epithelial (M-ECAD+) populations (TPM, transcripts per million) in tumors belonging to Cluster 1 (orange) or Cluster 2 (green). (F) Heatmap of expression fold change for selected epithelial, mesenchymal, and extracellular matrix collagen genes comparing mesenchymal (M-ECAD−) and epithelial (M-ECAD+) populations in tumors belonging to Cluster 1 (“C-EMT”) or Cluster 2 (“P-EMT”). See also Figures S1–S3.
Figure 2
Figure 2. P-EMT is characterized by post-transcriptional regulation of the epithelial program
(A) Strategy for assessing E-cad mRNA and protein expression from a panel of KPCY tumor cell lines. In total, 3 C-EMT and 5 P-EMT cell lines were used. (B) Aggregate data showing differences in E-cad mRNA abundance (by qPCR) comparing mesenchymal (M-ECAD−) and epithelial (M-ECAD+) cells from 8 murine PDAC cell lines classified as either C-EMT (N=3: PD6910, PD483, PD3077) or P-EMT (N=5: PD7591, PD798, PD7242, PD454, PD422). A marked decrease in E-cad mRNA in association with EMT is observed in C-EMT cell lines, while no decrease is observed in P-EMT cell lines. (C) Western blot comparing epithelial protein levels in sorted M-ECAD− (E−) and M-ECAD+ (E+) cells from 2 C-EMT and 2 P-EMT PDAC cell lines. (D) Strategy for detecting internalized E-cadherin by flow cytometry. (E) E-cadherin internalization in murine cell lines was quantified by measuring the percentage of cells negative for membranous E-cadherin (M-ECAD−) that were positive for intracellular E-cadherin (I-ECAD+). P-EMT cell lines: PD7591, PD798 (69.8% ± 9.0; mean ± SD). C-EMT cell lines: PD483, PD3077 (0.13% ± 0.1). Each cell line was assessed in triplicate. Data are representative of at least two independent experiments for each cell line. (F–I) Representative confocal 3-D projections of mesenchymal (F,G) and epithelial (H, I) tumor cells from P-EMT (F, H) and C-EMT (G, I) KPCY tumors. Sections were stained for YFP (red) and ECAD (green) (DAPI nuclear counterstain, blue). (J–M) Representative confocal 3-D projections of mesenchymal (J, K) and epithelial (L, M) tumor cells from two human primary PDAC tumors. Sections were stained for ECAD (green) (DAPI nuclear counterstain, blue). Mesenchymal tumor cells are outlined for clarity. (O–Q) Representative confocal 3-D projections of mesenchymal tumor cells from P-EMT KPCY tumors stained for ECAD (green), YFP (red), and additional epithelial proteins (grey) β-catenin (O), Claudin-7 (P), and EpCAM (Q). Bar graph data are presented as mean ± standard deviation (SD) in this and subsequent figures. Scale bars, 10µm. Statistical differences were identified by Student’s t-test in this and all subsequent figures unless otherwise noted (*, p<0.05; **, p<0.0001).
Figure 3
Figure 3. Intracellular ECAD co-localizes with Rab11+ late recycling vesicles
(A) Representative confocal images of cultured cells from a P-EMT cell line showing a colony of cells with epithelial features (left) and a delaminated spindle shaped mesenchymal cell (right) stained with ECAD and DAPI. Arrows show membranous ECAD staining pattern in epithelial cells while arrowheads show punctate cytoplasmic staining pattern in mesenchymal cells (B) Relative mRNA expression of Rab11 (marker of late recycling vesicles), Rab5 (marker of early endosomes), and Rab7 (marker of late endosomes targeted for lysosomal degradation) in P-EMT tumors from Figure 1. (C–E) Co-immunofluorescent staining of mesenchymal P-EMT cells (as depicted in (A)) with ECAD and Rab5, Rab7, or Rab11. Images representative of data from 20 different cells for each experiment. Mean Pearson’s correlation coefficients of colocalization are 0.18, 0.19, and 0.70 for Rab5, Rab7, and Rab11, respectively. (*, p<0.05) See also Figures S4–S6.
Figure 4
Figure 4. Features of epithelial plasticity in C-EMT and P-EMT subtypes
(A) Kinetics of mesenchymal-to-epithelial transition (MET) in vitro. ECAD negative cells (>99% purity) were sorted from P-EMT (7591 and 798) and C-EMT (3077, 483, 832) cell lines and cultured for 9 days in standard conditions. At day 6, P-EMT and C-EMT cells were 98.07% ± 1.98 (mean ± SD) and 28.49% ± 26.40 M-ECAD+ respectively. At day 9, P-EMT and C-EMT cells were 86.75% ± 0.73 and 14.61% ± 11.38 M-ECAD+ respectively. Baseline percentage of M-ECAD+ cells prior to sorting for 7591, 798, 3077, 483, and 832 are 97%, 90%, 47%, 12%, and 6% respectively. Insert in A demonstrates stable Ecad mRNA expression in the sorted P-EMT cells from day 0 to 6. Data representative of two independent experiments with cell lines assessed in triplicate. (B) Mesenchymal gene expression changes during recovery of the epithelial phenotype in P-EMT cells. qPCR for mesenchymal markers Cdh11, Col8a2, Pdgfrβ, and Snail was measured in sorted M-ECAD− P-EMT cells during 6 days of culture in standard conditions. (C) Quantification of M-ECAD-expressing YFP+ cells in tumors generated from unsorted and M-ECAD-sorted KPCY tumor cell lines. C- and P-EMT cell lines were sorted based on membrane ECAD (>99% purity of M-ECAD+ or M-ECAD−) and 1 × 10⁴ cells were injected subcutaneously into NOD.SCID mice. The resulting tumors (harvested when tumors reached 1 cm diameter) were assessed for ECAD expression in YFP+ tumor cells by immunofluorescence staining and manual quantification. Data are pooled (mean ± SD) from 5 P-EMT cell lines (PD7591, PD454, PD798, PD7242, PD883) and 3 C-EMT lines (PD6910, PD483, PD3077). Unsorted P, 95.0% ± 5.3; P E+, 80.5% ± 25.3; P E−, 76.0% ± 24.5; unsorted C, 22.7% ± 32.0; C E+, 26.7% ± 33.7; C E−, 15.4% ± 13.8. (D) Schematic summarizing the experimental design and results from (B) (E) Representative phase-contrast images of P-EMT KPCY tumor cell lines ± TGFβ treatment (10 ng/mL, 5 days). (F) qPCR for E-cad mRNA with TGFβ treatment or vehicle-only control (10 ng/mL, 5 days) in P-EMT KPCY tumor cell lines. (G) Western blot for ECAD protein ± TGFβ treatment in P-EMT KPCY tumor cell lines. (H) Quantification of M-ECAD−, I-ECAD+ cells ± TGFβ treatment by flow cytometry. PD7591, 67.1% ± 3.3; PD7591 + TGFβ, 16.5% ± 2.1; PD798, 85.6% ± 2.3; PD798 + TGFβ, 33.8% ± 2.8. All data are representative of two or more independent experiments. *, p<0.05; **, p<0.01; ***, p<0.005; ****, p<0.001
Figure 5
Figure 5. EMT subtypes exhibit distinct modes of cell migration and dissemination
(A) Time-lapse DIC microscopy of P-EMT 798 cells embedded in matrigel. Collectively migrating cells emerge from primary tumor sphere. Representative of n=15 tumor spheres from 2 independent experiments (B) Time-lapse DIC microscopy of C-EMT 3077 cells embedded in matrigel. Collectively migrating cells emerge from primary tumor sphere. Representative of n=18 tumor spheres from 2 independent experiments (C) Representative bright field and fluorescent images of CTCs detected in the blood stream of NOD.SCID mice following orthotopic injection of P-EMT 798 or C-EMT 3077 cells. Data representative of n=3 NOD.SCID mice per condition (D) Comparing percentage of single and cluster CTCs/ml between P-EMT 798 or C-EMT 3077 orthotopic injections in (C). N=5 NOD.SCID mice from two independent experiments. (E) Single CTC and cluster CTCs from blood of 3077 and 798 orthotopic mice respectively. CTCs are stained for YFP (red), ECAD (green) and DAPI (blue). Scale bars 100µm for A and B, 25µm for (C), and 10µm for (E). *, p<0.005. See also Movies S1–S2.
Figure 6
Figure 6. Distinct EMT subtypes occur in human pancreas, breast, and colorectal cancer cell lines
(A, C, E) Relative Ecad mRNA expression in human PDAC (A), breast cancer (C), and colorectal cancer (E) cell lines sorted on membranous E-cadherin. (B, D, F) Quantification of M-ECAD−, I-ECAD+ cells within human PDAC (B), breast (D) and colorectal (F) cancer cell lines. BXPC3, 39.37 ± 3.1% 3 (mean ± SD), CAPAN2, 40.33 ± 13.1%, HPAC, 53.93 ± 1.629%, PANC1, 7.47 ± 1.9%, MIAPACA2, 1.567 ± 0.24%. MDA-MB-157, 0.12% ± 0.03; MDA-MB-231, 2.3% ± 0.30; MDA-MB-436, 0.93% ± 0.09%; BT747, 83.0 ± 1.3%; MCF7, 83.8 ± 4.7%; HCC1937, 80.6% ± 1.6; MDA-MB-468, 61.1% ± 11.3; HS675T, 0.6% ± 0.5; HS698T, 0.7% ± 0.1; DLD1, 31.6% ± 2.9; HCT116, 69.0% ± 3.7; SW480, 64.0% ± 3.4. Each cell line was assessed in triplicate. Lines represent mean ± SD. Data are representative of at least two independent experiments for each cell line. See also Figure S7.

Comment in

Similar articles

Cited by

References

    1. Aceto N, Bardia A, Miyamoto DT, Donaldson MC, Wittner BS, Spencer JA, Yu M, Pely A, Engstrom A, Zhu H, et al. Circulating tumor cell clusters are oligoclonal precursors of breast cancer metastasis. Cell. 2014;158:1110–1122. - PMC - PubMed
    1. Anastassiou D, Rumjantseva V, Cheng W, Huang J, Canoll PD, Yamashiro DJ, Kandel JJ. Human cancer cells express Slug-based epithelial-mesenchymal transition gene expression signature obtained in vivo. BMC Cancer. 2011;11:529. - PMC - PubMed
    1. Anders S, Pyl PT, Huber W. HTSeq--a Python framework to work with high-throughput sequencing data. Bioinformatics. 2015;31:166–169. - PMC - PubMed
    1. Bailey JM, Alsina J, Rasheed ZA, McAllister FM, Fu YY, Plentz R, Zhang H, Pasricha PJ, Bardeesy N, Matsui W, et al. DCLK1 marks a morphologically distinct subpopulation of cells with stem cell properties in preinvasive pancreatic cancer. Gastroenterology. 2014;146:245–256. - PMC - PubMed
    1. Bailey JM, Hendley AM, Lafaro KJ, Pruski MA, Jones NC, Alsina J, Younes M, Maitra A, McAllister F, Iacobuzio-Donahue CA, et al. p53 mutations cooperate with oncogenic Kras to promote adenocarcinoma from pancreatic ductal cells. Oncogene. 2016a;35:4282–4288. - PubMed

Publication types