. 2018 Jun 18;45(6):696-711.e8.
doi: 10.1016/j.devcel.2018.05.025.

Regulation of Epithelial Plasticity Determines Metastatic Organotropism in Pancreatic Cancer

Affiliations

Regulation of Epithelial Plasticity Determines Metastatic Organotropism in Pancreatic Cancer

Maximilian Reichert et al. Dev Cell. .

Abstract

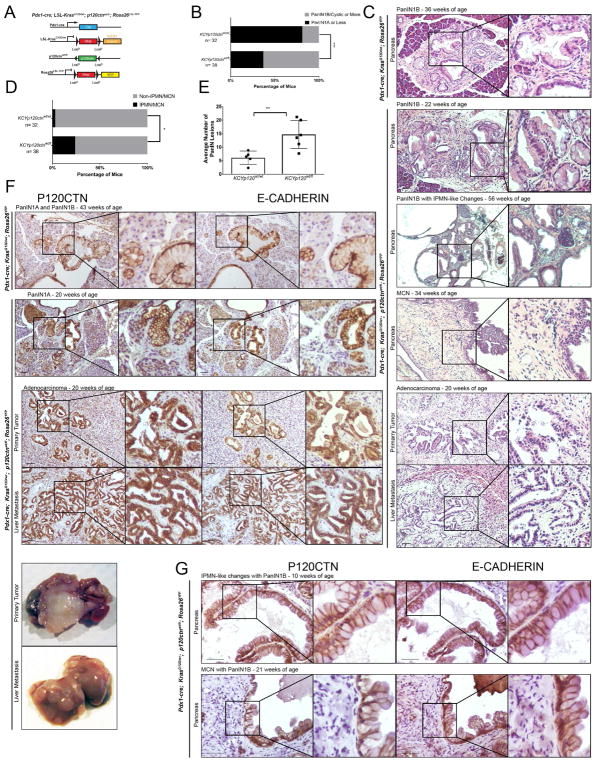
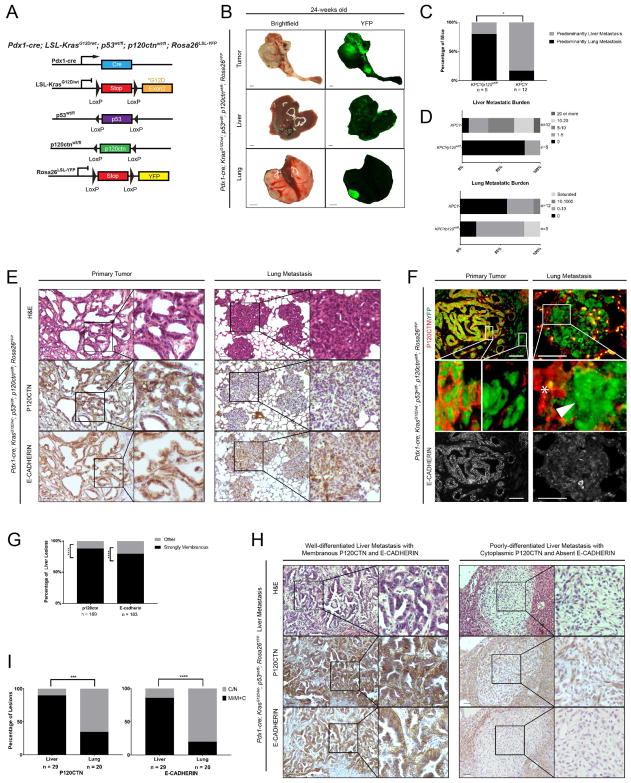
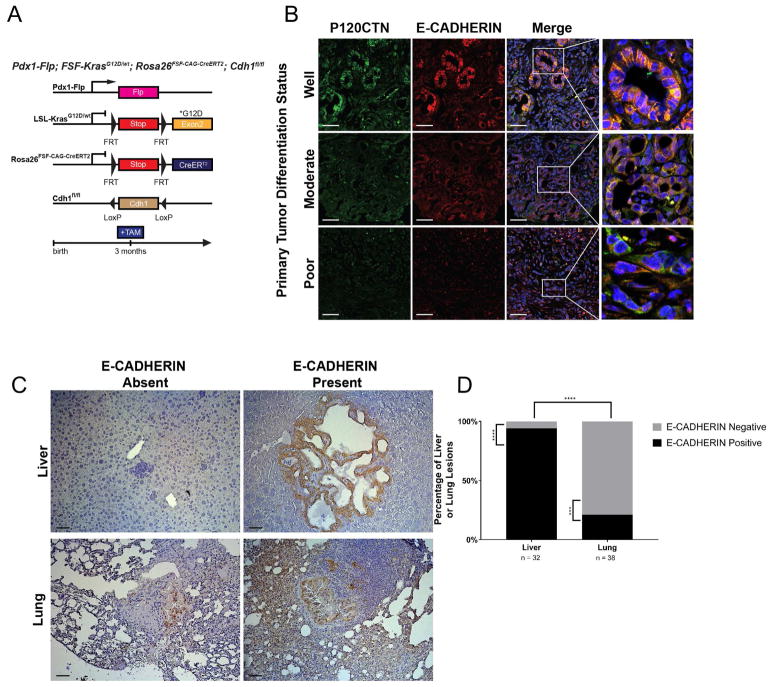
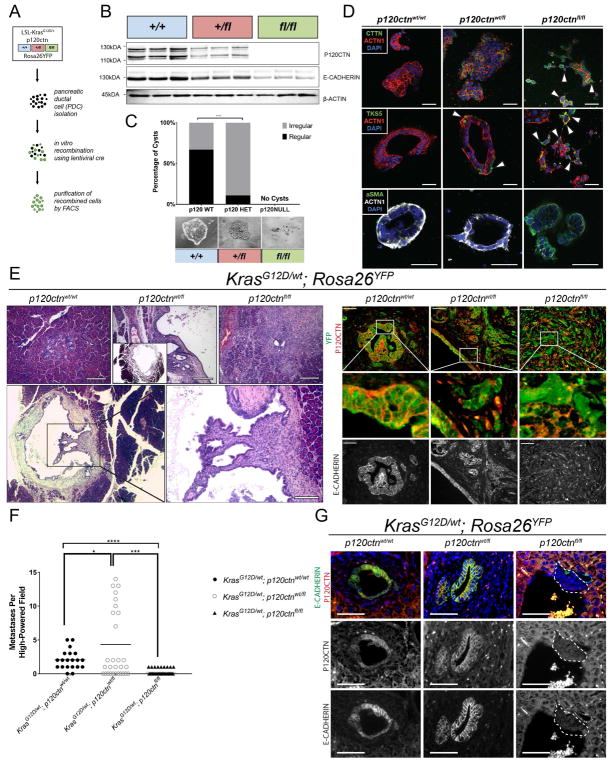
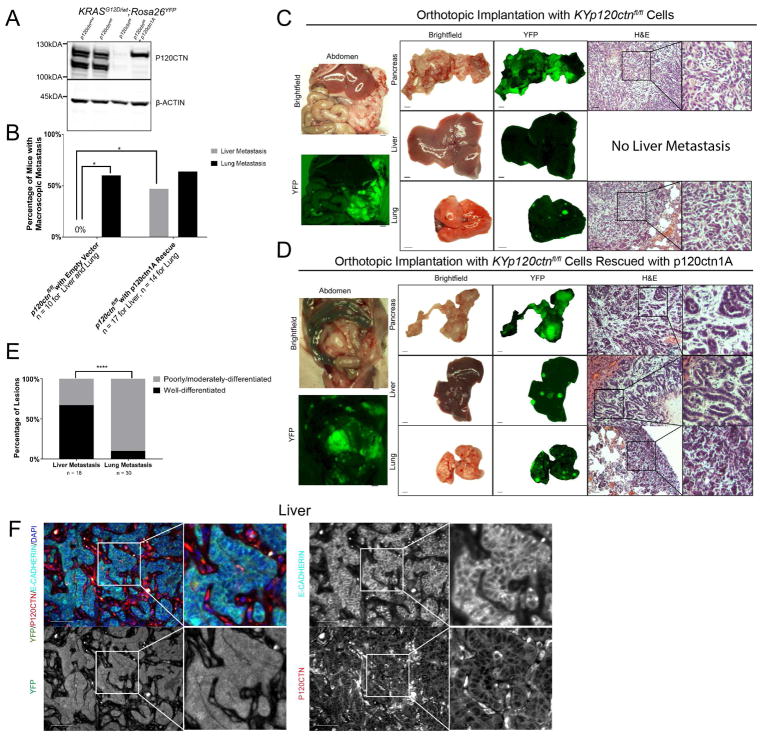
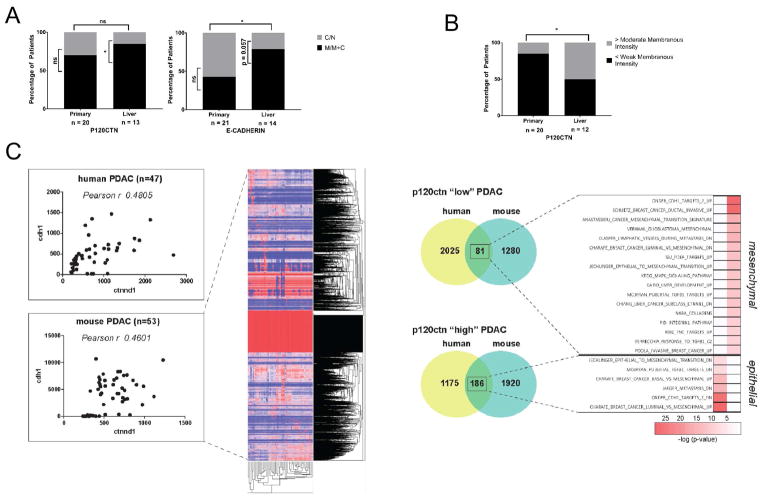
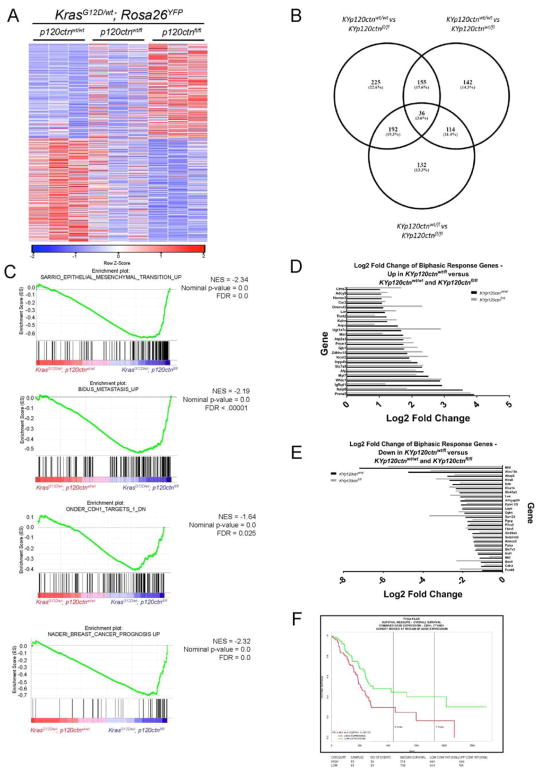
The regulation of metastatic organotropism in pancreatic ductal a denocarcinoma (PDAC) remains poorly understood. We demonstrate, using multiple mouse models, that liver and lung metastatic organotropism is dependent upon p120catenin (p120ctn)-mediated epithelial identity. Mono-allelic p120ctn loss accelerates KrasG12D-driven pancreatic cancer formation and liver metastasis. Importantly, one p120ctn allele is sufficient for E-CADHERIN-mediated cell adhesion. By contrast, cells with bi-allelic p120ctn loss demonstrate marked lung organotropism; however, rescue with p120ctn isoform 1A restores liver metastasis. In a p120ctn-independent PDAC model, mosaic loss of E-CADHERIN expression reveals selective pressure for E-CADHERIN-positive liver metastasis and E-CADHERIN-negative lung metastasis. Furthermore, human PDAC and liver metastases support the premise that liver metastases exhibit predominantly epithelial characteristics. RNA-seq demonstrates differential induction of pathways associated with metastasis and epithelial-to-mesenchymal transition in p120ctn-deficient versus p120ctn-wild-type cells. Taken together, P120CTN and E-CADHERIN mediated epithelial plasticity is an addition to the conceptual framework underlying metastatic organotropism in pancreatic cancer.

Keywords: E-cadherin; epithelial plasticity; metastasis; organotropism; p120catenin; p120catenin isoform; pancreatic cancer.


Conflict of interest statement

Declaration of Interests

The authors declare no competing interests.

Figures

Figure 1
Figure 1. Monoallelic p120ctn loss in a KrasG12D background leads to accelerated pancreatic pathology
A. Genetic schematic of Pdx1-cre; KrasG12D/wt; p120ctnwt/fl; Rosa26YFP (KCYp120wt/fl) mice. B. A comparison of PanIN, IPMN, and MCN lesion development in KCY and KCYp120wt/fl mice. From 32 KCY mice aged between 3 weeks and one year, 26 exhibited lesions equal to or less severe than PanIN1As, while 6 exhibited more severe lesions. In an age-matched cohort of 38 KCYp120wt/fl mice, 14 exhibited lesions less or equal to PanIN1As, while 24 harbored PanIN1B, PDAC, IPMN, or MCN lesions. Fisher’s Exact Test. C. Representative pathology from KCY and KCYp120wt/fl mice. D. When only IPMN or MCN lesions (with or without concomitant PanIN lesion presence) are considered, 1 out of 32 KCY mice harbored an IPMN/MCN-like lesion, while 9 KCYp120wt/fl mice harbored such lesions. Fisher’s Exact Test. E. Three high-powered fields (10X) across a cohort of age-matched mice (n = 5 KCY, n = 6 KCYp120wt/fl) were quantified by two independent observers for the number of PanIN lesions. KCYp120wt/fl mice harbored more than two times as many PanIN lesions than KCY mice (14.67 ± 4.71 vs 6.1 ± 2.15, mean ± SD). Unpaired t-test. F. Membranous P120CTN and E-CADHERIN expression are present at all stages of disease: PanINs in KCY mice and PanINs, PDAC, and liver metastasis in KCYp120wt/fl mice. G. IPMN and MCN lesions also display membranous P120CTN and E-CADHERIN. 50 μm scale bar. *, p < .05, ** < .01, *** < .001. See Supplemental Figures 1 and 2 and Supplemental Tables 1 and 2.
Figure 2
Figure 2. Monoallelic p120ctn loss in a KrasG12D; p53wt/fl background leads to a metastatic shift characterized by P120CTN-deficient lung lesions
A. Genetic schematic of Pdx1-cre; KrasG12D/wt; p53wt/fl; p120ctnwt/fl; Rosa26YFP (KPCYp120ctnwt/fl) mice. B. Gross brightfield and YFP images of primary PDAC, liver, and lung from a KPCYp120ctnwt/fl mice. C. One slide of liver and lung each from KPCYp120wt/fl (n = 5) and KPCY (n = 12) mice was quantified at 10X magnification. Each mouse was assigned to either lung or liver dominant category. One mouse of each genotype, which had a single lesion in both liver and lung, was excluded. Mice with no tumor burden in either organ were excluded. Fisher’s Exact Test. D. Stratification of mice by the burden of tumor metastasis shows an increase in lung metastasis and diminution of liver metastasis in KPCYp120ctnwt/fl versus KPCY mice. E. Primary tumors and lung metastasis from KPCYp120ctnwt/fl mice show retention of membranous P120CTN and E-CADHERIN staining at the primary site but loss in the lungs. F. Immunofluorescence of primary and lung metastasis in KPCYp120ctnwt/fl mice reveals absent P120CTN (red) in YFP-positive (green) lung metastasis with retained E-CADHERIN (lower panel) in P120CTN-positive primary tumor areas and absent in lung metastasis. P120CTN-deficient lung metastasis (arrowhead) is surrounded by P120CTN-positive lung tissue (star). G. Quantification of P120CTN (n = 169) and E-CADHERIN (n = 183) localization in KPCY liver metastasis (n = 14 mice), which were analyzed by two independent observers. Binomial test. H. Examples from KPCY mice of a well-differentiated liver lesion with strongly membranous P120CTN/E-CADHERIN and a poorly-differentiated liver lesion with cytoplasmic P120CTN and absent E-CADHERIN. 1 mm scale bar for gross pathology. I. Quantification of P120CTN and E-CADHERIN localization in liver and lung metastases (n = 29 for liver, n = 20 for lung) (n = 4 mice) in a tet-on, Elastase KRASG12V PDAC model was done by two independent observers. Fisher’s Exact Test. *p < .05, **p < .01, ***p < .001, ****p < .0001. 50 μm scale bar for histology. See Supplemental Figure 3 and Supplemental Tables 3 and 4.
Figure 3
Figure 3. Sequential and mosaic Cdh1 deletion in a KrasG12D background demonstrates selective pressure for E-CADHERIN-positive liver metastasis and E-CADHERIN-deficient lung metastasis
A. Genetic schematic of the Pdx1-Flp;FSF-KrasG12D/wt;FSF-R26GAG-CreERT2;CDH1fl/fl mouse. This dual-recombinase system allows FLP recombinase-mediated recombination of the FRT sites at the KRASG12D/wt and Rosa26YFP loci as well as independent manipulation of CDH1 through tamoxifen-mediated induction of CreERT2. B. Examples of well-, moderately-, and poorly-differentiated tumor regions in Pdx1-Flp;FSF-KrasG12D/wt;FSF-R26GAG-CreERT2;CDH1fl/fl mice. Tumors show strong correlation between membranous co-localization of P120CTN and E-CADHERIN. These areas, in turns, are more highly differentiated. C. Immunohistochemistry of representative metastatic lesions in liver and lung by E-CADHERIN status. D. Liver (n = 32) and lung (n = 38) metastatic lesions, quantified across 5 mice, were classified by E-CADHERIN status. Liver metastases showed a strong predisposition towards E-CAHDERIN-positivity (n = 30/32), whereas lung metastases showed a strong predisposition towards E-CADHERIN-negativity (n = 30/38). Comparison between liver and lung showed a statistically significant switch in E-CADHERIN status. Binomial test for comparisons within each organ. Fisher’s Exact Test for comparison between organs. 50 μm scale bar.
Figure 4
Figure 4. A single allele of p120ctn is sufficient to stabilize E-CADHERIN and to colonize the liver
A. Ex-vivo recombination of KrasG12D/wt; Rosa26YFP (KY) cells with either wild-type p120ctn or mono-/bi-allelic loss. B. Confirmation of efficiency of recombination with ex-vivo cre in three replicates per genotype. C. 3D organotypic culture demonstrates that normal cyst formation is dependent on P120CTN. Cells were plated in chamber slides in quadruplicate in bovine collagen. Cyst formation was quantified 5 days later. KYp120ctnwt/wt cells formed normal cysts a majority of the time (94 regular versus 47 irregular), whereas KYp120ctnwt/fl cells showed dramatically impaired regular cystogenesis (9 regular versus 70 irregular). KYp120ctnfl/fl cells formed no cysts in 4 technical replicates. Fisher’s Exact Test. D. 3D organotypic cultures were stained for Tks5, cortactin (CTTN), α-smooth muscle actin (α-SMA), actin (ACTN1), and DAPI. Arrowheads indicates protrusions reminiscent of invadopodia. E. Nude athymic mice were orthotopically injected with 500,000 cells and harvested three weeks post-injection (n = 3 per genotype). H&E on the left and immunofluorescence (P120CTN in red, YFP in green, E-CADHERIN lower panel]. F. Athymic nude mice were injected with 750,000 cells and harvested two weeks post-injection. Ten high power fields were analyzed per mouse (n = 2 wildtype, n = 3 heterozygous/null). Welch’s T-test. G. Immunofluorescence of liver metastasis in intraportal vein injection model. (P120CTN in red, E-CADHERIN in green]. 50 μm scale bar. See Supplemental Figure 4.
Figure 5
Figure 5. KrasG12D; p120ctnfl/fl; Rosa26YFP (KYp120ctnfl/fl) cells readily colonize the lung, but not the liver, unless rescued with p120ctn1A isoform
A. Western blot demonstrates p120ctn1A restoration in KYp120ctnfl/fl cells. B. Nude mice orthotopically injected with 500,000 KYp120ctnfl/fl cells (n = 10) show lung (n = 6/10), but not liver (n = 0/10), metastasis. p120ctn1A rescue (n = 17) restores liver metastasis (n = 8/17) to the liver while still permitting lung metastasis (n = 9/14 [3 lungs excluded from this analysis due to lack of gross fluorescence images]). Fisher’s Exact Test. C and D. Representative gross pathology and histology from nude mice orthotopically injected with KYp120ctnfl/fl cells stably transfected with an empty vector (C) or p120ctn1A-expressing vector (D) and aged out for up to 102 days post-injection. The examples represented here were aged for 70- (D) and 98-days (E) post-implantation. E. 18 liver and 30 lung metastatic lesions in mice injected with p120ctn1A-rescue cells were classified as either well-differentiated or moderately/poorly-differentiated on the basis of the presence or absence of ductal structures. 12/18 liver lesions were well-differentiated compared to only 3/30 lung lesions classified as well-differentiated. Fisher’s Exact Test. F. Immunofluorescence for P120CTN, E-CADHERIN, and YFP in p120ctn1A-rescued liver metastasis. 1 mm scale bar for gross pathology. 50 μm scale bar for histology. *p < .05, ****p < .0001. See Supplemental Figure 5 and Supplemental Tables 5 and 6.
Figure 6
Figure 6. P120CTN and E-CADHERIN expression in human PDAC
A. Primary PDAC (n = 20 for P120CTN, n = 21 for E-CADHERIN) and paired liver metastases (n = 13 for P120CTN, n = 14 for E-CADHERIN) were analyzed for localization patterns. Whereas 9/21 primary tumors demonstrated M or M+C E-CADHERIN, 11/14 liver metastases demonstrated M or M+C staining. Fisher’s Exact Test for comparison between organs. Binomial Test for comparison within organs. B. Comparison of P120CTN staining intensity between primary PDAC and liver metastases. Whereas 17/20 primary tumors showed, at most, weak membranous staining, 6/12 liver metastases showed moderate staining or higher. Fisher’s Exact Test for comparison between organs. Binomial Test for comparison within organs. C.Correlation of P120CTN (CTNND1) and E-CADHERIN (CDH1) expression in human PDAC (n=47) (www.broadinstitute.org) (Pearson r = 0.4805). Correlation of p120ctn (Ctnnd1) and E-cadherin (Cdh1) expression in murine PDAC (n=53) (Pearson r = 0.4601). Gene expression profiles were divided according to p120ctn expression levels. Genes associated with a p120 high status (> 90 percentile) and a p120 low status (< 10 percentile) shared in human and mouse are enriched in gene sets associated with an epithelial or mesenchymal signature, respectively. Scale bar: 50 μm. *p < .05, **p < .01, ***p < .001, ****p < .0001. See Supplemental Table 7.
Figure 7
Figure 7. A single allele of p120ctn restrains EMT programs, and p120ctn and E-cadherin are negative predictors of outcomes
A. Heatmap depicting 608 significantly altered genes (P<0.05 and fold-change>2) identified through RNA-Seq analysis comparing KYp120ctnfl/wt and KYp120ctnfl/fl cells. B. There is significant overlap in differentially induced genes between comparisons of KYp120ctnwt/wt cells with KYp120ctnfl/wt and KYp120ctnfl/fl cells. C. GSEA plots EMT and metastasis pathways significantly enriched in KYp120ctnfl/fl cells compared to either KYp120ctnwt/wt or KYp120ctnfl/wt cells. Note that mono-allelic p120ctn loss restrains transcriptional programs associated with EMT. D. Genes that are significantly upregulated in KYp120ctnwt/fl cells compared to both KYp120ctnwt/wt and KYp120ctnfl/fl cells. E. Genes that are significantly downregulated in KYp120ctnwt/fl cells compared to both KYp120ctnwt/wt and KYp120ctnfl/fl cells. F. Interrogation of TCGA reveals that P120CTN and E-CADHERIN are negative predictors of outcomes together (shown) or independently (not shown). See Supplemental Figure 7.

Comment in

References

    1. Aiello, Bajor DL, Norgard RJ, Sahmoud A, Bhagwat N, Pham MN, Cornish TC, Iacobuzio-Donahue CA, Vonderheide RH, Stanger BZ. Metastatic progression is associated with dynamic changes in the local microenvironment. Nat Commun. 2016a;7:12819. - PMC - PubMed
    1. Aiello NM, Rhim AD, Stanger BZ. Orthotopic Injection of Pancreatic Cancer Cells. Cold Spring Harb Protoc. 2016b pdb.prot078360. - PubMed
    1. Aiello NM, Brabletz T, Kang Y, Nieto MA, Weinberg RA, Stanger BZ. Upholding a role for EMT in pancreatic cancer metastasis. Nature. 2017;547:E7–E8. - PMC - PubMed
    1. Aiello, et al. THIS ISSUE OF DEV CELL
    1. AmericanCancerSociety. American Cancer Society. Cancer Facts & Figures 2015. Atlanta: American Cancer Society; 2015.

Publication types

MeSH terms