. 2018 Jun 18;45(6):712-725.e6.
doi: 10.1016/j.devcel.2018.05.026.

Twist1 Activation in Muscle Progenitor Cells Causes Muscle Loss Akin to Cancer Cachexia

Affiliations

Twist1 Activation in Muscle Progenitor Cells Causes Muscle Loss Akin to Cancer Cachexia

Parash Parajuli et al. Dev Cell. .

Abstract

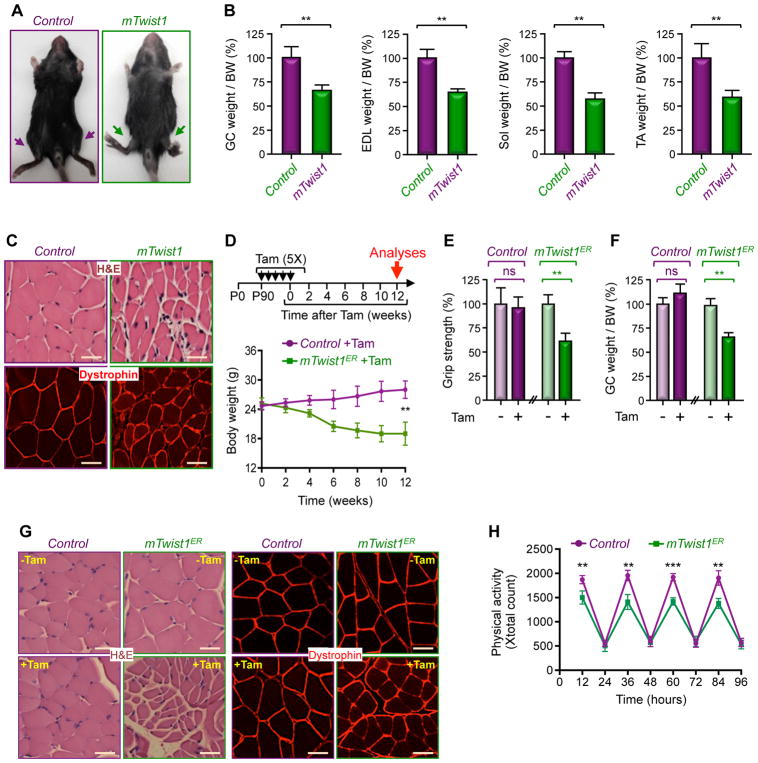
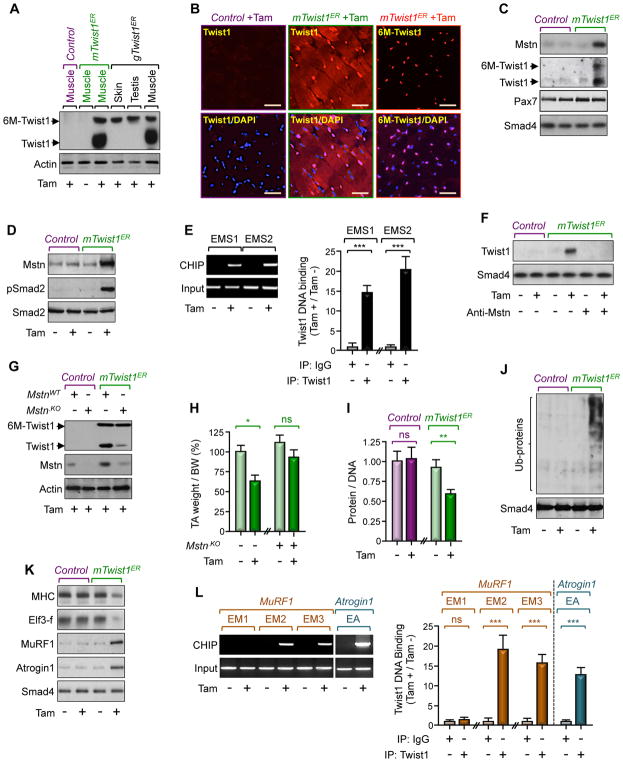
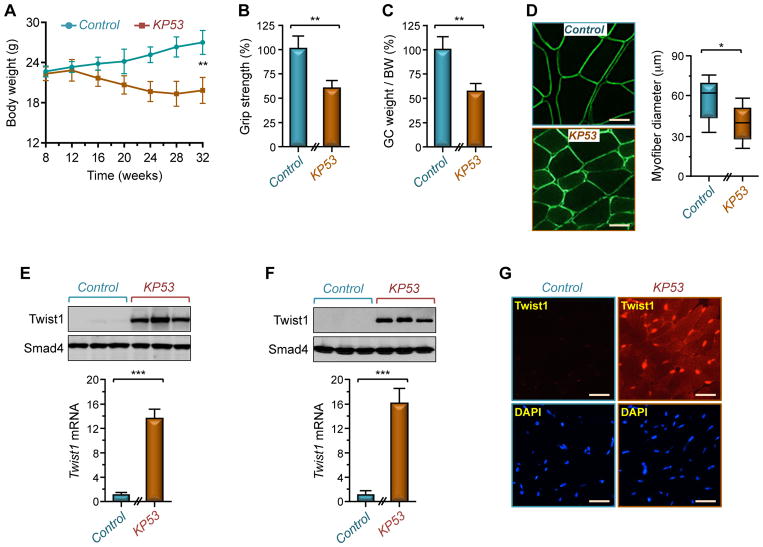
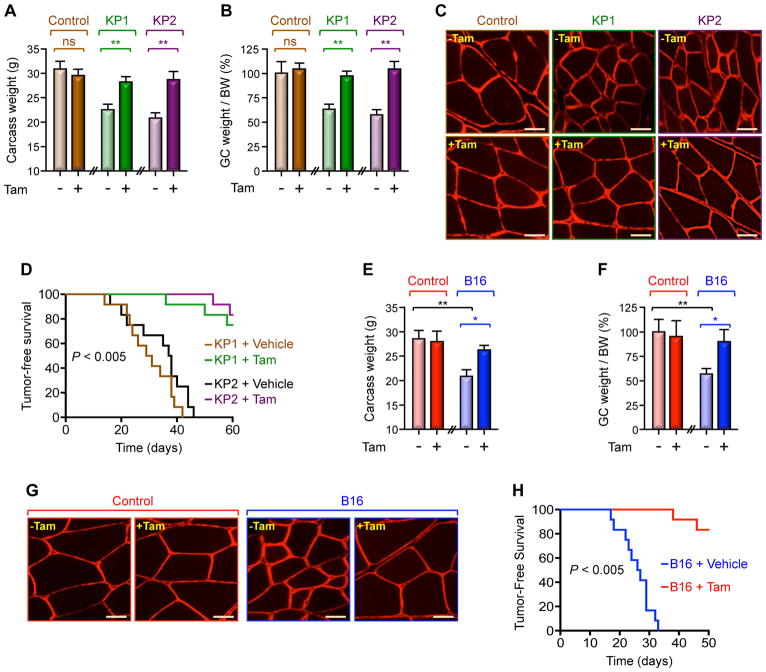
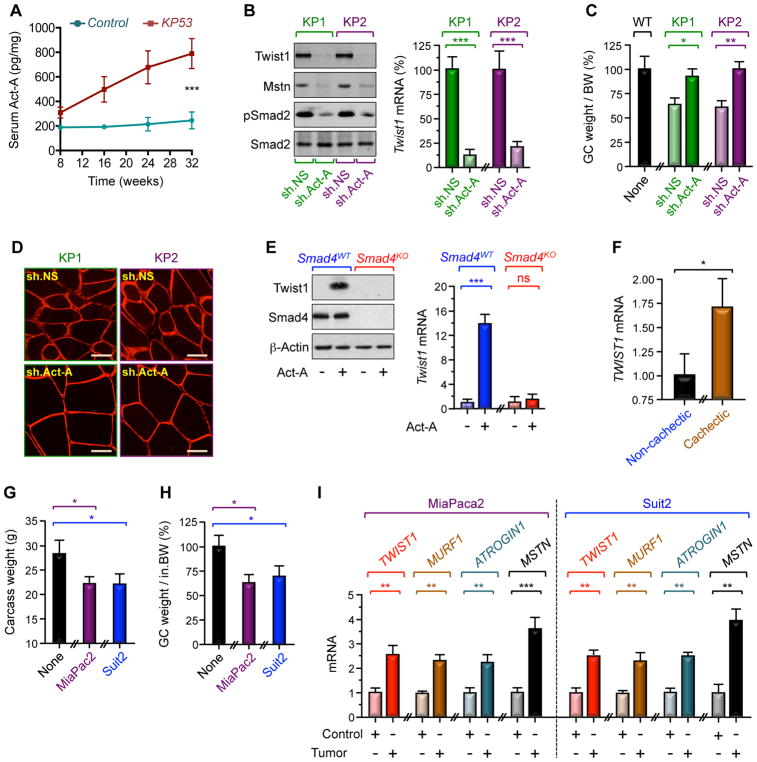
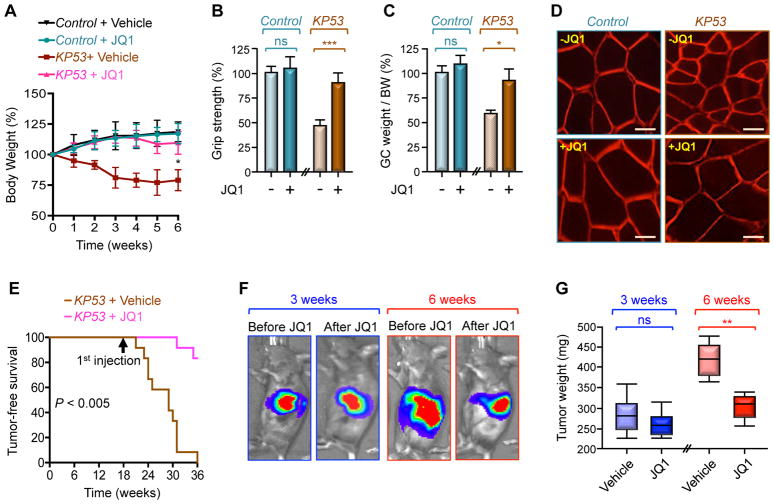
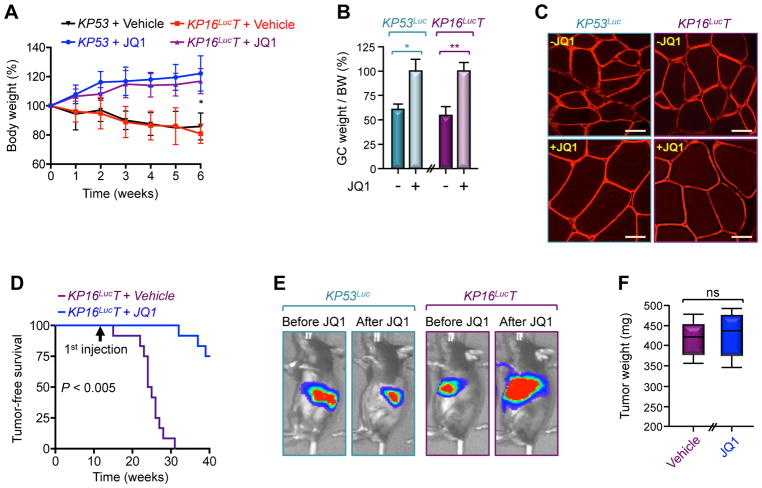
Cancer cachexia is characterized by extreme skeletal muscle loss that results in high morbidity and mortality. The incidence of cachexia varies among tumor types, being lowest in sarcomas, whereas 90% of pancreatic ductal adenocarcinoma (PDAC) patients experience severe weight loss. How these tumors trigger muscle depletion is still unfolding. Serendipitously, we found that overexpression of Twist1 in mouse muscle progenitor cells, either constitutively during development or inducibly in adult animals, caused severe muscle atrophy with features reminiscent of cachexia. Using several genetic mouse models of PDAC, we detected a marked increase in Twist1 expression in muscle undergoing cachexia. In cancer patients, elevated levels of Twist1 are associated with greater degrees of muscle wasting. Finally, both genetic and pharmacological inactivation of Twist1 in muscle progenitor cells afforded substantial protection against cancer-mediated cachexia, which translated into meaningful survival benefits, implicating Twist1 as a possible target for attenuating muscle cachexia in cancer patients.

Keywords: Activin/Myostatin cytokines; Smad signaling; Twist1; cancer cachexia; muscle cachexia; muscle progenitor cells; muscle protein breakdown; pancreatic ductal adenocarcinoma.


Conflict of interest statement

DECLARATION OF INTERESTS

The authors declare no competing interests.

Figures

Figure 1
Figure 1. Twist1 Overexpression Drives Muscle Atrophy
(A) Representative pictures of two-month-old mTwist1 and control mice. (B) The weights of GC, EDL, Sol, and TA muscles from two-month-old mTwist1 and control mice were normalized by body weight (BW) (n= 6). (C) Analysis of GC muscle cross-sectional areas in two-month-old mTwist1 and control mice by H&E staining or dystrophin immunostaining. Scale bars: 50 μM. (D–H) Three-month-old mTwist1ER or control mice were injected with vehicle or Tam as indicated (n= 12). Body weight was measured every other week (D). Grip strength (E), GC muscle weight per BW (F), and GC muscle cross-sectional areas (G) were analyzed 12 weeks following treatment. Physical activity was monitored by CLAMS beginning at 12 weeks following treatment (H). Scale bars: 50 μM. Data in B, D, E, F, and H are expressed as mean ± SEM. **p < 0.01; ***p< 0.001; ns, not significant. See also Figure S1.
Figure 2
Figure 2. Twist1 Induces Muscle Atrophy
(A and B) Three-month-old mTwist1ER, gTwist1ER, or control mice were treated with Tam and analyzed for Twist1 expression 12 weeks following treatment. Twist1 expression in hindlimb muscles, skin, or testis was analyzed by immunoblotting using anti-Twist1 antibody (A). GC muscle sections from mTwist1ER or control mice were immunostained with anti-Twist1 or anti-Myc antibody to detect endogenous Twist1 or exogenous 6xMyc-Twist1 (6M-Twist1), respectively (B). Scale bars: 50 μM. (C) Three-month-old mTwist1ER or control mice were treated with vehicle or Tam and satellite cells were isolated 12 weeks following treatment (n= 6). Expression of Mstn, Pax7, and Twist1 in isolated satellite cells was analyzed by immunoblotting. (D and E) Three-month-old mTwist1ER or control mice were treated with vehicle or Tam and muscles were analyzed 12 weeks following treatment. Mstn expression and Smad2 phosphorylation were assessed by immunoblotting (D). Twist1 bound to the Mstn promoter was analyzed by ChIP and agarose gel (E). (F) Myofibers from 3-month-old wild-type mice were cultured in conditioned media of satellite cells from 3-month-old Tam-treated mTwist1ER or control mice in the presence or absence of a neutralizing Mstn antibody. Expression of Twist1 was analyzed by immunoblotting. (G and H) Muscle of 3-month-old mTwist1ER or control mice were injected with lentiviruses encoding control or gRNA targeting Mstn and then treated with Tam (n= 6). Expression of muscle Twist1 and Mstn was analyzed by immunoblotting 12 weeks following treatment. The weight of TA muscle was normalized by BW (H). (I–L) Three-month-old mTwist1ER or control mice were treated with vehicle or Tam and muscles were analyzed 12 weeks following treatment (n= 8). The protein/DNA ratio was determined by quantifying total protein and DNA (I). Global protein ubiquitination was analyzed by immunoblotting using an anti-ubiquitin antibody (J). Expression of muscle wasting markers was analyzed by immunoblotting (K). Twist1 bound to the MuRF1 or Atrogin1 promoter was analyzed by ChIP and agarose gel (L). Data in E, H, I, and L are expressed as mean ± SEM. **p < 0.01; ***p< 0.001; ns, not significant. See also Figure S2.
Figure 3
Figure 3. PDAC Triggers Muscle Twist1 Expression
(A) Body weight of KP53 or control mice was measured every 4 weeks up to 32 weeks of age (n= 26 for control; n= 22 for KP53). (B–D) Grip strength (B), GC muscle weight per BW (C), and GC muscle cross-sectional areas (D) of KP53 and control mice were analyzed at 24 weeks of age (n= 6). Scale bars: 25 μM. (E) Muscles from KP53 or control mice were analyzed for Twist1 expression by immunoblotting and RT-PCR (n= 6). Immunblot shows expression of Twist1 in 3 representative mice. (F) Satellite cells were isolated from KP53 and control mice and analyzed for Twist1 expression by immunoblotting or RT-PCR (n= 3). (G) GC muscle sections from KP53 or control mice were analyzed for Twist1 expression by immunofluorescence (n= 6). Scale bars: 50 μM. Data in A, B, C, E, and F are expressed as mean ± SEM. *p < 0.05; **p < 0.01; ***p< 0.001. See also Figure S3.
Figure 4
Figure 4. Twist1 Mediates Cancer-Induced Muscle Cachexia
(A–D) Three-month-old mTwist1KO;ER mice were treated with vehicle or Tam and then inoculated with KP1 or KP2 cells. Carcass weight (calculated by subtracting tumor weight from the total weight) (A), GC muscle weight per BW (B), and GC muscle cross-sectional areas (C) were measured 30 day following cell inoculation (n= 6). Kaplan Meier survival analysis was conducted using 12 mice for each group. p< 0.005 by log-rank test for significance (D). Scale bars: 25 μM. (E–H) Three-month-old mTwist1KO;ER mice were treated with vehicle or Tam and then inoculated with B16 cells (n= 6). Carcass weight (E), GC weight per BW (F), and GC muscle cross-sectional areas (G) were examined 21 days following cell inoculation. Kaplan-Meier survival analysis was conducted using 12 mice for each group. p< 0.005 by log-rank test for significance (H). Scale bars: 25 μM. Data in A, B, E, and F are expressed as mean ± SEM. *p < 0.05; **p < 0.01; ns, not significant. See also Figure S4.
Figure 5
Figure 5. Tumor-Derived Act-A Induces Muscle Twist1 Expression
(A) Circulating Act-A concentrations in KP53 and control mice were assessed by ELISA (n= 22 to 26). (B–D) Three-month-old wild-type mice were inoculated with KP1 or KP2 cells stably expressing control (sh.NS) or shRNA targeting Act-A (sh.Act-A) (n= 6). Muscle Twist1 and Mstn expression and Smad2 phosphorylation (B), GC muscle weight per BW (C), and GC muscle cross-sectional areas (D) were examined 30 days following cell inoculation. Scale bars: 25 μM. (E) Primary satellite cells from Smad4fl/fl (Smad4KO) or wild-type mice were transduced with Ad.Cre (n= 6) and then treated with or without Act-A for 48 hr. Cells were then analyzed for Twist1 expression by immunoblotting and RT-PCR. (F) Skeletal muscle microbiopsies from non-cachectic (n= 19) or cachectic (n= 16) cancer patients were analyzed for TWIST1 mRNA expression by RT-PCR. (G–I) Three-month-old SCID mice were inoculated with MiaPaca2 or Suit2 cells (n= 6). Carcass weight (G), GC muscle weight per BW (H), and expression of muscle wasting markers were examined 21 days following cell inoculation. Data in A, B, C, E, F, G, H, and I are expressed as mean ± SEM. *p < 0.05; **p < 0.01; ***p< 0.001; ns, not significant. See also Figure S5.
Figure 6
Figure 6. Pharmacological Inhibition of Twist1 Suppresses Muscle Cachexia
(A–E) KP53 or control mice were treated with JQ1 for 6 weeks (n= 10 or 12). Body weight (A), grip strength (B), GC muscle weight per BW (C), and GC muscle cross-sectional areas (D) were analyzed up to 6 weeks of treatment. Kaplan Meier survival was analyzed using 12 mice per group. p< 0.005 by log-rank test for significance (E). Scale bars: 25 μM. (F and G) KP53Luc mice were treated with JQ1 for 3 or 6 weeks (n= 6). Tumor volumes in live mice were analyzed by IVIS bioluminescence (F). PDAC tumor weights were measured following 3 or 6 weeks of treatment (G). Data in A, B, and C are expressed as mean ± SEM. *p < 0.05; **p < 0.01; ***p< 0.001; ns, not significant. See also Figure S6.
Figure 7
Figure 7. Pharmacological Inhibition of Twist1 Suppresses Muscle Cachexia Without Affecting Tumor Growth
(A–D) KP53 or KP16LucT mice were treated with JQ1 for 6 weeks (n= 6 or 12). Body weight (A), GC muscle weight per BW (B), and GC muscle cross-sectional areas (C) were analyzed up to 6 weeks of treatment. Kaplan Meier survival was analyzed using 12 mice for each group (D). p< 0.005 by log-rank test for significance. Scale bars: 25 μM. (E and F) KP53Luc or KP16LucT mice were treated with JQ1 for 6 weeks (n= 6). Tumor volumes in live animals were analyzed by IVIS bioluminescence (E) and PDAC tumor weights (F) were measured following 6 weeks of treatment. Data in A and B are expressed mean ± SEM. *p< 0.05; **p< 0.01; ns, not significant. See also Figure S7.

References

    1. Burd CE, Sorrentino JA, Clark KS, Darr DB, Krishnamurthy J, Deal AM, Bardeesy N, Castrillon DH, Beach DH, Sharpless NE. Monitoring tumorigenesis and senescence in vivo with a p16(INK4a)-luciferase model. Cell. 2013;152:340–351. - PMC - PubMed
    1. Chen ZF, Behringer RR. twist is required in head mesenchyme for cranial neural tube morphogenesis. Gene Dev. 1995;9:686–699. - PubMed
    1. Cheung AF, Dupage MJ, Dong HK, Chen J, Jacks T. Regulated expression of a tumor-associated antigen reveals multiple levels of T-cell tolerance in a mouse model of lung cancer. Cancer Res. 2008;68:9459–9468. - PMC - PubMed
    1. Clarke BA, Drujan D, Willis MS, Murphy LO, Corpina RA, Burova E, Rakhilin SV, Stitt TN, Patterson C, Latres E, et al. The E3 Ligase MuRF1 degrades myosin heavy chain protein in dexamethasone-treated skeletal muscle. Cell Metab. 2007;6:376–385. - PubMed
    1. Cohen S, Nathan JA, Goldberg AL. Muscle wasting in disease: molecular mechanisms and promising therapies. Nat Rev Drug Discov. 2015;14:58–74. - PubMed

Publication types

MeSH terms