. 2018 Jun 18;45(6):753-768.e8.
doi: 10.1016/j.devcel.2018.05.022.

Dual Requirement of CHD8 for Chromatin Landscape Establishment and Histone Methyltransferase Recruitment to Promote CNS Myelination and Repair

Affiliations

Dual Requirement of CHD8 for Chromatin Landscape Establishment and Histone Methyltransferase Recruitment to Promote CNS Myelination and Repair

Chuntao Zhao et al. Dev Cell. .

Abstract

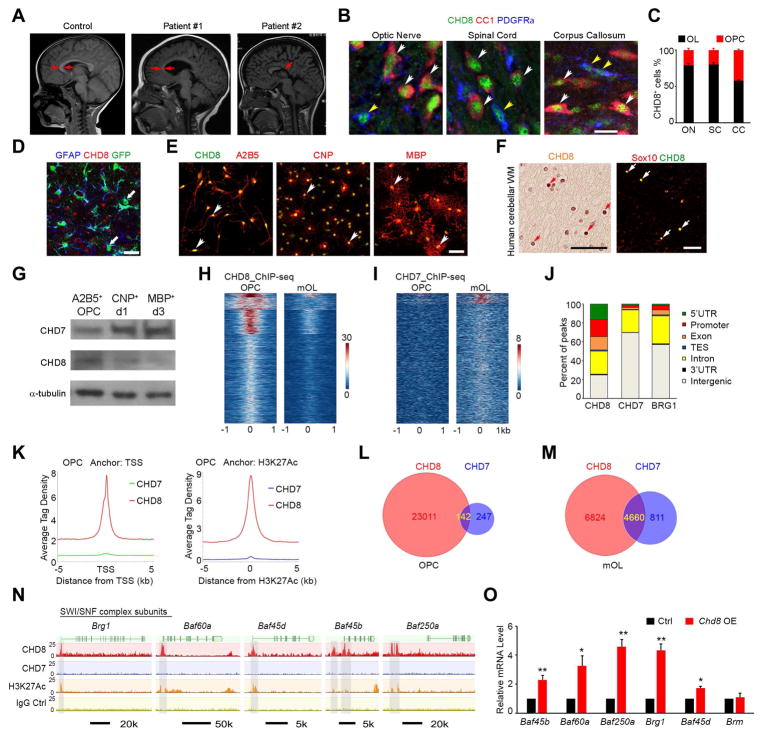
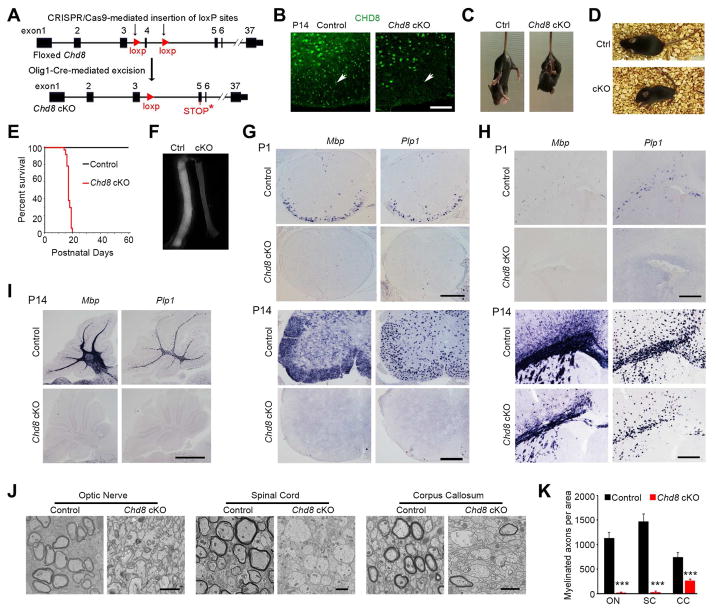
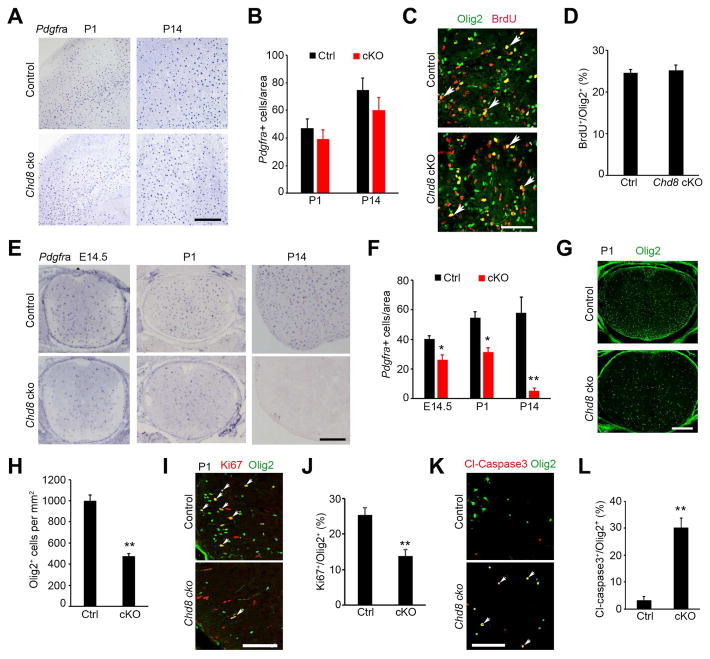
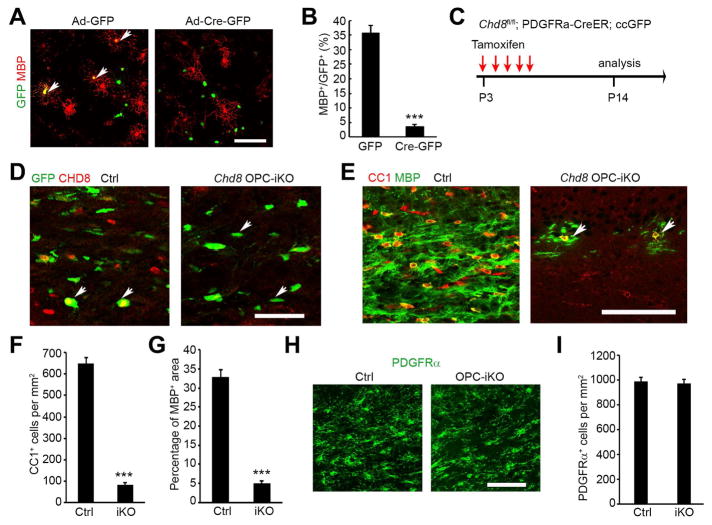
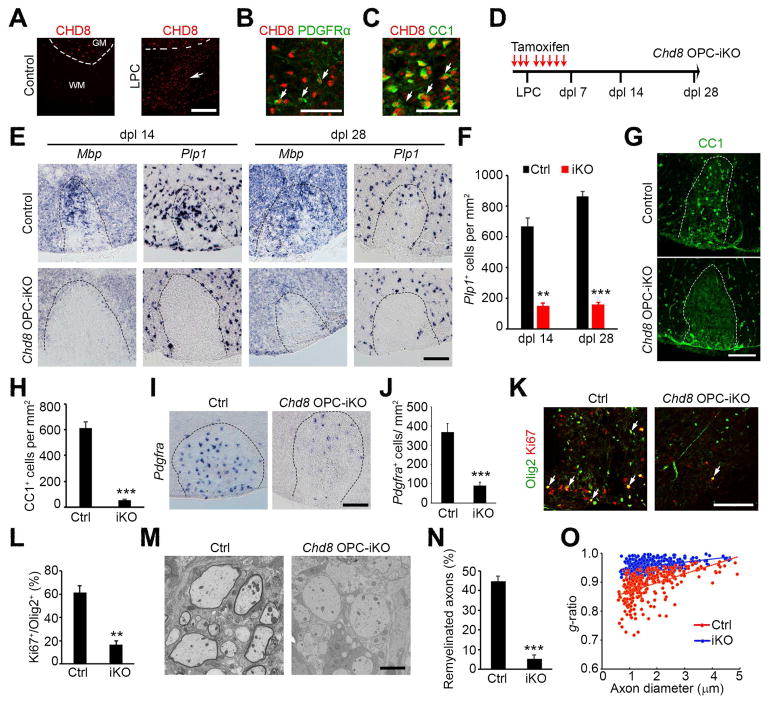
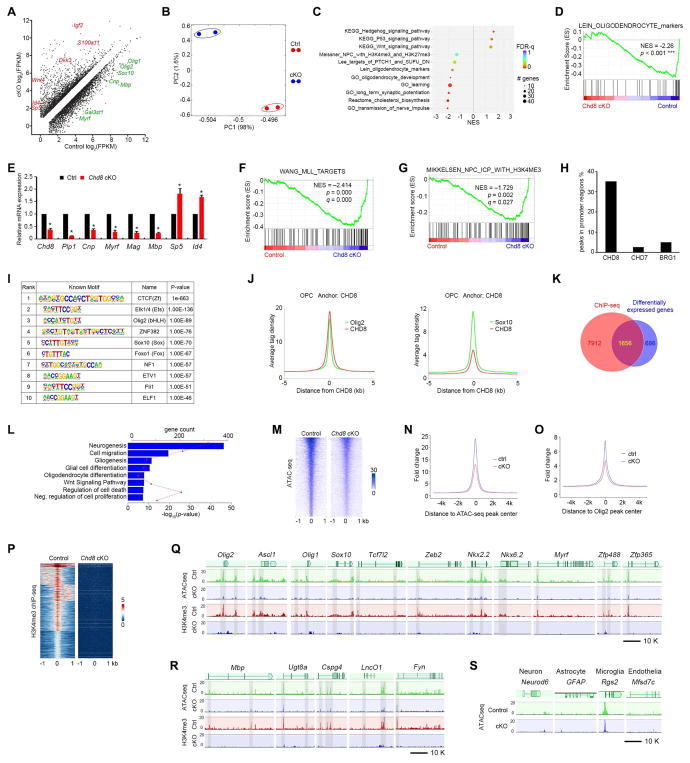
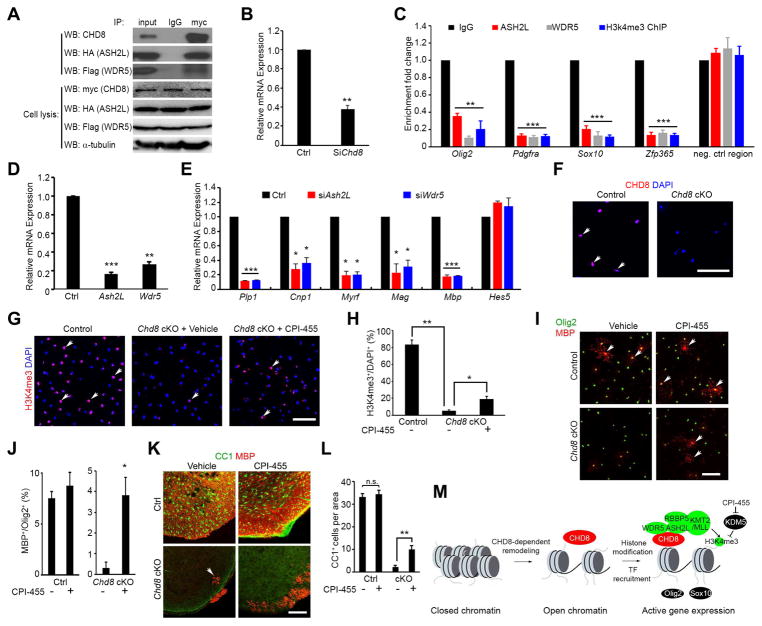
Disruptive mutations in chromatin remodeler CHD8 cause autism spectrum disorders, exhibiting widespread white matter abnormalities; however, the underlying mechanisms remain elusive. We show that cell-type specific Chd8 deletion in oligodendrocyte progenitors, but not in neurons, results in myelination defects, revealing a cell-intrinsic dependence on CHD8 for oligodendrocyte lineage development, myelination and post-injury remyelination. CHD8 activates expression of BRG1-associated SWI/SNF complexes that in turn activate CHD7, thus initiating a successive chromatin remodeling cascade that orchestrates oligodendrocyte lineage progression. Genomic occupancy analyses reveal that CHD8 establishes an accessible chromatin landscape, and recruits MLL/KMT2 histone methyltransferase complexes distinctively around proximal promoters to promote oligodendrocyte differentiation. Inhibition of histone demethylase activity partially rescues myelination defects of CHD8-deficient mutants. Our data indicate that CHD8 exhibits a dual function through inducing a cascade of chromatin reprogramming and recruiting H3K4 histone methyltransferases to establish oligodendrocyte identity, suggesting potential strategies of therapeutic intervention for CHD8-associated white matter defects.

Keywords: CHD8; KMT2/MLL; autism; chromatin landscape; chromatin remodeling; histone methyltransferase; myelin repair; myelination; oligodendrocyte development; regulatory cascade.


Conflict of interest statement

DECLARATION OF INTERESTS

The authors declare no competing interests.

Figures

Figure 1
Figure 1. CHD8 is enriched in oligodendrocyte lineage cells and targets SWI/SNF complex genes
(A) Representative T2-weighted magnetic resonance imaging (MRI) scans of cortices in normal subject (2 year old) and ASD individuals carrying CHD8 disruptive mutations (patient #1, c.5391 A>T, splicing site mutation (2 year old); patient #2, missense mutation c.3485 T>C (p.L1162P); 5 year old). Arrows indicate the corpus callosum. (B) Co-immunolabeling of CHD8, PDGFRα, and CC1 on the CNS regions of wild-type mice at P14. Yellow and white arrowheads indicate co-labeled PDGFRα+ and CC1+cells, respectively. Scale bar, 10 μm. (C) CC1+ or PDGFRα+ cell numbers among total CHD8+ cells in the optic nerve, spinal cord, and corpus callosum. (D) Immunostaining for CHD8 and GFAP in the P14 GFAP-GFP mouse corpus callosum. Arrow indicates GFAP+ astrocytes. Scale bar, 50 μm. (E) Immunolabeling of CHD8, A2B5, CNP, and MBP in cultured rat oligodendrocytes. Scale bar, 50 μm. (F) CHD8 and Sox10 immunostaining in oligodendrocytes (arrows) of the human cerebellar white matter. Scale bar, 50 μm. (G) Immunoblotting of CHD8 and CHD7 in cultured OPCs and differentiating oligodendrocytes at day 1 (d1) and day 3 (d3) after T3 treatment. (H, I) ChIP-seq density heatmaps for CHD8 (H) and CHD7 (I) within ± 1 kb of the CHD8 peak center in OPCs and mOLs. (J) Histogram showing the distribution of CHD8, CHD7, and BRG1 binding peaks in the genome of OPCs. (K) The signal density of CHD8 and CHD7 peaks plotted relative to TSS sites and H3K27Ac peaks. (L, M) Venn diagrams showing overlap of CHD8 and CHD7 peaks in (L) OPCs and (M) mOLs. (N) CHD8 or CHD7 binding on SWI/SNF complex genes. (O) Relative expression of SWI/SNF component mRNAs in CG4 cells transfected with control or Chd8 overexpression vectors (n = 3 independent experiments; * p < 0.05 and ** p < 0.01, two-tailed unpaired Student’s t test). See also Figure S1.
Figure 2
Figure 2. The chromatin remodeler CHD8 is required for proper CNS myelination
(A) Diagram depicting generation of Chd8 cKO mice. (B) Immunolabeling of CHD8 in the ventral white matter of control and Chd8 cKO spinal cords at P14. Scale bar, 50 μm. (C, D) Representative images of control and Chd8 cKO mice at P14 (C) and P18 (D). The cKO mouse is suffering from a seizure (D). (E) Survival curves of control and Chd8 cKO mice (n ≥ 32). (F) Representative images of optic nerves from control and Chd8 cKO mice at P14. (G–I) Expression of Mbp and Plp1 in spinal cord (G), cortex (H), and cerebellum (I) of control and Chd8 cKO mice at P1 and P14. Scale bars, 300 μm. (J) Electron micrographs of indicated CNS regions from P14 control and Chd8 cKO mice. Scale bars, 2 μm (left and right panels), 4 μm (middle panel). (K) Myelinated axon numbers (per mm2) in the optic nerve (ON), spinal cord (SC), and corpus callosum (CC) of control and Chd8 cKO at P14 (n = 4 controls and 4 mutant animals; *** p < 0.001, two-tailed unpaired Student’s t test). See also Figure S2.
Figure 3
Figure 3. CHD8 is required for OPC generation and survival in the spinal cord but not in the cortex
(A) In situ hybridization for Pdgfra in the cortices at P1 and P14. Scale bar, 300 μm. (B) Quantification of Pdgfra+ OPCs in the cortex (n = 3 animals). (C) Immunostaining for BrdU and Olig2 in the corpus callosum from P1 mice. Scale bar, 50 μm. (D) Percentage of BrdU+ cells relative to all Olig2+ OPCs in the corpus callosum of P1 mice. (n = 3 animals). (E,F) In situ hybridization for Pdgfra in the spinal cord of control and Chd8 cKO mice at E14.5, P1, P14. Scale bar, 300 μm. Panel F, quantification of Pdgfra+ OPCs. (G,H) Olig2 immunostaining in the spinal cord of control and Chd8 cKO mice at P1. Scale bar, 200 μm. Panel H, quantification of Olig2+ cells. (I) Olig2 and Ki67 immunostaining in the spinal cord of control and Chd8 cKO mice at P1. Scale bar, 100 μm. (J) Quantification of Ki67+ relative to total Olig2+ OPCs. (K) Primary OPCs from control and Chd8 cKO mice cultured in Sato medium without PDGFAA and NT3 for 24 hr were immune-stained with cleaved caspase 3 and Olig2. Scale bar, 100 μm. (L) Percentage of cl-caspase3+ among total Olig2+ cells from above control and Chd8 cKO OPCs. n = 3 animals/genotype; * p < 0.05 and ** p < 0.05, two-tailed unpaired Student’s t test in F, H, J, L. See also Figure S3.
Figure 4
Figure 4. CHD8 deletion impairs oligodendrocyte differentiation in a cell-autonomous manner
(A) MBP immunostaining of Chd8f/f OPCs 4 days after transduction with GFP control or Cre-GFP expressing adenovirus vectors in differentiation medium. Arrows: transduced cells. Scale bar, 100 μm. (B) Percentage of MBP+ oligodendrocytes among total GFP+ cells after 4 days of differentiation. (C) Diagram showing tamoxifen (TAM) administration to induce Chd8 deletion. (D, E) Immunostaining of CHD8 (D), CC1 and MBP (E) on the corpus callosum of control and Chd8 OPC-iKO mice. Scale bars, D, 50 μm; E,100 μm. (F) Quantification of CC1+ oligodendrocyte cell numbers in the corpus callosum of control and Chd8 OPC-iKO mice at P14. (G) Percentage of MBP+ area in the corpus callosum of control and Chd8 OPC-iKO mice at P14. (H, I) Immunolabeling of PDGFRα on the corpus callosum of control and Chd8 OPC-iKO mice. Scale bar, 50 μm. Panel I, quantification of PDGFRα+ OPCs. n = 4 animals/genotype; *** p < 0.001, two-tailed unpaired Student’s t test in B, F, G, I. See also Figure S4 and S5.
Figure 5
Figure 5. CHD8 is required for CNS remyelination
(A) CHD8 and CC1 immunostaining in non-lesion control and LPC lesion spinal cords at dpl 7. Dashed line indicates the border between white (WM) and gray matter (GM). Scale bar, 200 μm. (B, C) CHD8 and PDGFRα immunostaining (B) and CC1 (C) at LPC-lesion sites. Scale bar, 50 μm. (D) Diagram showing TAM administration and LPC injection schedule. (E) In situ hybridization for Pdgfra, Mbp, and Plp1 in spinal LPC lesions of control and Chd8 OPC-iKO mutants at dpl 14 and 28. Scale bar, 100 μm. (F) Quantification of Plp1+ oligodendrocytes in LPC lesion sites at dpl 14 and 28. Data are presented as means ± s.e.m. (G, H) Immunostaining for CC1 in LPC lesions from control and Chd8 OPC-iKO spinal cords at dpl 14. Scale bar, 100 μm. H, quantification of CC1+ oligodendrocytes in LPC lesion. (I, J) In situ hybridization for Pdgfra in spinal LPC lesions of control and Chd8 OPC-iKO mutants at dpl 14. Scale bar, 100 μm. J, quantification of Pdgfra+ OPCs in LPC lesion sites (K) Immunostaining for Ki67 and Olig2 in LPC lesions from control and Chd8 OPC-iKO spinal cords at dpl 14. Scale bar, 100 μm. (L) Quantification of Ki67+ cells among total Olig2+ OPCs in LPC lesion sites at dpl 14. (M) Electron microscopy of LPC lesions from control and Chd8 OPC-iKO spinal cords at dpl 14. Scale bar, 2 μm. (N) The percentage of remyelinated axons in LPC-induced lesions of control and Chd8 OPC-iKO spinal cords at dpl 14. (O) The myelin g-ratio in LPC-induced lesions of control and Chd8 OPC-iKO mutants at dpl 14 (n > 200 axons from 3 animals; p < 0.001, two-tailed unpaired Student’s t test). * p < 0.01 and ** p < 0.001, two-tailed unpaired Student’s t test in F, H, J, L, N (n = 4 animals/genotype). See also Figure S6.
Figure 6
Figure 6. CHD8 controls the core regulatory network for oligodendrocyte differentiation
(A) Differentially expressed transcripts (highlighted in color; FDR < 0.05) between OPCs isolated from control and Chd8 cKO mouse brains at P7. (B) Principal components analysis (PCA) of RNA-seq data from control and Chd8 cKO OPCs. (C) GSEA terms that are significantly different in the Chd8 cKO OPC cells compared to controls. NES: net enrichment score. (D) GSEA plot shows oligodendrocyte signature genes are downregulated in the Chd8 cKO cells. (E) qRT-PCR analysis of myelination-associated genes in control and Chd8 cKO OPCs. Data are presented as means ± s.e.m. (n = 3 experiments; * p < 0.05, two-tailed unpaired Student’s t test). (F, G) GSEA plots show KMT2/MLL target genes (F) and H3K4me3 (G) targeted genes are downregulated in Chd8 cKO cells. (H) Percentage of binding peaks of CHD8, CHD7, and BRG1 in the genome of OPCs. (I) Enriched motifs in the CHD8-bound regions. (J) The signal density of Olig2 and Sox10 peaks plotted relative to CHD8 peaks. (K) Venn diagram showing the overlap between CHD8-bound genes and differentially expressed genes in control and Chd8 cKO OPCs. The overlapping genes are direct CHD8 target genes. (L) Enrichment analysis of pathway terms overrepresented in CHD8 target genes. (M) Heatmaps for ATAC-seq peaks from control and Chd8 cKO OPCs showing ± 1 kb around the ATAC-seq peak center. (N, O) Tag enrichments of accessible genomic regions relative to ATAC-seq peaks (N) and Olig2 binding peaks (O) in control and Chd8 cKO OPCs. (P) Heatmaps for H3K4me3 ChIP-seq peaks from control and Chd8 cKO OPCs showing ± 1 kb around the peak center. (Q, R) Representative ATAC-seq and H3K4me3 ChIP-seq tracks of OPC specification regulatory genes (Q), myelination-related genes (R) in the control and Chd8 cKO OPCs. (S) Representative ATAC-seq tracks of neuronal, astrocytic, microglial, and endothelial genes in the control and Chd8 cKO OPCs. See also Figure S7.
Figure 7
Figure 7. CHD8 regulates H3K4me3 deposition at the promoters of oligodendrocyte genes through interaction with ASH2L and WDR5
(A) CHD8 co-immunoprecipitated with ASH2L and WDR5. (B) Levels of Chd8 mRNA in rat OPCs treated with Chd8 siRNA (siChd8) or control siRNA (Ctrl). (C) Enrichment of ASH2L, WDR5, and H3K4me3 in promoter regions of oligodendrocyte genes in control and siChd8-treated OPCs. (D, E) Ash2L and Wdr5 (D) and myelin gene (E) mRNA expression in cultured OPCs treated with siRNAs targeting Ash2L or Wdr5. Data are presented as means ± s.e.m. (n = 3 experiments; ** p < 0.001, two-tailed unpaired Student’s t test). (F) CHD8 immunostaining in OPCs from control and Chd8 cKO cortices. Scale bar, 100 μm. (G, H) H3K4me3 immunostaining in control and Chd8 cKO OPCs treated with vehicle or CPI-455. Scale bar, 100 μm. Panel H, percentage of H3K4me3+ oligodendrocytes among total cells. (I, J) MBP and Olig2 immunostaining in control and Chd8 cKO OPCs treated with vehicle or CPI-455. Scale bar, 100 μm. Panel J, percentage of MBP+ oligodendrocytes among total Olig2+ cells. (K, L) CC1 and MBP immunostaining of spinal cords from control and Chd8 cKO littermates treated with vehicle or CPI-455 and harvested at P14. Scale bar, 100 μm. Panel L, quantification of CC1+ oligodendrocytes. (M) A schematic model showing that CHD8 executes a dual function by establishing an accessible chromatin landscape and recruiting KMT2/MLL histone methyltransferase to activate the transcriptional program for oligodendrocyte lineage progression.

Similar articles

Cited by

References

    1. Aubrey BJ, Kelly GL, Janic A, Herold MJ, Strasser A. How does p53 induce apoptosis and how does this relate to p53-mediated tumour suppression? Cell Death Differ. 2018;25:104–113. - PMC - PubMed
    1. Banelli B, Daga A, Forlani A, Allemanni G, Marubbi D, Pistillo MP, Profumo A, Romani M. Small molecules targeting histone demethylase genes (KDMs) inhibit growth of temozolomide-resistant glioblastoma cells. Oncotarget. 2017;8:34896–34910. - PMC - PubMed
    1. Barnard RA, Pomaville MB, O’Roak BJ. Mutations and Modeling of the Chromatin Remodeler CHD8 Define an Emerging Autism Etiology. Front Neurosci. 2015;9:477. - PMC - PubMed
    1. Batsukh T, Pieper L, Koszucka AM, von Velsen N, Hoyer-Fender S, Elbracht M, Bergman JE, Hoefsloot LH, Pauli S. CHD8 interacts with CHD7, a protein which is mutated in CHARGE syndrome. Hum Mol Genet. 2010;19:2858–2866. - PubMed
    1. Bercury KK, Macklin WB. Dynamics and Mechanisms of CNS Myelination Developmental cell. 2015;32:447–458. - PMC - PubMed

Publication types