

An anatomically curated fiber clustering white matter atlas for consistent white matter tract parcellation across the lifespan
- PMID: 29920375
- PMCID: PMC6080311
- DOI: 10.1016/j.neuroimage.2018.06.027
An anatomically curated fiber clustering white matter atlas for consistent white matter tract parcellation across the lifespan
Abstract
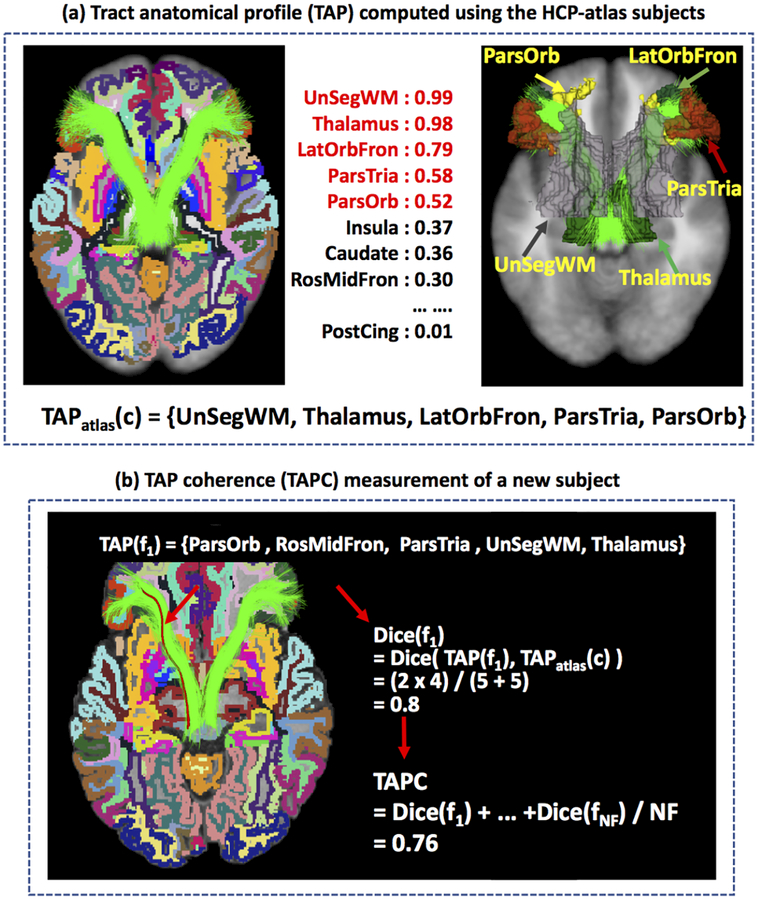
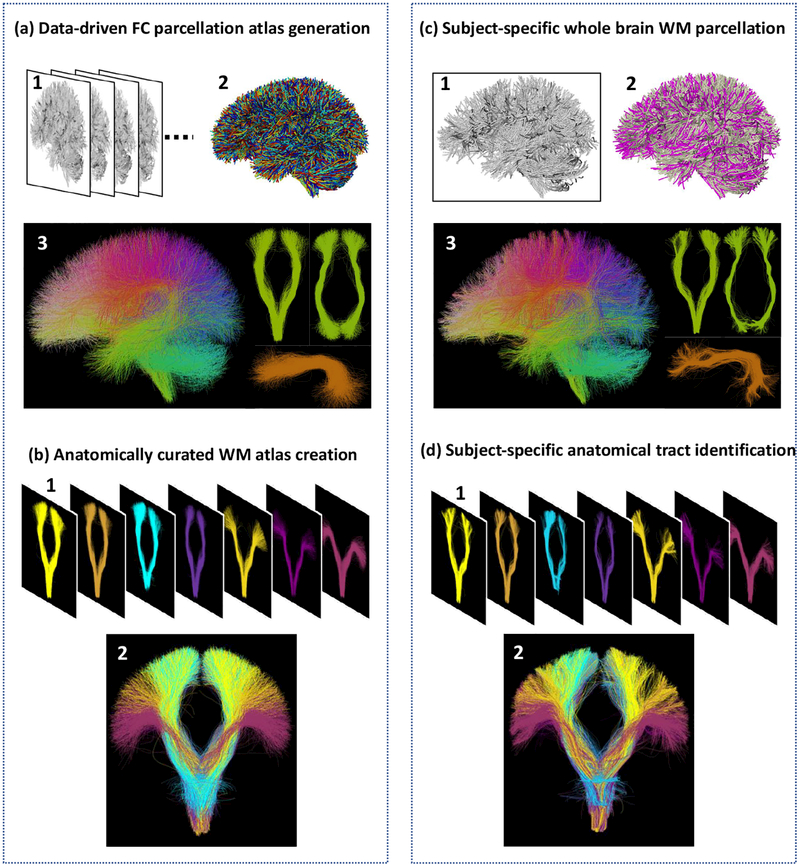
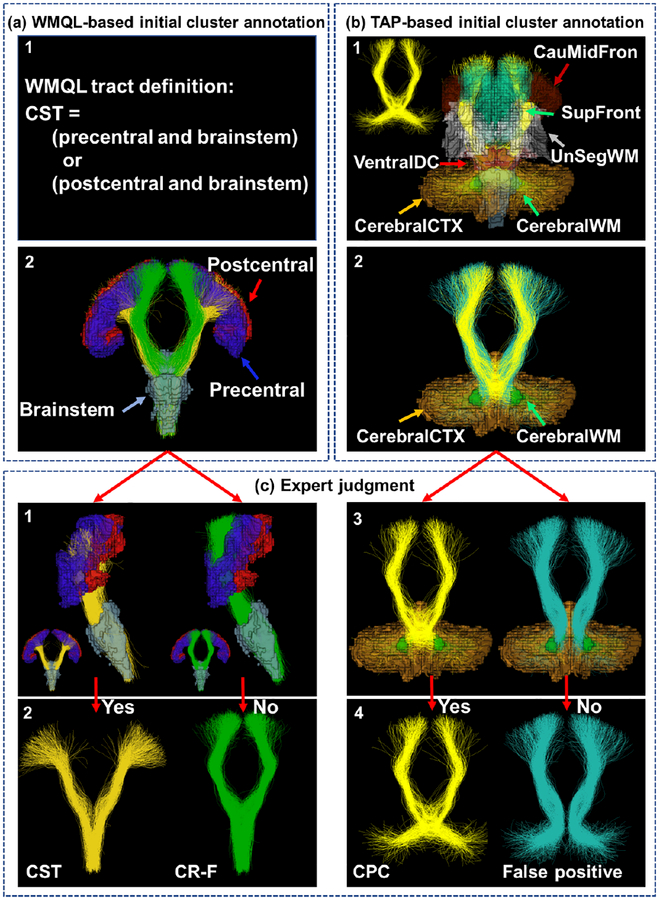
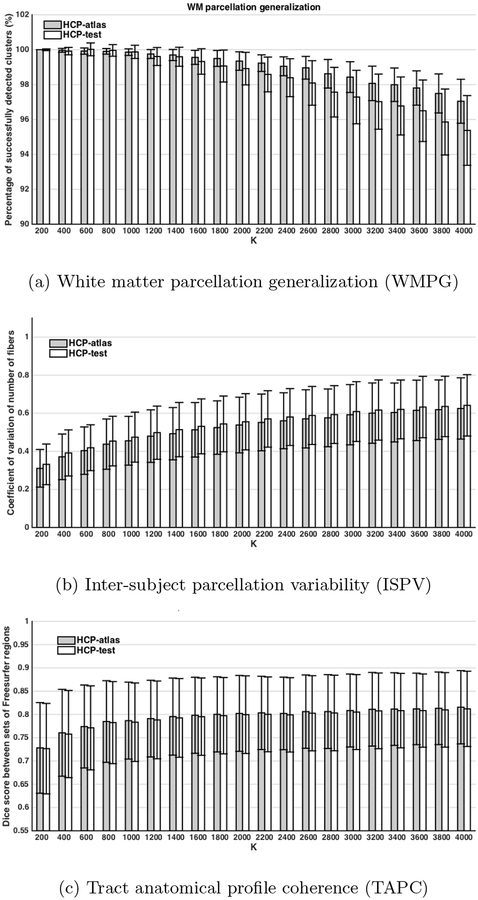
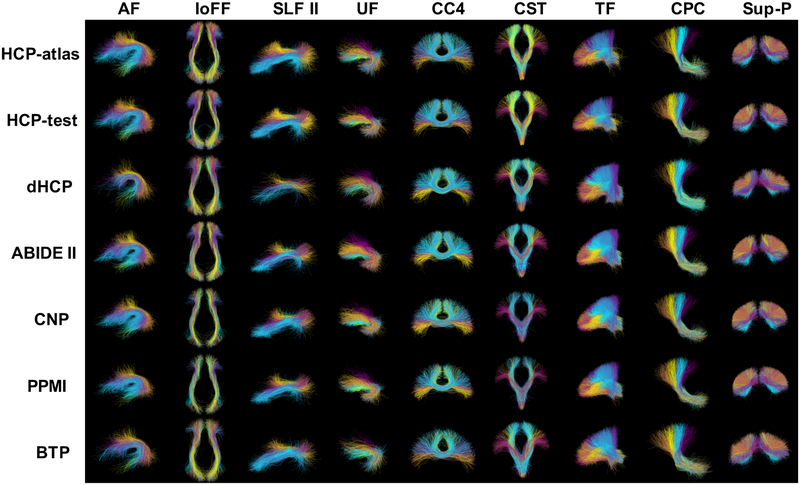
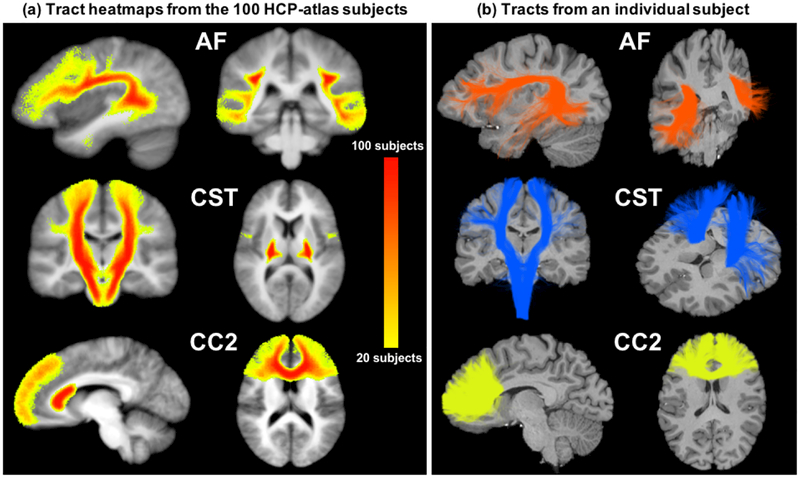
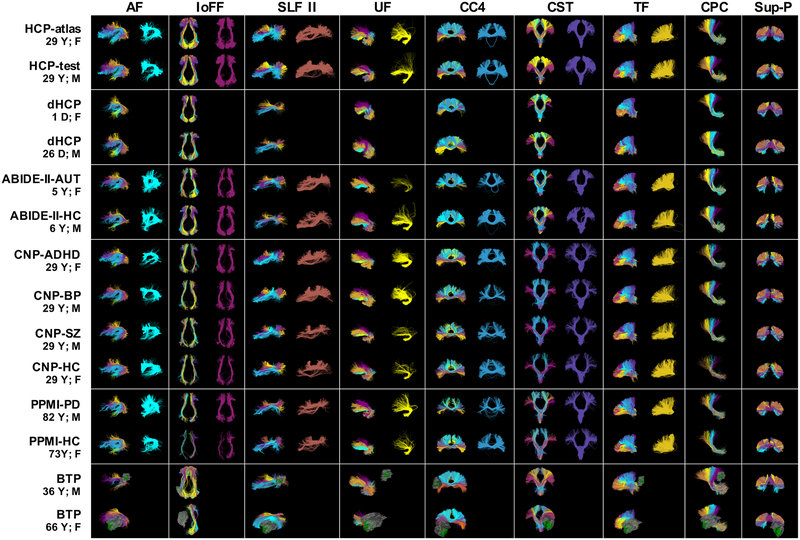
This work presents an anatomically curated white matter atlas to enable consistent white matter tract parcellation across different populations. Leveraging a well-established computational pipeline for fiber clustering, we create a tract-based white matter atlas including information from 100 subjects. A novel anatomical annotation method is proposed that leverages population-based brain anatomical information and expert neuroanatomical knowledge to annotate and categorize the fiber clusters. A total of 256 white matter structures are annotated in the proposed atlas, which provides one of the most comprehensive tract-based white matter atlases covering the entire brain to date. These structures are composed of 58 deep white matter tracts including major long range association and projection tracts, commissural tracts, and tracts related to the brainstem and cerebellar connections, plus 198 short and medium range superficial fiber clusters organized into 16 categories according to the brain lobes they connect. Potential false positive connections are annotated in the atlas to enable their exclusion from analysis or visualization. In addition, the proposed atlas allows for a whole brain white matter parcellation into 800 fiber clusters to enable whole brain connectivity analyses. The atlas and related computational tools are open-source and publicly available. We evaluate the proposed atlas using a testing dataset of 584 diffusion MRI scans from multiple independently acquired populations, across genders, the lifespan (1 day-82 years), and different health conditions (healthy control, neuropsychiatric disorders, and brain tumor patients). Experimental results show successful white matter parcellation across subjects from different populations acquired on multiple scanners, irrespective of age, gender or disease indications. Over 99% of the fiber tracts annotated in the atlas were detected in all subjects on average. One advantage in terms of robustness is that the tract-based pipeline does not require any cortical or subcortical segmentations, which can have limited success in young children and patients with brain tumors or other structural lesions. We believe this is the first demonstration of consistent automated white matter tract parcellation across the full lifespan from birth to advanced age.
Copyright © 2018 Elsevier Inc. All rights reserved.
Figures
Similar articles
-
Test-retest reproducibility of white matter parcellation using diffusion MRI tractography fiber clustering.Hum Brain Mapp. 2019 Jul;40(10):3041-3057. doi: 10.1002/hbm.24579. Epub 2019 Mar 15. Hum Brain Mapp. 2019. PMID: 30875144 Free PMC article.
-
Investigation into local white matter abnormality in emotional processing and sensorimotor areas using an automatically annotated fiber clustering in major depressive disorder.Neuroimage. 2018 Nov 1;181:16-29. doi: 10.1016/j.neuroimage.2018.06.019. Epub 2018 Jul 6. Neuroimage. 2018. PMID: 29890329 Free PMC article.
-
Deep fiber clustering: Anatomically informed fiber clustering with self-supervised deep learning for fast and effective tractography parcellation.Neuroimage. 2023 Jun;273:120086. doi: 10.1016/j.neuroimage.2023.120086. Epub 2023 Apr 3. Neuroimage. 2023. PMID: 37019346 Free PMC article.
-
The Shape of the Brain's Connections Is Predictive of Cognitive Performance: An Explainable Machine Learning Study.Hum Brain Mapp. 2025 Apr 1;46(5):e70166. doi: 10.1002/hbm.70166. Hum Brain Mapp. 2025. PMID: 40143640 Free PMC article. Review.
-
Whole mouse brain reconstruction and registration to a reference atlas with standard histochemical processing of coronal sections.J Comp Neurol. 2019 Sep 1;527(13):2170-2178. doi: 10.1002/cne.24602. Epub 2019 Jan 2. J Comp Neurol. 2019. PMID: 30549030 Free PMC article. Review.
Cited by
-
Harmonization of Multi-Center Diffusion Tensor Tractography in Neonates with Congenital Heart Disease: Optimizing Post-Processing and Application of ComBat.Neuroimage Rep. 2022 Sep;2(3):100114. doi: 10.1016/j.ynirp.2022.100114. Epub 2022 Jun 20. Neuroimage Rep. 2022. PMID: 36258783 Free PMC article.
-
Prediction of postoperative deficits using an improved diffusion-weighted imaging maximum a posteriori probability analysis in pediatric epilepsy surgery.J Neurosurg Pediatr. 2019 Feb 22;23(5):648-659. doi: 10.3171/2018.11.PEDS18601. Print 2019 May 1. J Neurosurg Pediatr. 2019. PMID: 30797207 Free PMC article.
-
Functional clustering of whole brain white matter fibers.J Neurosci Methods. 2020 Apr 1;335:108626. doi: 10.1016/j.jneumeth.2020.108626. Epub 2020 Feb 4. J Neurosci Methods. 2020. PMID: 32032716 Free PMC article.
-
Short fiber bundle filtering and test-retest reproducibility of the Superficial White Matter.Front Neurosci. 2024 Apr 26;18:1394681. doi: 10.3389/fnins.2024.1394681. eCollection 2024. Front Neurosci. 2024. PMID: 38737100 Free PMC article.
-
Phybers: a package for brain tractography analysis.Front Neurosci. 2024 Mar 11;18:1333243. doi: 10.3389/fnins.2024.1333243. eCollection 2024. Front Neurosci. 2024. PMID: 38529266 Free PMC article.
References
-
- Akazawa K, Chang L, Yamakawa R, Hayama S, Buchthal S, Alicata D, Andres T, Castillo D, Oishi K, Skranes J, Ernst T, Oishi K, 2016. Probabilistic maps of the white matter tracts with known associated functions on the neonatal brain atlas: application to evaluate longitudinal developmental trajectories in term-born and preterm-born infants. NeuroImage 128, 167–179. - PMC - PubMed
-
- Alexander AL, Lee JE, Lazar M, Boudos R, DuBray MB, Oakes TR, Miller JN, Lu J, Jeong E-K, McMahon WM, Bigler ED, Lainhart JE, 2007. Diffusion tensor imaging of the corpus callosum in Autism. NeuroImage 34 (1), 61–73. - PubMed
-
- Amunts K, Schleicher A, Bürgel U, Mohlberg H, Uylings H, Zilles K, 1999. Broca’s region revisited: cytoarchitecture and intersubject variability. Journal of Comparative Neurology 412 (2), 319–341. - PubMed
-
- Avants BB, Tustison N, Song G, 2009. Advanced normalization tools (ANTS). Insight j 2, 1–35.
Publication types
MeSH terms
Grants and funding
LinkOut - more resources
Full Text Sources
Other Literature Sources
