

Different effects of propofol and dexmedetomidine sedation on electroencephalogram patterns: Wakefulness, moderate sedation, deep sedation and recovery
- PMID: 29920532
- PMCID: PMC6007908
- DOI: 10.1371/journal.pone.0199120
Different effects of propofol and dexmedetomidine sedation on electroencephalogram patterns: Wakefulness, moderate sedation, deep sedation and recovery
Abstract
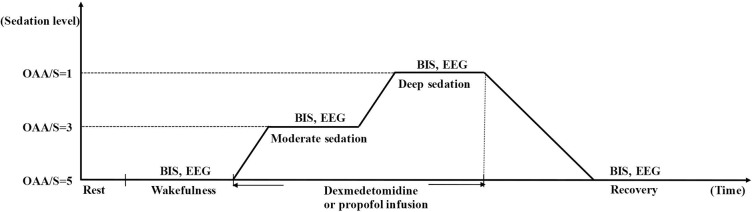
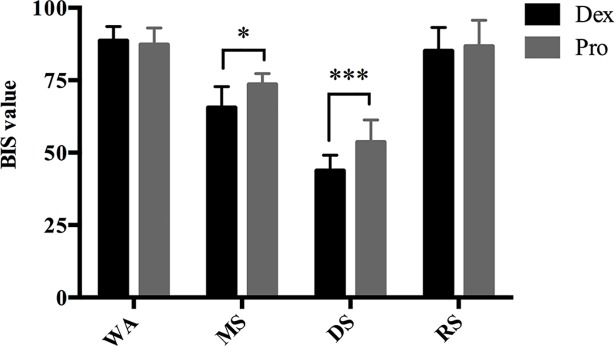
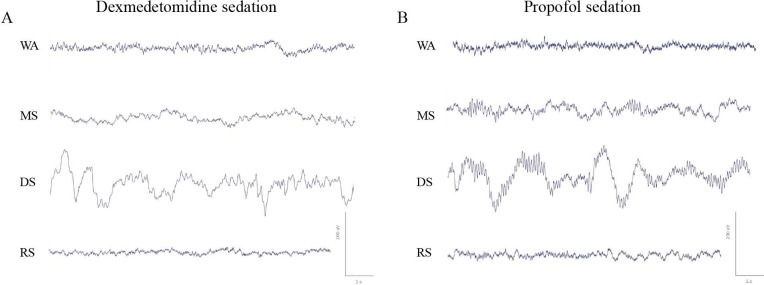
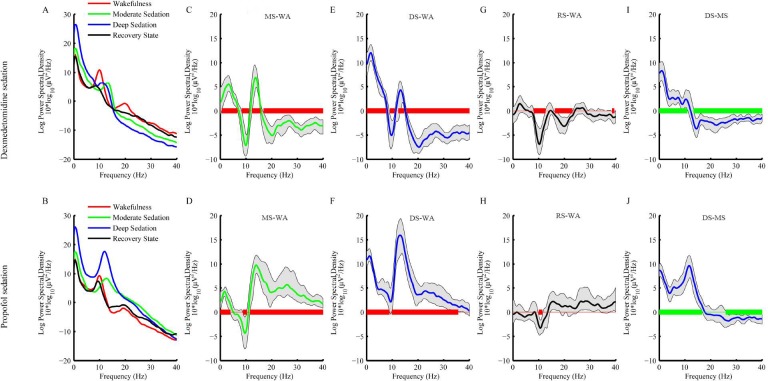
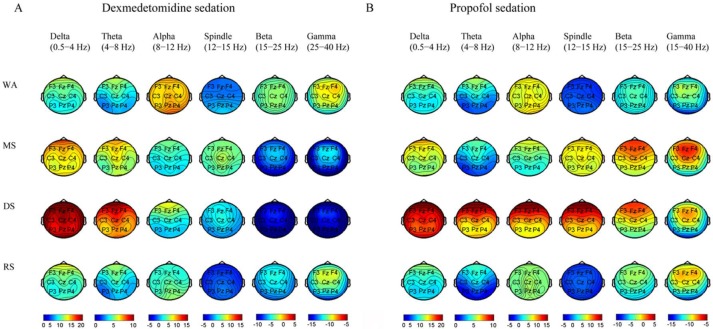
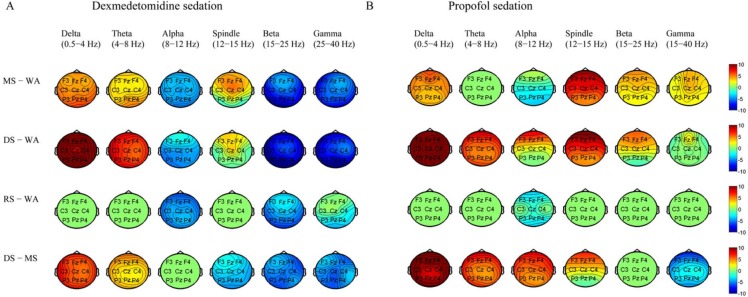
Sedation induces changes in electroencephalography (EEG) dynamics. However, the distinct EEG dynamic characteristics at comparable sedation levels have not been well studied, resulting in potential interpretation errors in EEG monitoring during sedation. We aimed to analyze the EEG dynamics of dexmedetomidine and propofol at comparable sedation levels and to explore EEG changes with increased sedation levels for each agent. We measured the Bispectral Index (BIS) and 20-channel EEG under dexmedetomidine and propofol sedation from wakefulness, moderate sedation, and deep sedation to recovery in healthy volunteers (n = 10) in a randomized, 2-day, crossover study. Observer's Assessment of Alertness and Sedation (OAA/S) score was used to assess sedation levels. Despite similar changes in increased delta oscillations, multiple differences in the EEG spatiotemporal dynamics were observed between these two agents. During moderate sedation, both dexmedetomidine and propofol induced increased spindle power; however, dexmedetomidine decreased the global alpha/beta/gamma power, whereas propofol decreased the alpha power in the occipital area and increased the global spindle/beta/gamma power. During deep sedation, dexmedetomidine was associated with increased fronto-central spindle power and decreased global alpha/beta/gamma power, but propofol was associated with increased theta/alpha/spindle/beta power, which was maximized in the frontal area. The transition of topographic alpha/spindle/beta power distribution from moderate sedation to deep sedation completely differed between these two agents. Our study demonstrated that there was a distinct hierarchy of EEG changes with increased sedation depths by propofol and dexmedetomidine. Differences in EEG dynamics at the same sedation level might account for differences in the BIS value and reflect the different sedation mechanisms. EEG-based clinical sedation monitoring should consider the effect of drug types on EEG dynamics.
Conflict of interest statement
The authors have declared that no competing interests exist.
Figures
Similar articles
-
Changes in topographic electroencephalogram during deepening levels of propofol sedation based on alertness/sedation scale under bispectral index guidance.Anaesthesiol Intensive Ther. 2019;51(3):224-229. doi: 10.5114/ait.2019.87361. Anaesthesiol Intensive Ther. 2019. PMID: 31434471
-
The correlation between bispectral index and observational sedation scale in volunteers sedated with dexmedetomidine and propofol.Anesth Analg. 2009 Dec;109(6):1811-5. doi: 10.1213/ANE.0b013e3181c04e58. Anesth Analg. 2009. PMID: 19923507 Clinical Trial.
-
Electroencephalographic Arousal Patterns Under Dexmedetomidine Sedation.Anesth Analg. 2018 Oct;127(4):951-959. doi: 10.1213/ANE.0000000000003590. Anesth Analg. 2018. PMID: 29933272 Clinical Trial.
-
Bispectral index as a guide for titration of propofol during procedural sedation among children.Pediatrics. 2005 Jun;115(6):1666-74. doi: 10.1542/peds.2004-1979. Pediatrics. 2005. PMID: 15930231 Review.
-
Evaluation of endovenous sedation using BIS monitoring in dentistry. A systematic review.Med Oral Patol Oral Cir Bucal. 2020 Jul 1;25(4):e439-e448. doi: 10.4317/medoral.22884. Med Oral Patol Oral Cir Bucal. 2020. PMID: 32520922 Free PMC article.
Cited by
-
Electroencephalographic spectrogram-guided total intravenous anesthesia using dexmedetomidine and propofol prevents unnecessary anesthetic dosing during craniotomy: a propensity score-matched analysis.Korean J Anesthesiol. 2024 Feb;77(1):122-132. doi: 10.4097/kja.23118. Epub 2023 May 22. Korean J Anesthesiol. 2024. PMID: 37211766 Free PMC article.
-
Towards a better understanding of anesthesia emergence mechanisms: Research and clinical implications.World J Methodol. 2018 Oct 12;8(2):9-16. doi: 10.5662/wjm.v8.i2.9. eCollection 2018 Oct 12. World J Methodol. 2018. PMID: 30345225 Free PMC article. Review.
-
Electroencephalographic guided propofol-remifentanil TCI anesthesia with and without dexmedetomidine in a geriatric population: electroencephalographic signatures and clinical evaluation.J Clin Monit Comput. 2024 Aug;38(4):803-815. doi: 10.1007/s10877-024-01127-4. Epub 2024 Mar 7. J Clin Monit Comput. 2024. PMID: 38451341 Clinical Trial.
-
Electroencephalogram monitoring during anesthesia and critical care: a guide for the clinician.J Clin Monit Comput. 2025 Apr;39(2):315-348. doi: 10.1007/s10877-024-01250-2. Epub 2024 Dec 20. J Clin Monit Comput. 2025. PMID: 39704777 Review.
-
Changes in electroencephalographic power and bicoherence spectra according to depth of dexmedetomidine sedation in patients undergoing spinal anesthesia.Int J Med Sci. 2021 Mar 15;18(10):2117-2127. doi: 10.7150/ijms.54677. eCollection 2021. Int J Med Sci. 2021. PMID: 33859518 Free PMC article.
References
-
- Lamperti M. Adult procedural sedation: an update. Curr Opin Anaesthesiol. 2015;28(6):662–7. Epub 2015/09/12. doi: 10.1097/ACO.0000000000000244 . - DOI - PubMed
-
- Mahmoud M, Mason KP. A forecast of relevant pediatric sedation trends. Curr Opin Anaesthesiol. 2016;29 Suppl 1:S56–67. Epub 2016/03/02. doi: 10.1097/aco.0000000000000321 . - DOI - PubMed
-
- Sheahan CG, Mathews DM. Monitoring and delivery of sedation. Br J Anaesth. 2014;113 Suppl 2:ii37–47. Epub 2014/12/17. doi: 10.1093/bja/aeu378 . - DOI - PubMed
-
- Lerch C, Park GR. Sedation and analgesia. Br Med Bull. 1999;55(1):76–95. . - PubMed
-
- Becker DE. Pharmacodynamic considerations for moderate and deep sedation. Anesthesia progress. 2012;59(1):28–42. Epub 2012/03/21. doi: 10.2344/0003-3006-59.1.28 ; PubMed Central PMCID: PMC3309299. - DOI - PMC - PubMed
Publication types
MeSH terms
Substances
LinkOut - more resources
Full Text Sources
Other Literature Sources
Medical
Miscellaneous
