

5-Aminolevulinic Acid-Induced Fluorescence in Focal Cortical Dysplasia: Report of 3 Cases
- PMID: 29920583
- PMCID: PMC7056820
- DOI: 10.1093/ons/opy116
5-Aminolevulinic Acid-Induced Fluorescence in Focal Cortical Dysplasia: Report of 3 Cases
Abstract
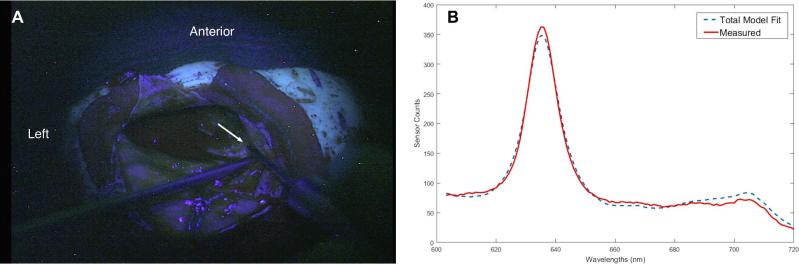
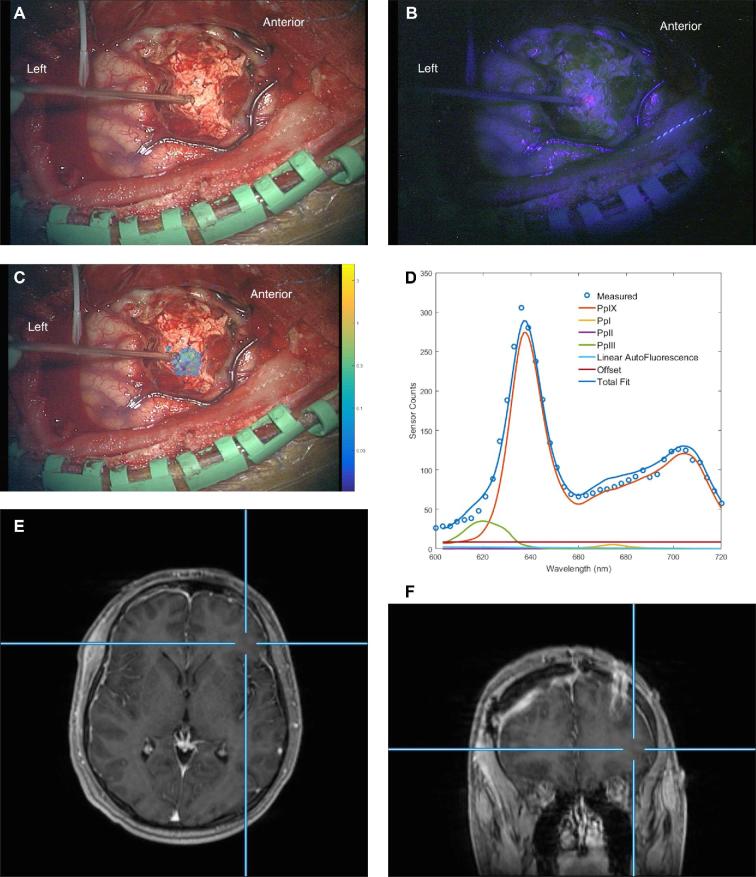
Background: Three patients enrolled in a clinical trial of 5-aminolevulinic-acid (5-ALA)-induced fluorescence-guidance, which has been demonstrated to facilitate intracranial tumor resection, were found on neuropathological examination to have focal cortical dysplasia (FCD).
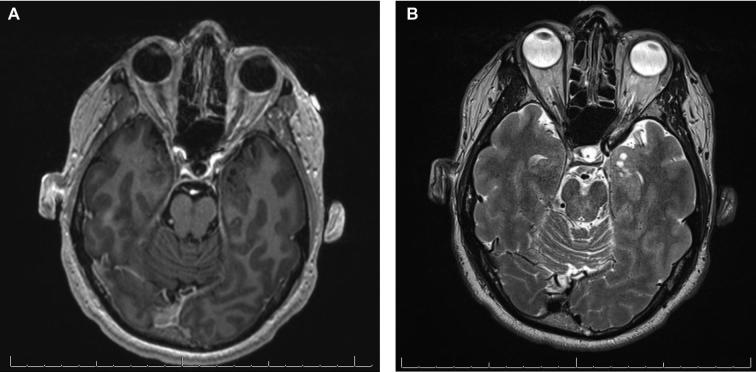
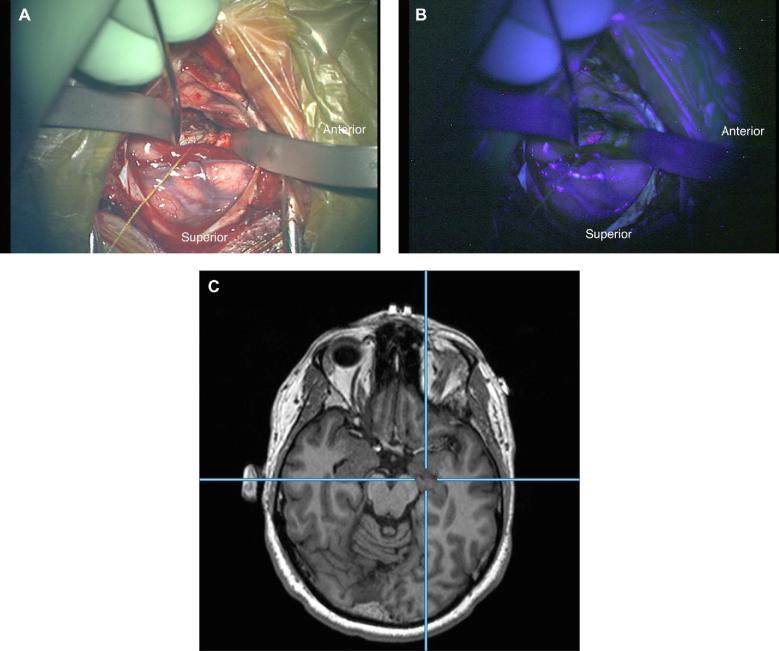
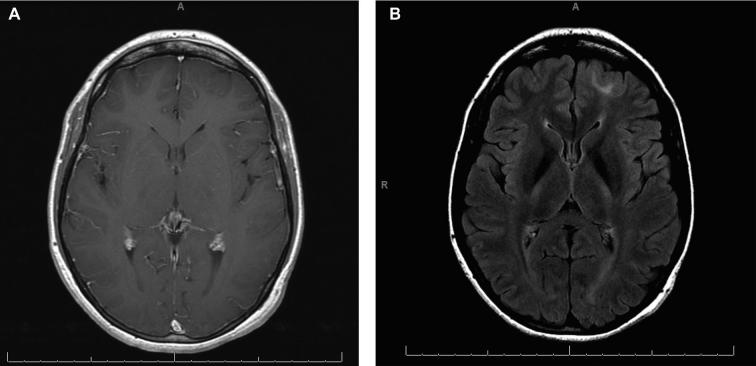
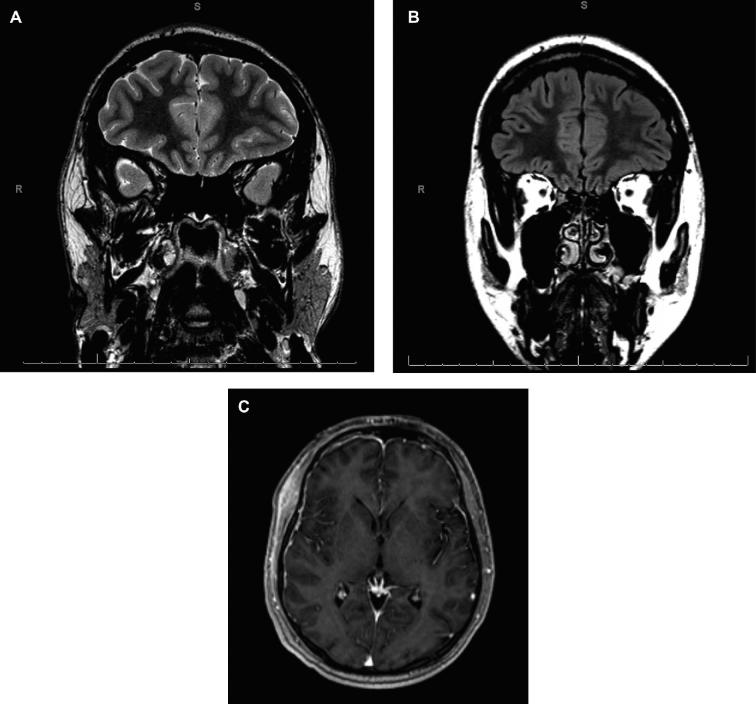
Objective: To evaluate in this case series visible fluorescence and quantitative levels of protoporphyrin IX (PpIX) during surgery and correlate these findings with preoperative magnetic resonance imaging (MRI) and histopathology.
Methods: Patients were administered 5-ALA (20 mg/kg) approximately 3 h prior to surgery and underwent image-guided, microsurgical resection of their MRI- and electrophysiologically identified lesions. Intraoperative visible fluorescence was evaluated using an operating microscope adapted with a commercially available blue light module. Quantitative PpIX levels were assessed using a handheld fiber-optic probe and a wide-field imaging spectrometer. Sites of fluorescence measurements were co-registered with both preoperative MRI and histopathological analysis.
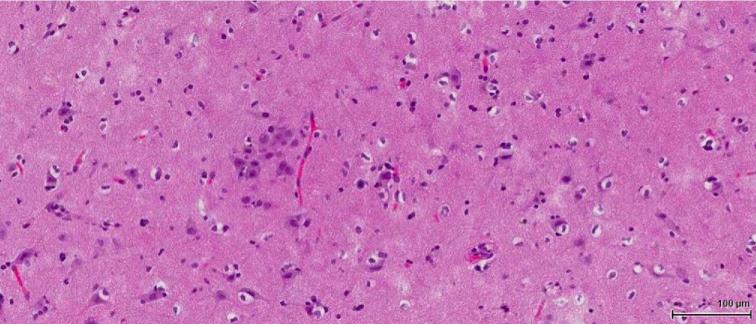
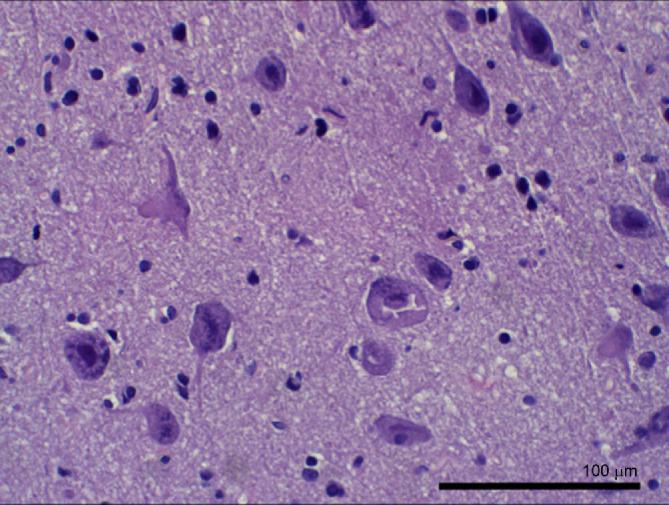
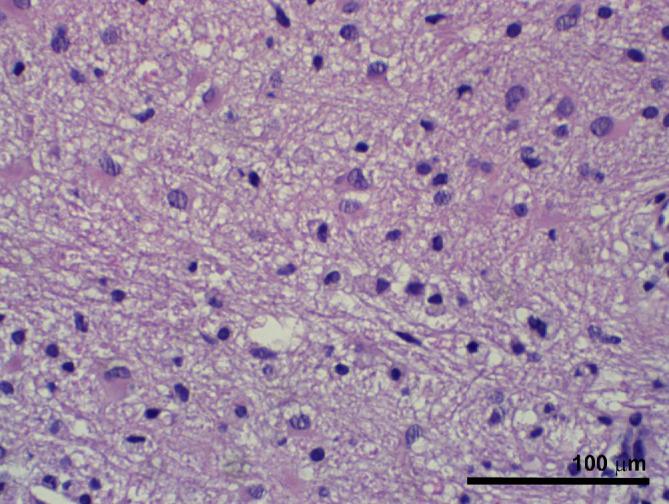
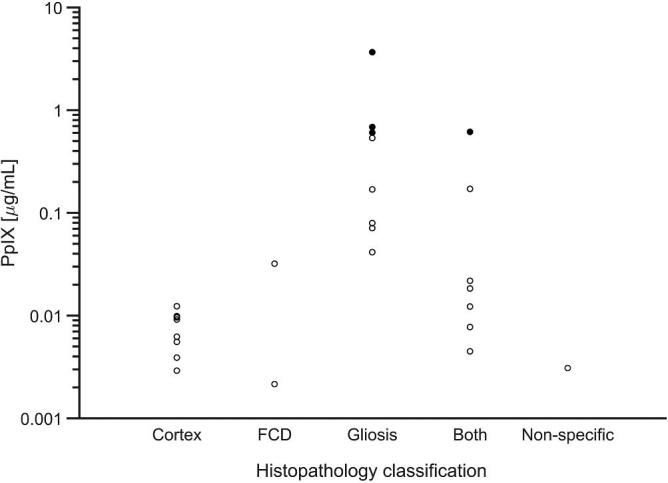
Results: Three patients with a pathologically confirmed diagnosis of FCD (Types 1b, 2a, and 2b) underwent surgery. All patients demonstrated some degree of visible fluorescence (faint or moderate), and all patients had quantitatively elevated concentrations of PpIX. No evidence of neoplasia was identified on histopathology, and in 1 patient, the highest concentrations of PpIX were found at a tissue site with marked gliosis but no typical histological features of FCD.
Conclusion: FCD has been found to be associated with intraoperative 5-ALA-induced visible fluorescence and quantitatively confirmed elevated concentrations of the fluorophore PpIX in 3 patients. This finding suggests that there may be a role for fluorescence-guidance during surgical intervention for epilepsy-associated FCD.
Keywords: 5-Aminolevulinic acid; Epilepsy; Fluorescence guided surgery; Focal cortical dysplasia; Optical spectroscopy; Protoporphyrin IX.
Copyright © 2018 by the Congress of Neurological Surgeons.
Figures
Similar articles
-
Ultrasonographic features of focal cortical dysplasia and their relevance for epilepsy surgery.Neurosurg Focus. 2018 Sep;45(3):E5. doi: 10.3171/2018.6.FOCUS18221. Neurosurg Focus. 2018. PMID: 30173618
-
Multimodal Approach for Radical Excision of Focal Cortical Dysplasia by Combining Advanced Magnetic Resonance Imaging Data to Intraoperative Ultrasound, Electrocorticography, and Cortical Stimulation: A Preliminary Experience.World Neurosurg. 2018 May;113:e738-e746. doi: 10.1016/j.wneu.2018.02.141. Epub 2018 Mar 3. World Neurosurg. 2018. PMID: 29510282
-
Repeat surgery for focal cortical dysplasias in children: indications and outcomes.J Neurosurg Pediatr. 2017 Feb;19(2):174-181. doi: 10.3171/2016.8.PEDS16149. Epub 2016 Nov 11. J Neurosurg Pediatr. 2017. PMID: 27834621
-
Seizure Outcome After Surgery for MRI-Diagnosed Focal Cortical Dysplasia: A Systematic Review and Meta-analysis.Neurology. 2022 Jan 18;98(3):e236-e248. doi: 10.1212/WNL.0000000000013066. Epub 2021 Dec 10. Neurology. 2022. PMID: 34893558
-
5-aminolevulinic acid induced protoporphyrin IX (ALA-PpIX) fluorescence guidance in meningioma surgery.J Neurooncol. 2019 Feb;141(3):555-565. doi: 10.1007/s11060-018-03079-7. Epub 2019 Jan 2. J Neurooncol. 2019. PMID: 30604395 Free PMC article. Review.
Cited by
-
A Raman Imaging Approach Using CD47 Antibody-Labeled SERS Nanoparticles for Identifying Breast Cancer and Its Potential to Guide Surgical Resection.Nanomaterials (Basel). 2018 Nov 20;8(11):953. doi: 10.3390/nano8110953. Nanomaterials (Basel). 2018. PMID: 30463284 Free PMC article.
References
-
- Stummer W, Pichlmeier U, Meinel Tet al.. Fluorescence-guided surgery with 5-aminolevulinic acid for resection of malignant glioma: a randomised controlled multicentre phase III trial. Lancet Oncol. 2006;7(5):392–401. - PubMed
-
- Foster N, Eljamel S. ALA-induced fluorescence image guided surgery of meningiomas: a meta-analyses. Photodiagnosis Photodyn Ther. 2016;15:73–78. - PubMed
-
- Potapov AA, Goryaynov SA, Okhlopkov VAet al.. Laser biospectroscopy and 5-ALA fluorescence navigation as a helpful tool in the meningioma resection. Neurosurg Rev. 2016;39(3):437–447. - PubMed
Publication types
MeSH terms
Substances
Grants and funding
LinkOut - more resources
Full Text Sources
Other Literature Sources
