. 2018 Jul;7(7):464-473.
doi: 10.1002/psp4.12306. Epub 2018 Jun 19.

PBPK Model of Morphine Incorporating Developmental Changes in Hepatic OCT1 and UGT2B7 Proteins to Explain the Variability in Clearances in Neonates and Small Infants

Affiliations

PBPK Model of Morphine Incorporating Developmental Changes in Hepatic OCT1 and UGT2B7 Proteins to Explain the Variability in Clearances in Neonates and Small Infants

Chie Emoto et al. CPT Pharmacometrics Syst Pharmacol. 2018 Jul.

Abstract

Morphine has large pharmacokinetic variability, which is further complicated by developmental changes in neonates and small infants. The impacts of organic cation transporter 1 (OCT1) genotype and changes in blood-flow on morphine clearance (CL) were previously demonstrated in children, whereas changes in UDP-glucuronosyltransferase 2B7 (UGT2B7) activity showed a small effect. This study, targeting neonates and small infants, was designed to assess the influence of developmental changes in OCT1 and UGT2B7 protein expression and modified blood-flow on morphine CL using physiologically based pharmacokinetic (PBPK) modeling. The implementation of these three age-dependent factors into the pediatric system platform resulted in reasonable prediction for an age-dependent increase in morphine CL in these populations. Sensitivity of morphine CL to changes in cardiac output increased with age up to 3 years, whereas sensitivity to changes in UGT2B7 activity decreased. This study suggests that morphine exhibits age-dependent extraction, likely due to the developmental increase in OCT1 and UGT2B7 protein expression/activity and hepatic blood-flow.


Figures

Figure 1
Figure 1
Schematic workflow of pediatric physiologically based pharmacokinetic (PBPK) modeling of morphine and assessment of contributing factors to morphine clearance. The impacts of the ontogeny profiles of organic cation transporter 1 (OCT1) and UDP‐glucuronosyltransferase 2B7 (UGT2B7) protein expression on morphine clearance in pediatric subjects were assessed using the PBPK model with modified pediatric system parameters in the four scenarios summarized in Table 1. (1) Morphine‐specific physiochemical and biochemical parameters were previously developed and evaluated in healthy volunteers and children aged 6–16 years old.16 (2) Ontogeny profile of OCT1 protein expression was modified according to the report by Prasad et al.17 (2016), as described in the Method section. The profile is depicted in Supplementary Figure S1. (3) Ontogeny profile of UGT2B7 protein expression was implemented in the Simcyp Pediatric model (version 16).22 (4) Age‐dependent cardiac output was modified to fit the clinical observations, as described in the Method section. The relationship between age and modified cardiac output (i.e., as a cardiac output scaler) is depicted in Supplementary Figure S2. (5) Age‐dependent change in glomerular filtration rate (GFR) was modified according to the report by Rhodin et al.23 (2009), as described in the Method section. (6) Other age‐dependent anatomical and physiological parameters were summarized in the report by Johnson et al.6 (2006).
Figure 2
Figure 2
Simulated changes in cardiac output with age. Age‐dependent cardiac outputs were generated by multiplying a cardiac output embedded in the Simcyp Simulator, using a scaling factor. The scaler settings are depicted in Supplementary Figure S2. Simulated cardiac output values with the Simcyp Pediatric model as a function of age. (a) The open gray circles represent the simulated changes in cardiac output with age (from birth up to 3 years of age); (b) from birth up to 3 years and from 6–12 years of age. The simulated data are overlaid with observed data: green circle, mean value reported by Walter et al.19; solid black lines, data by Cattermole et al.20 (dashed lines represent the observed minimum and maximum values); solid red lines, data from de Simone et al.21 (dashed lines, data calculated using the reported equation of y = 162 ‐ 1.33 × body weight ± 25). The reported cardiac output values by de Simone et al.21 were estimated using median body weights taken from the World Health Organization child growth standard.35
Figure 3
Figure 3
Comparison between predicted and observed allometrically scaled morphine clearance estimates in pediatric subjects after birth up to 3 years old. Open purple circles represent the simulation results of morphine clearance using the developed physiologically based pharmacokinetic model of morphine incorporating the ontogeny profile of hepatic organic cation transporter 1 (OCT1) or/and UDP‐glucuronosyltransferase 2B7 (UGT2B7) protein expression. Four different combinations of ontogeny status were used in the simulation as indicated above and summarized in Figure 1. Closed circles and bars represent observed data from reported clinical studies: solid black circles, Lynn & Slattery33; filled blue circles, Anand et al.26; filled red circles, Bouwmeester et al.27 and Krekels et al.28; filled yellow circles: Krekels et al.28 and Knibbe et al.29; and black bars, McRorie et al.30
Figure 4
Figure 4
The physiologically based pharmacokinetic (PBPK) model‐predicted vs. observed concentration‐time profiles of morphine in neonates. The PBPK model predicted morphine concentration‐time profiles after the intravenous administration compared with clinical observations in two individual patients in the report by Dahlstrom et al.34 (patient T.T., open circles; and patient A.J., closed circles). (a) Solid gray lines represent individual 500 simulated pharmacokinetic profiles. (b) Solid and dashed lines represent mean, and 5th and 95th percentiles of 500 simulations, respectively. (c) Solid black line represents the simulation in a virtual subject having hepatic organic cation transporter 1 expression of 36 nmol/liver (as liver absolute abundance).
Figure 5
Figure 5
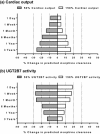
Impact of cardiac output and UDP‐glucuronosyltransferase 2B7 (UGT2B7) activity on predicted morphine clearance in virtual pediatric subjects aged 1 day after birth to 3 years old. (a) Cardiac output was changed from 50% (gray column) to 150% (open column), in which 100% represents a normal value for each subject in the sensitivity analysis. Data are presented as ratio (%) of the predicted morphine clearance with change in cardiac output to that in normal condition. (b) The UGT2B7 activity was changed from 50% (gray column) to 150% (open column), in which 100% represents a normal value for each subject, in the sensitivity analysis. The 50% (gray column) and 150% (open column) changes represent a 50% decrease and a 50% increase in maximal rate of metabolism (Vmax) values of morphine 3‐glucuronization and 6‐glucuronization in normal subjects, respectively. Data are presented as ratio (%) of the predicted morphine clearance with change in UGT2B7 activity to that in the normal condition.
Figure 6
Figure 6
The age‐dependent increase in physiologically based pharmacokinetic‐simulated hepatic extraction of morphine. Hepatic extraction was determined as a ratio of predicted clearance to hepatic blood flow, which was assumed as 28% of cardiac output in this study. Open circles represent individual results from the simulation (N = 100 for each age group), as described in the Method section. Bars represent the geometric mean ± SD. The dotted horizontal line shows the hepatic extraction of morphine in healthy adults.8

Similar articles

Cited by

References

    1. Bion, J.F. et al Sedation in intensive care: morphine and renal function. Intensive Care Med. 12, 359–365 (1986). - PubMed
    1. Nelson, K.L. , Yaster, M. , Kost‐Byerly, S. & Monitto, C.L. A national survey of American Pediatric Anesthesiologists: patient‐controlled analgesia and other intravenous opioid therapies in pediatric acute pain management. Anesth. Analg 110, 754–760 (2010). - PubMed
    1. Tolia, V.N. et al Increasing incidence of the neonatal abstinence syndrome in U.S. neonatal ICUs. N. Engl. J. Med. 372, 2118–2126 (2015). - PubMed
    1. Anderson, B.J. & Holford, N.H. Mechanistic basis of using body size and maturation to predict clearance in humans. Drug Metab. Pharmacokinet. 24, 25–36 (2009). - PubMed
    1. Vinks, A.A. , Emoto, C. & Fukuda, T. Modeling and simulation in pediatric drug therapy: application of pharmacometrics to define the right dose for children. Clin. Pharmacol. Ther. 98, 298–308 (2015). - PubMed

Publication types

LinkOut - more resources