

Exploring the key genes and pathways of side population cells in human osteosarcoma using gene expression array analysis
- PMID: 29921292
- PMCID: PMC6006685
- DOI: 10.1186/s13018-018-0860-8
Exploring the key genes and pathways of side population cells in human osteosarcoma using gene expression array analysis
Abstract
Background: Human osteosarcoma (OS) is one of the most common primary bone sarcoma, because of early metastasis and few treatment strategies. It has been reported that the tumorigenicity and self-renewal capacity of side population (SP) cells play roles in human OS via regulating of target genes. This study aims to complement the differentially expressed genes (DEGs) that regulated between the SP cells and the non-SP cells from primary human OS and identify their functions and molecular pathways associated with OS.
Methods: The gene expression profile GSE63390 was downloaded, and bioinformatics analysis was made.
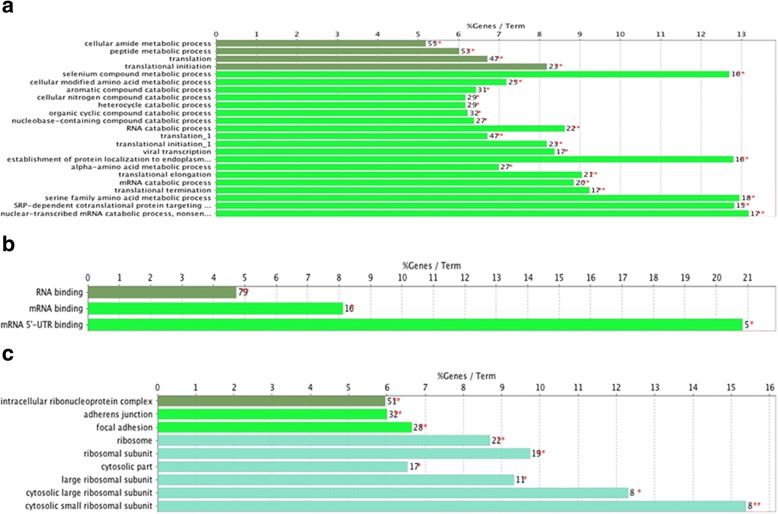
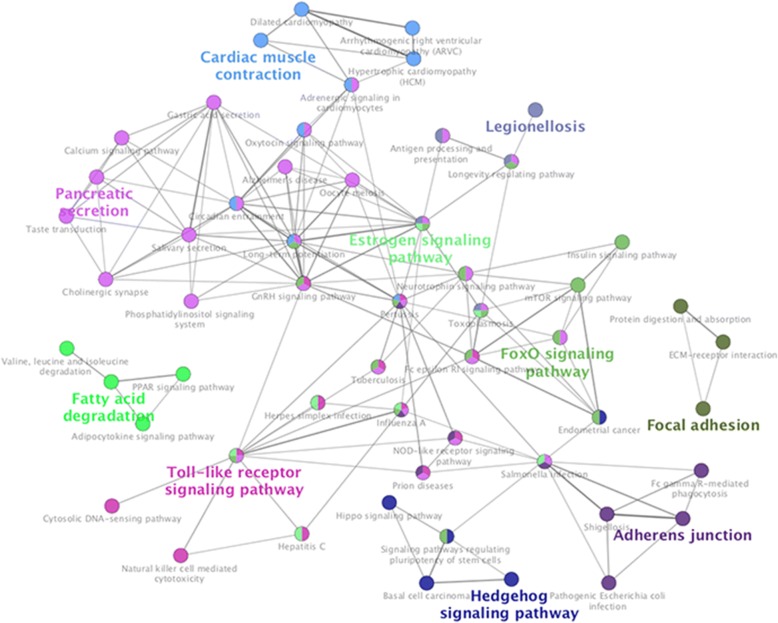
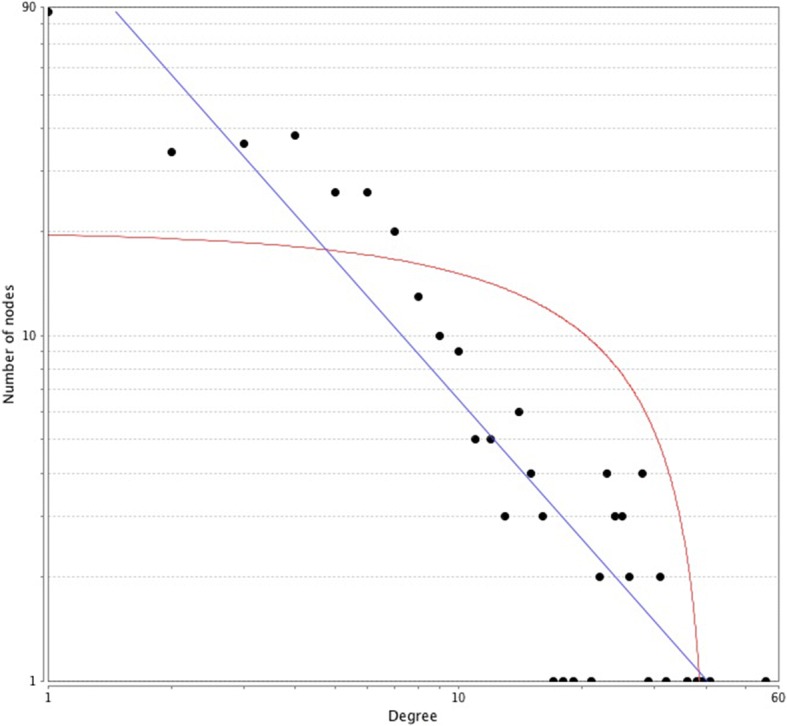
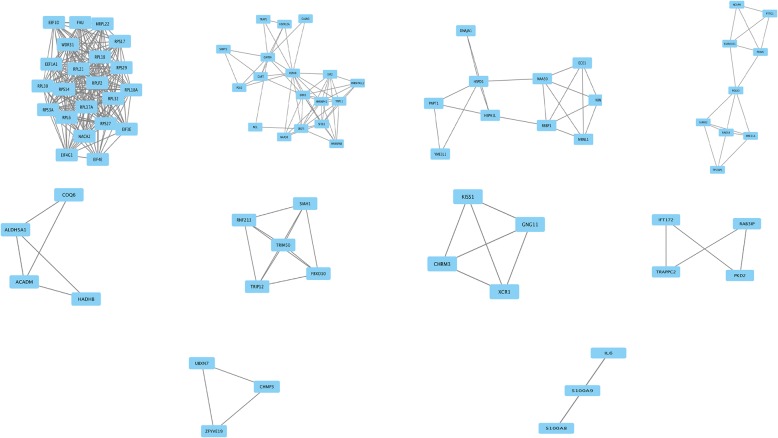
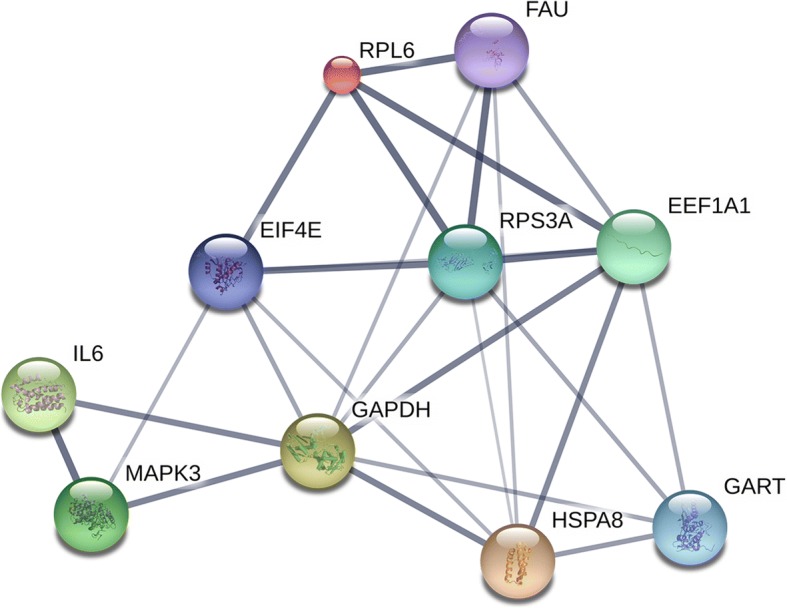
Results: One hundred forty-one DEGs totally were identified. Among them, 72 DEGs (51.06%) were overexpressed, and the remaining 69 DEGs (48.94%) were underexpressed. Gene ontology (GO) and pathway enrichment analysis of target genes were performed. We furthermore identified some relevant core genes using gene-gene interaction network analysis such as EIF4E, FAU, HSPD1, IL-6, and KISS1, which may have a relationship with the development process of OS. We also discovered that EIF4E/mTOR signaling pathway could be a potential research target for therapy and tumorigenesis of OS.
Conclusion: This analysis provides a comprehensive understanding of the roles of DEGs coming from SP cells in the development of OS. However, these predictions need further experimental validation in future studies.
Keywords: Bioinformatics analysis; Differentially expressed genes; Osteosarcoma; Side population cells.
Conflict of interest statement
Ethics approval and consent to participate
Not applicable. This paper does not involve research on humans.
Consent for publication
Not applicable.
Competing interests
The authors declare that they have no competing interests.
Publisher’s Note
Springer Nature remains neutral with regard to jurisdictional claims in published maps and institutional affiliations.
Figures
Similar articles
-
Circular RNAs hsa_circ_0032462, hsa_circ_0028173, hsa_circ_0005909 are predicted to promote CADM1 expression by functioning as miRNAs sponge in human osteosarcoma.PLoS One. 2018 Aug 28;13(8):e0202896. doi: 10.1371/journal.pone.0202896. eCollection 2018. PLoS One. 2018. PMID: 30153287 Free PMC article.
-
Expression of miR‑542‑3p in osteosarcoma with miRNA microarray data, and its potential signaling pathways.Mol Med Rep. 2019 Feb;19(2):974-983. doi: 10.3892/mmr.2018.9761. Epub 2018 Dec 13. Mol Med Rep. 2019. PMID: 30569116 Free PMC article.
-
Identifications of genetic differences between metastatic and non-metastatic osteosarcoma samples based on bioinformatics analysis.Med Oncol. 2015 May;32(5):153. doi: 10.1007/s12032-015-0604-0. Epub 2015 Apr 2. Med Oncol. 2015. PMID: 25832865
-
Identification of hub genes specific to pulmonary metastasis in osteosarcoma through integrated bioinformatics analysis.Technol Health Care. 2022;30(3):735-745. doi: 10.3233/THC-213163. Technol Health Care. 2022. PMID: 34542049
-
Identification of key genes in osteosarcoma by meta‑analysis of gene expression microarray.Mol Med Rep. 2019 Oct;20(4):3075-3084. doi: 10.3892/mmr.2019.10543. Epub 2019 Jul 31. Mol Med Rep. 2019. PMID: 31432118 Free PMC article.
Cited by
-
Proteomic profiling and identification of significant markers from high-grade osteosarcoma after cryotherapy and irradiation.Sci Rep. 2020 Feb 7;10(1):2105. doi: 10.1038/s41598-019-56024-7. Sci Rep. 2020. PMID: 32034162 Free PMC article.
-
Chemoresistance-Related Stem Cell Signaling in Osteosarcoma and Its Plausible Contribution to Poor Therapeutic Response: A Discussion That Still Matters.Int J Mol Sci. 2022 Sep 27;23(19):11416. doi: 10.3390/ijms231911416. Int J Mol Sci. 2022. PMID: 36232719 Free PMC article. Review.
-
Nanoparticle enhanced combination therapy for stem-like progenitors defined by single-cell transcriptomics in chemotherapy-resistant osteosarcoma.Signal Transduct Target Ther. 2020 Sep 25;5(1):196. doi: 10.1038/s41392-020-00248-x. Signal Transduct Target Ther. 2020. PMID: 32973147 Free PMC article.
References
MeSH terms
LinkOut - more resources
Full Text Sources
Other Literature Sources
Medical
Research Materials
Miscellaneous
