. 2018 Aug 6;217(8):2951-2974.
doi: 10.1083/jcb.201804042. Epub 2018 Jun 19.

Mammary molecular portraits reveal lineage-specific features and progenitor cell vulnerabilities

Affiliations

Mammary molecular portraits reveal lineage-specific features and progenitor cell vulnerabilities

Alison E Casey et al. J Cell Biol. .

Abstract

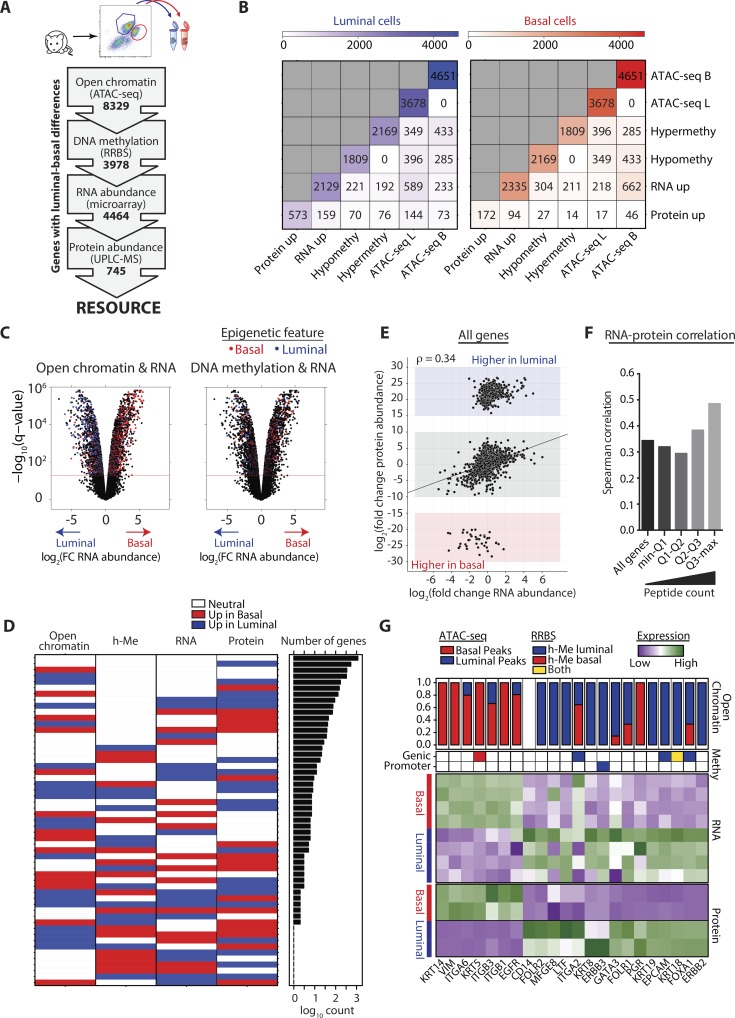
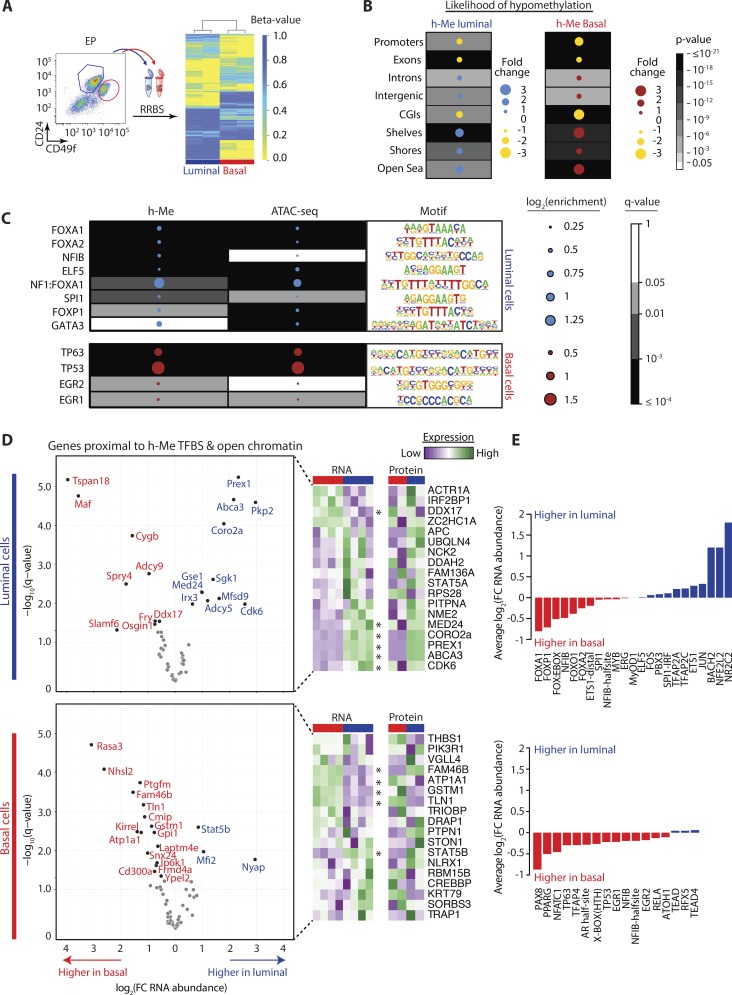
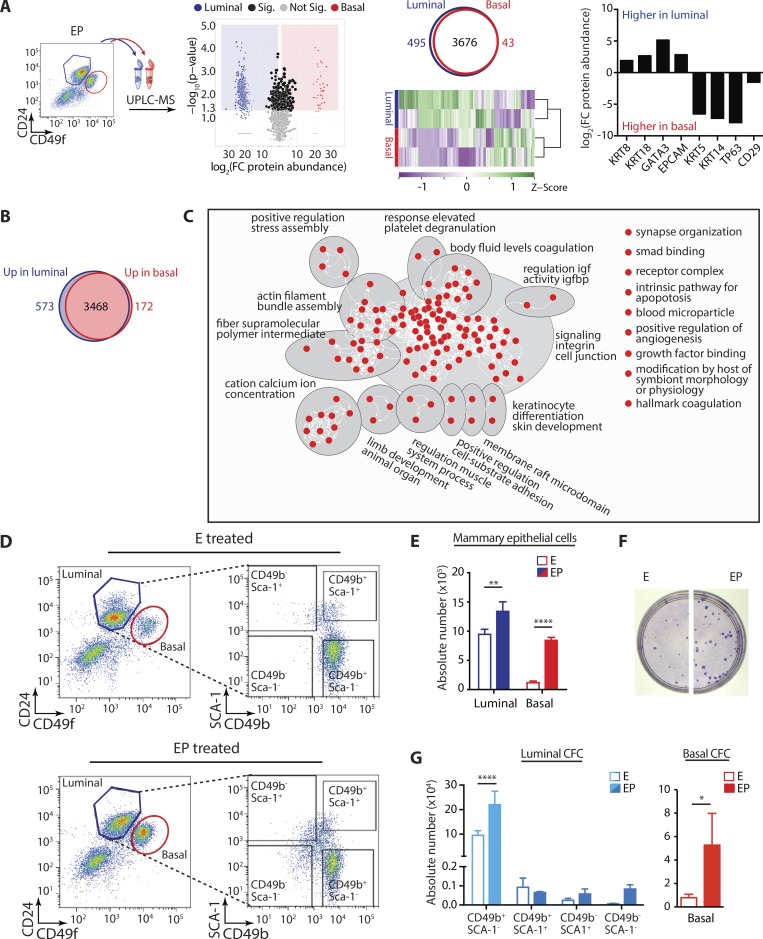
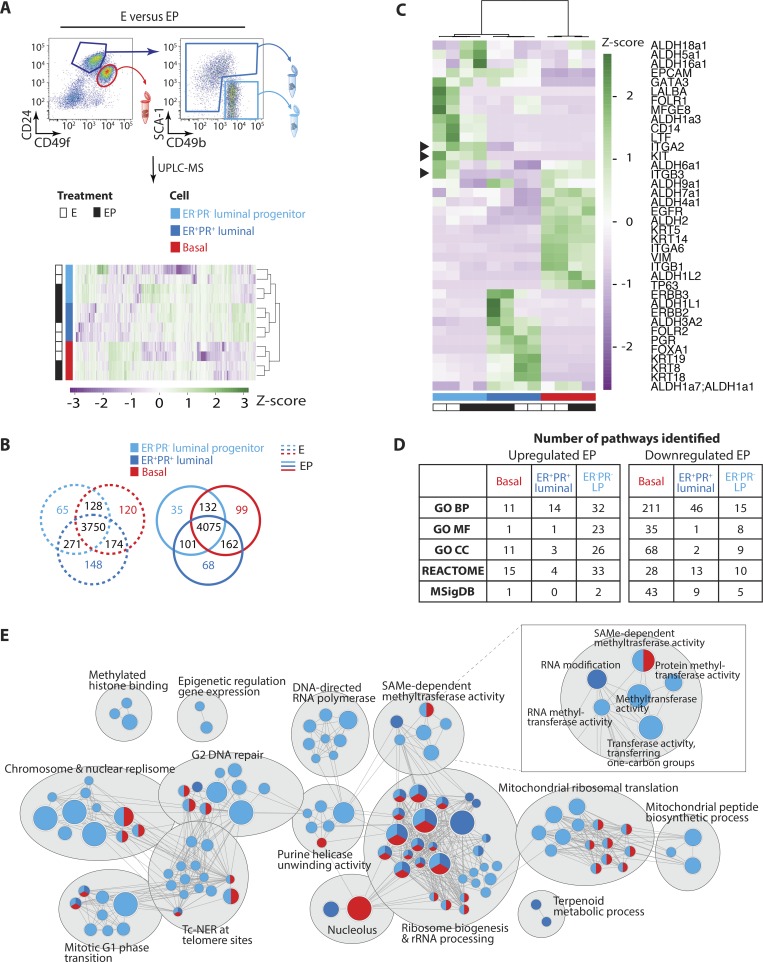
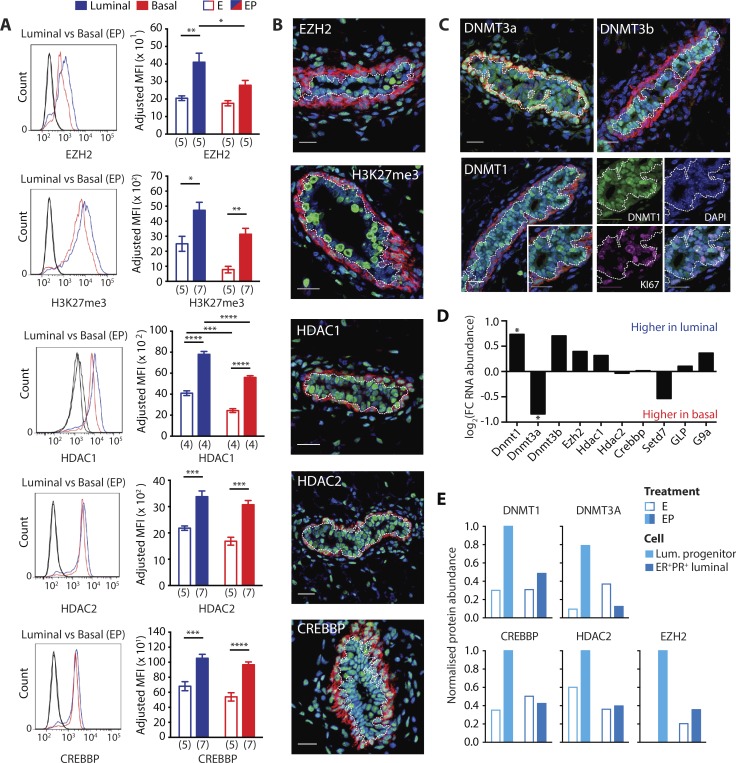
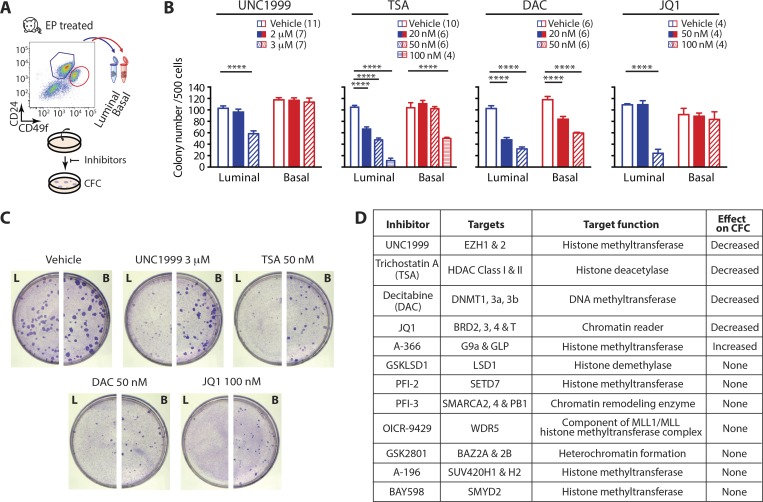
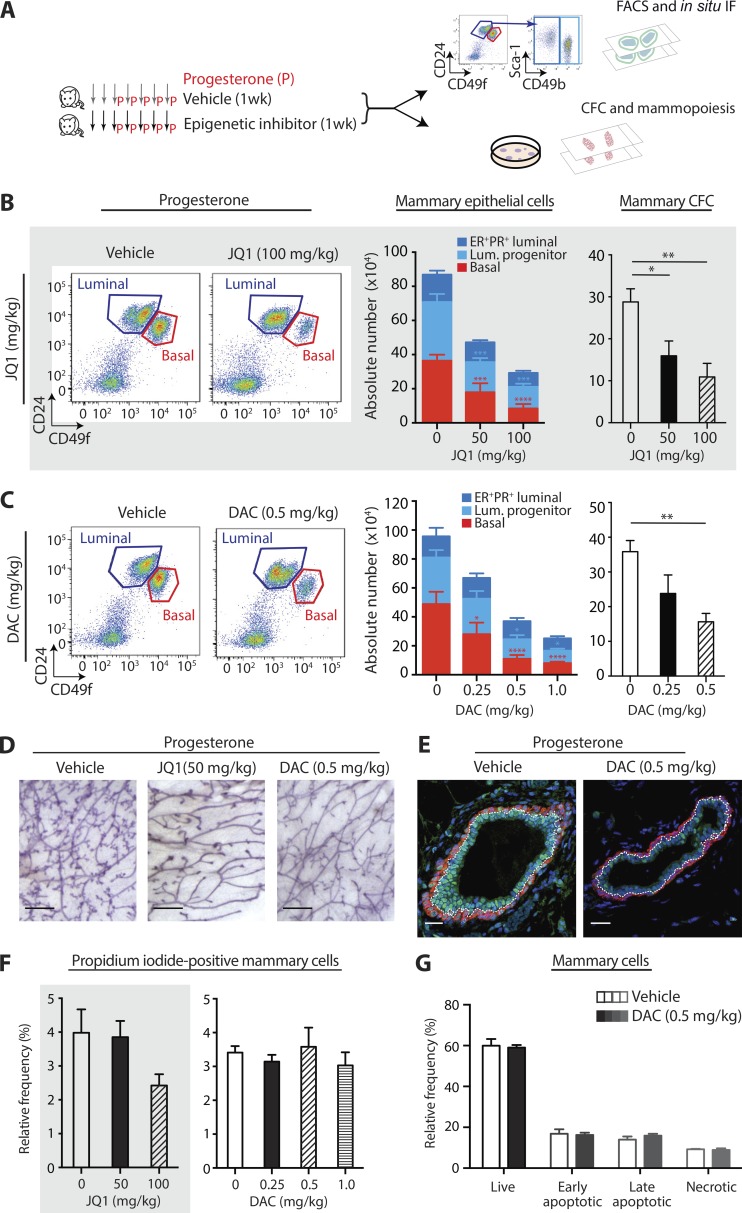
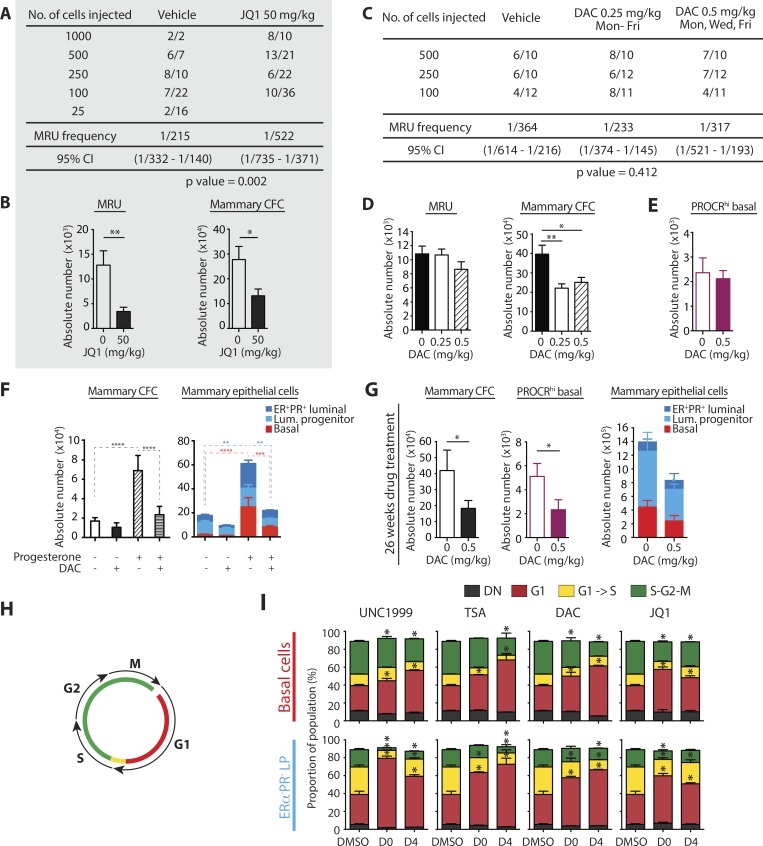
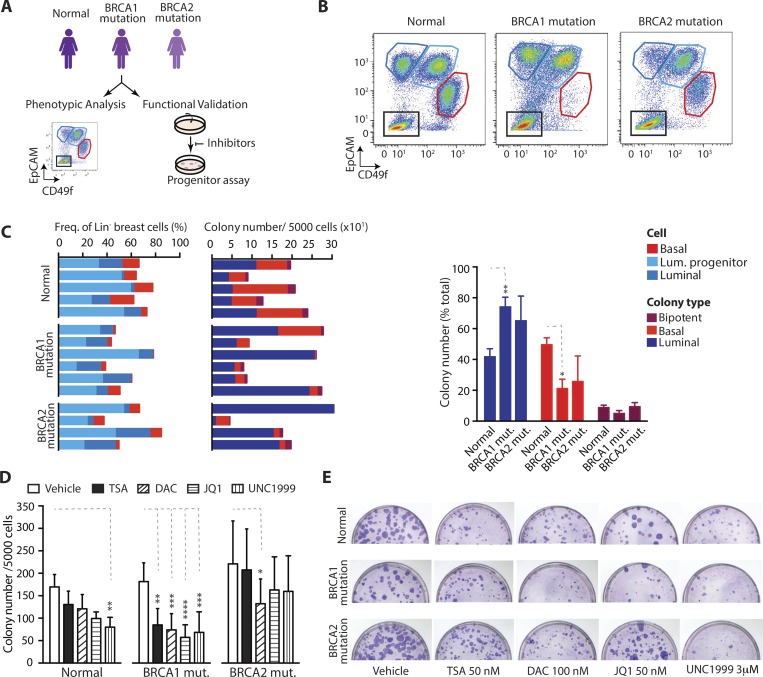
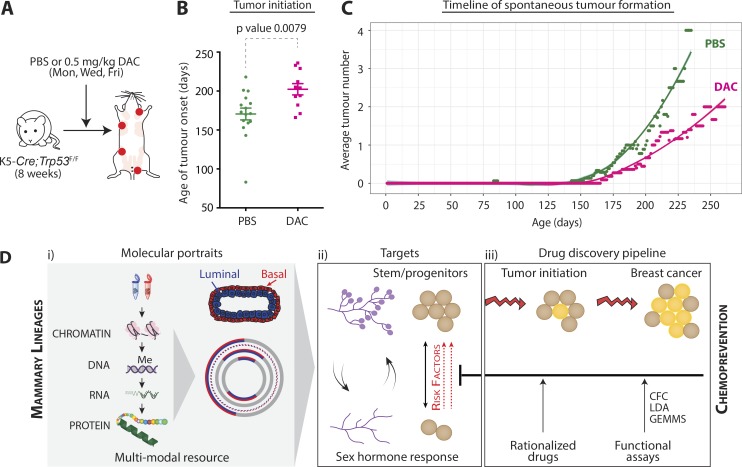
The mammary epithelium depends on specific lineages and their stem and progenitor function to accommodate hormone-triggered physiological demands in the adult female. Perturbations of these lineages underpin breast cancer risk, yet our understanding of normal mammary cell composition is incomplete. Here, we build a multimodal resource for the adult gland through comprehensive profiling of primary cell epigenomes, transcriptomes, and proteomes. We define systems-level relationships between chromatin-DNA-RNA-protein states, identify lineage-specific DNA methylation of transcription factor binding sites, and pinpoint proteins underlying progesterone responsiveness. Comparative proteomics of estrogen and progesterone receptor-positive and -negative cell populations, extensive target validation, and drug testing lead to discovery of stem and progenitor cell vulnerabilities. Top epigenetic drugs exert cytostatic effects; prevent adult mammary cell expansion, clonogenicity, and mammopoiesis; and deplete stem cell frequency. Select drugs also abrogate human breast progenitor cell activity in normal and high-risk patient samples. This integrative computational and functional study provides fundamental insight into mammary lineage and stem cell biology.


Figures

Figure 1.
Figure 1.
Integrated proteomic, transcriptomic and epigenomic profiling of basal and luminal mammary cells. (A) Schematic depicts analyses performed on EP-treated basal and luminal cells. Biological replicates: ATAC-seq, RRBS, and UPLC-MS, n = 2; microarray, n = 4. (B) Tables show numbers of genes associated with protein or RNA up-regulation, DNA hypo- or hypermethylation, and lineage-restricted ATAC-seq peaks, in basal (B) and luminal (L) cells. (C) Volcano plots show log2(fold change RNA abundance) across mammary cell compartments; color coding shows genes associated with ATAC-seq peaks or DNA hypomethylation specific to basal/luminal cells. (D) Heatmap depicts genes classified based on their relationship states between open chromatin, DNA hypomethylation (h-Me), RNA, and protein abundances. Bar plot shows the number of genes in each state on a log10 scale. (E) Graph shows log2(fold change) of RNA versus protein abundance of all genes found in both microarray and UPLC-MS datasets. (F) Graph shows Spearman’s correlation (ρ) of log2(fold change) in RNA versus protein abundance. Genes were divided into quantiles (Q1–Q4) based on their peptide counts (biological replicates: UPLC-MS, n = 2; microarray, n = 4). (G) Heatmaps show z-scores of protein and RNA abundance of known marker proteins in basal and luminal subsets. Color coding indicates gene hypomethylation, and bar chart shows the relative proportion of total ATAC-seq peaks detected in basal or luminal cells.
Figure 2.
Figure 2.
TFBSs are hypomethylated in basal and luminal cells. (A) RRBS of basal and luminal cells from EP-treated mice (biological replicates, n = 2). Heatmap shows unsupervised hierarchical clustering and β-values of luminal and basal subsets. (B) Dot maps show likelihood of DNA hypomethylation (h-Me) occurring at specific gene locations or in different types of methylation regions. (C) Dot maps show log2(enrichment over background) and q-values for TFBS that are hypomethylated and/or enriched in open chromatin regions in basal or luminal cells. Tables show HOMER motif logos. (D) Volcano plots show differences in RNA abundance for genes located near h-Me TFBS and open chromatin, in basal and luminal cells. Heatmaps show RNA and protein abundance of proximal genes identified in both transcriptomic and proteomic datasets; asterisks mark genes with significant differences in RNA abundance across mammary lineages. (E) Bar charts show mean log2(fold change) in RNA abundance for all genes proximal to the indicated h-Me TFBS, in basal or luminal cells.
Figure 3.
Figure 3.
Progesterone stimulates expansion of basal and luminal progenitor cells. (A) UPLC-MS of basal and luminal cells from EP-treated mice (biological replicates, n = 2). Volcano plot shows differential protein expression in mammary cell compartments. Proteins detected in only one compartment are shown in blue (luminal) or red (basal); proteins detected in both lineages and altered across compartments are shown in black (fold-change ≥2, P ≤ 0.05). Venn diagram depicts number of identified proteins per cell compartment. Heatmap shows unsupervised hierarchical clustering and z-scores of protein abundance across basal and luminal subsets. Bar chart shows log2(fold change) in luminal and basal marker protein abundance. (B) Venn diagram depicts number of proteins differentially expressed across the basal and luminal mammary lineages (≥2-fold change, P < 0.05). (C) Enrichment map summarizes results of GSEA pathway analysis for proteins up-regulated in basal compared with luminal cells (FDR ≤0.05). Up-regulated pathways include regulation of insulin-like growth factor (IGF) activity by insulin-like growth factor binding protein (IGFBP). Nodes represent biological pathways that were automatically annotated and organized into themes using Cytoscape; biological themes are labeled and depicted via gray ellipses. (D) Left: Flow cytometry analysis of luminal (CD24+CD49flo) and basal (CD24CD49fhi) primary mammary cells, purified from three pairs of glands (second, third, and fourth) of E- or EP-treated mice. Right: The luminal subset further subdivided using the CD49b and SCA-1 cell-surface markers (Shehata et al., 2012). (E) Bar chart shows absolute number of basal and luminal cells from E- or EP-treated mice; biological replicates, n = 3; error bars represent SD. (F) Photographs of representative CD49b+SCA-1- luminal CFC plate from E- versus EP-treated mice. (G) Bar charts show absolute number of CFC within the different luminal or basal subsets, in E- or EP-treated mice (n = 3, error bars represent SD). (E and G) Statistical significance was calculated using two-tailed t test (basal CFC; *, P < 0.05) or two-way ANOVA and Sidak’s multiple comparisons test (mammary epithelial cells, luminal CFC). Multiple comparisons testing was performed with a 0.05 significance level and 95% confidence interval. Statistically significant differences are indicated by asterisks, which denote size of significance levels. **, P ≤ 0.01; ****, P < 0.0001.
Figure 4.
Figure 4.
Defining the protein composition and hormone responsiveness of mammary epithelial subsets. (A) UPLC-MS of ERPR basal, ERPR luminal progenitor, and ER+PR+ luminal cells from E- and EP-treated mice (biological replicates, n = 2). Heatmap shows unsupervised hierarchical clustering and z-scores of protein expression across samples. (B) Venn diagrams depict number of proteins identified in ERPR basal, ERPR luminal progenitor, or ER+PR+ luminal cells after E or EP treatment. (C) Heatmap shows unsupervised hierarchical clustering and marker protein expression across cell compartments and hormone states. Arrowheads denote ITGA2/CD49b, c-KIT, and ITGB3/CD61 luminal progenitor marker proteins. (D) Tables summarize GSEA results, detailing the numbers and types of gene sets enriched for proteins up- or down-regulated by progesterone in each mammary subpopulation (FDR ≤0.05). (E) Enrichment map visualizes results of GSEA for proteins up-regulated in EP compared with E proteomes. Nodes represent biological pathways that were automatically annotated and organized into themes using Cytoscape; biological themes are labeled and depicted via gray ellipses. Colors of nodes show which cell types were enriched for specific pathways (FDR ≤0.05), with multicolored nodes depicting pathways up-regulated by progesterone in two or more subpopulations: ERPR basal (red), ERPR luminal progenitor (light blue), and ER+PR+ luminal (darker blue) cells. Node size is proportional to the number of associated genes.
Figure 5.
Figure 5.
Lineage specificity and hormone responsiveness of epigenetic master regulators. (A) Intracellular flow cytometry of epigenetic targets in mammary epithelial cells. Example histograms show intensity staining for proteins compared with isotype Fc controls (black) in basal (red) and luminal (blue) cells on a log scale. Bar charts show adjusted MFI for each mammary population. Number of biological replicates is shown in brackets under graphs. Error bars represent SEM. Statistical significance was calculated using two-way ANOVA and Tukey’s multiple comparisons test performed with a 0.05 significance level and 95% confidence interval. Statistically significant differences are indicated by asterisks, which denote size of significance levels. (B and C) IF staining of mammary ductal structures in EP-treated mice: DAPI (blue), Ki67 (magenta), basal lineage marker KRT14 (red), and indicated epigenetic marks or proteins (green). Luminal/basal border is depicted by a dotted white line. Bars, 20 µm. (D) Bar chart shows log2(fold change RNA abundance) for epigenetic proteins in EP-treated basal and luminal cells, determined by microarray (biological replicates, n = 4); asterisk denotes significantly altered genes (q < 0.05). (E) Bar charts show maximum normalized protein abundance of epigenetic proteins in ERPR luminal progenitor and ER+PR+ luminal cells, taken from E- and EP-treated mice as determined by UPLC-MS (biological replicates, n = 2). *, P ≤ 0.05; **, P ≤ 0.01; ***, P ≤ 0.001; ****, P < 0.0001.
Figure 6.
Figure 6.
Epigenetic targeting exposes mouse mammary progenitor cell vulnerabilities. (A) Workflow schematic for epigenetic drug testing. (B) Bar charts show number of basal and luminal colonies formed with vehicle control or the indicated concentrations of epigenomic inhibitors. Number of biological replicates per drug treatment is shown in brackets. Error bars represent SEM. Statistical significance was calculated using two-way ANOVA and Dunnett’s multiple comparisons test performed with a 0.05 significance level and 95% confidence interval. Statistically significant differences are indicated by asterisks, which denote size of significance levels. ****, P < 0.0001. (C) Photographs of representative luminal (L) and basal (B) colony assay plates. (D) Summary of compounds tested and their targets and effects against mammary progenitor function.
Figure 7.
Figure 7.
DAC and JQ1 prevent adult progenitor cell expansion and mammopoiesis in vivo. (A) Workflow schematic for in vivo drug testing. (B and C) Flow cytometry analysis of luminal (CD24+CD49flo) and basal (CD24CD49fhi) mammary subsets. Primary mammary cells were purified from the two inguinal glands of mice treated for 1 wk with vehicle, JQ1 (gray background), or DAC (clear background), + progesterone. Left: Bar charts show absolute number of ERPR basal, ERPR luminal progenitor, and ER+PR+ luminal cells, which were further purified using the CD49b and SCA-1 cell-surface markers. Right: Bar charts show absolute number of CFC. Error bars for all bar charts represent SEM. Statistical significance was calculated using one-way (absolute CFC) or two-way (absolute ERPR basal, ERPR luminal progenitor, and ER+PR+ luminal) ANOVA followed by Dunnett’s multiple comparisons test. All multiple comparisons testing was performed with a 0.05 significance level and 95% confidence interval; statistically significant differences are indicated by asterisks, which denote size of significance levels. In B, biological replicates: n ≥ 7 left stacked bar charts, n ≥ 4 right CFC bar chart; in C, biological replicates: n ≥ 4. (D) Representative whole mounts from mice treated with vehicle or indicated epigenetic drug. Bars, 1 mm. (E) IF staining of mammary ductal structures: DAPI (blue), basal lineage marker KRT14 (red), and DNMT1 (green). Luminal/basal border is depicted by a white dotted line. Bars, 20 µm. (F) Bar charts show relative frequency of primary mammary dead cells purified from the two inguinal glands of mice treated for 1 wk with JQ1 (gray background) or DAC, + progesterone. Dead cells were determined via propidium iodide staining; biological replicates: n ≥7 (JQ1) or n ≥4 (DAC). Statistical significance was tested for using one-way ANOVA followed by Dunnett’s multiple comparisons test; no comparisons were found to be statistically significant. (G) Bar charts show relative frequency of early- and late-apoptotic mammary cells after treatment with 0.5 mg/kg DAC, three weekly doses for 4 wk, determined via annexin V and propidium iodide staining. Biological replicates, n = 5. Statistical significance was tested using two-way ANOVA followed by Sidak’s multiple comparison test; no comparisons were found to be statistically significant. *, P ≤ 0.05; **, P ≤ 0.01.
Figure 8.
Figure 8.
Effects of epigenetic drugs on adult stem cell expansion and mammary cell cycle. (A and C) Comparison of LDA take rates of total mammary cells purified from donor mice treated with vehicle or the indicated epigenetic inhibitors, + progesterone. Take rate is defined as a positive outgrowth. Cells were subsequently purified from the two inguinal glands for CFC assay. MRU frequencies for LDA experiments were calculated using ELDA software and a 95% confidence interval (Hu and Smyth, 2009). (B and D) Bar charts show absolute number of MRU and mammary CFC from the same total cell populations; all error bars represent SEM. Statistical significance was calculated using unpaired t test (*, P ≤ 0.05; **, P ≤ 0.01). (A and B) Donor mice were treated with progesterone + either vehicle or JQ1 (50 mg/kg, five weekly doses; gray background). Biological replicates: vehicle, n = 4; JQ1, n = 6. (C and D) Donor mice were treated with progesterone + either vehicle or DAC (0.25 mg/kg, five weekly doses; 0.5 mg/kg, three weekly doses; clear background). Biological replicates, n = 6. (E) Bar chart shows absolute number of PROCRhi basal cells in mice treated with vehicle or DAC for 4 wk (0.5 mg/kg, three weekly doses); biological replicates, n = 5, error bars represent SEM. (F) Mice were treated with vehicle or 1 mg/kg DAC for 5 d + either sesame oil or progesterone. Biological replicates, n = 4; cells were purified from the two inguinal glands. Left: Bar chart shows absolute number of total mammary CFC. Right: Bar chart shows absolute number of ER-PR- basal, ERPR luminal progenitor, and ER+PR+ luminal cells. Error bars represent SEM. Statistical significance was calculated using one-way ANOVA (absolute CFC) or two-way ANOVA (absolute ERPR basal, ERPR luminal progenitor, and ER+PR+ luminal) followed by Tukey’s multiple comparisons test. (G) Mice were treated with vehicle or DAC for 26 wk (0.5 mg/kg, three weekly doses); biological replicates, n = 3. Bar charts shows absolute number of total mammary CFC (left), PROCRhi basal cells (middle), and ER-PR- basal, ER-PR- luminal progenitor, and ER+PR+ luminal cells (right). Cells were purified from the two inguinal mammary glands; all error bars represent SEM. Statistical significance was calculated using unpaired t test (absolute CFC or PROCRhi basal cells) or two-way ANOVA followed by Sidak’s multiple comparisons test. (H) Schematic of the Fucci2 reporter mouse transgenic system. (I) Basal or ERPR luminal progenitor cells were FACS-sorted, plated in 2D clonogenic assays, and treated with vehicle or epigenetic drugs: 3 µM UNC1999, 50 nM TSA, 50 nM DAC, or 75 nM JQ1. Drugs were added on day 0 or 4 of a colony-forming assay, with bar charts showing the proportion of cells in different phases of the cell cycle at day 7, determined by flow cytometry. Biological replicates, n = 3; all error bars represent SEM. Statistical significance was calculated using two-way ANOVA followed by Dunnett’s multiple comparisons test. For all panels, all multiple comparisons testing was performed with a 0.05 significance level and 95% confidence interval. Statistically significant differences are indicated by asterisks, which denote P < 0.05. *, P ≤ 0.05; **, P ≤ 0.01.
Figure 9.
Figure 9.
Epigenetic targeting of normal and high-risk human breast progenitor cells. (A) Workflow schematic. (B) Example flow cytometry plots of dissociated breast cells from normal and high-risk BRCA1 or BRCA2 mutation carrying patients. Plots show basal (EpCAM-/lowCD49f+), luminal progenitor (EpCAM+CD49f+), and luminal (EpCAM+CD49f) cells. (C) Left: Bar chart shows relative proportions of human basal (red), luminal progenitor (light blue), and luminal (darker blue) cells in samples from individual women, assayed by flow cytometry. Middle: Bar chart shows numbers and types of unsorted, total colonies formed from the same patient samples. Right: Bar chart shows percentage of colonies that are luminal, basal, or bipotent in different patient groups (biological replicates, n = 4–6). For bar chart on the right, error bars represent SEM, and statistical significance was calculated using two-way ANOVA and Tukey’s multiple comparisons test. (D) Bar chart shows number of colonies formed from normal and BRCA1 and BRCA2 mutation carrying patient specimens, treated with vehicle or the indicated concentrations of epigenetic inhibitors. Biological replicates, n = 4–6; error bars represent SEM. Statistical significance was calculated using two-way ANOVA and Dunnett’s multiple comparisons test. All multiple comparisons tests were performed with a 0.05 significance level and 95% confidence interval. Statistically significant differences are indicated by asterisks, which denote size of significance levels. (E) Photographs of representative colony assay plates. *, P ≤ 0.05; **, P ≤ 0.01; ***, P ≤ 0.001; ****, P < 0.0001.
Figure 10.
Figure 10.
DAC delays mammary tumor formation. (A) Workflow schematic; red dots designate breast tumors at end point. (B) Graph shows time to first, spontaneous breast tumor formation in K5-Cre;Trp53F/F mice treated with vehicle or 0.5 mg/kg DAC three times weekly, from 8 wk of age onward. Error bars represent SEM. Statistical significance was calculated using unpaired, two-tailed t test. (C) Graph shows mean number of palpable tumors in K5-Cre;Trp53F/F mice treated with vehicle or DAC, plotted against age in days; shading shows local regression (Loess)-fitted smooth curve. Number of biological replicates for PBS- and DAC-treated mice, n = 16 and 11, respectively. (D) Model depicting how mammary molecular portraits can be used to garner new insight into the basal and luminal epithelial lineages, identify adult stem and progenitor vulnerabilities, and discover drug targets for breast cancer chemoprevention.

References

    1. Abe T., Sakaue-Sawano A., Kiyonari H., Shioi G., Inoue K., Horiuchi T., Nakao K., Miyawaki A., Aizawa S., and Fujimori T.. 2013. Visualization of cell cycle in mouse embryos with Fucci2 reporter directed by Rosa26 promoter. Development. 140:237–246. 10.1242/dev.084111 - DOI - PubMed
    1. Akalin A., Kormaksson M., Li S., Garrett-Bakelman F.E., Figueroa M.E., Melnick A., and Mason C.E.. 2012. methylKit: A comprehensive R package for the analysis of genome-wide DNA methylation profiles. Genome Biol. 13:R87 10.1186/gb-2012-13-10-r87 - DOI - PMC - PubMed
    1. Asselin-Labat M.-L., Vaillant F., Sheridan J.M., Pal B., Wu D., Simpson E.R., Yasuda H., Smyth G.K., Martin T.J., Lindeman G.J., and Visvader J.E.. 2010. Control of mammary stem cell function by steroid hormone signalling. Nature. 465:798–802. 10.1038/nature09027 - DOI - PubMed
    1. Buenrostro J.D., Giresi P.G., Zaba L.C., Chang H.Y., and Greenleaf W.J.. 2013. Transposition of native chromatin for fast and sensitive epigenomic profiling of open chromatin, DNA-binding proteins and nucleosome position. Nat. Methods. 10:1213–1218. 10.1038/nmeth.2688 - DOI - PMC - PubMed
    1. Cardiff R.D., and Wellings S.R.. 1999. The comparative pathology of human and mouse mammary glands. J. Mammary Gland Biol. Neoplasia. 4:105–122. 10.1023/A:1018712905244 - DOI - PubMed

Publication types

MeSH terms