

How, When, and Where Relic DNA Affects Microbial Diversity
- PMID: 29921664
- PMCID: PMC6016248
- DOI: 10.1128/mBio.00637-18
How, When, and Where Relic DNA Affects Microbial Diversity
Abstract
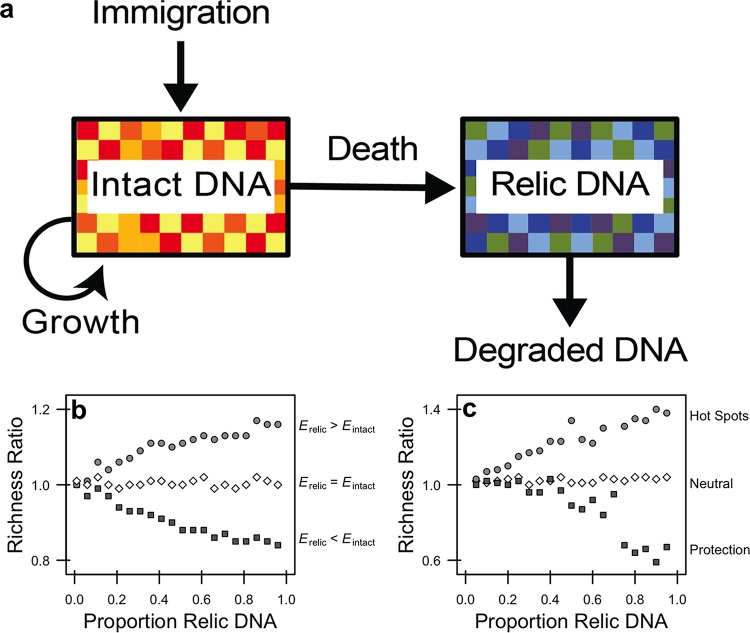
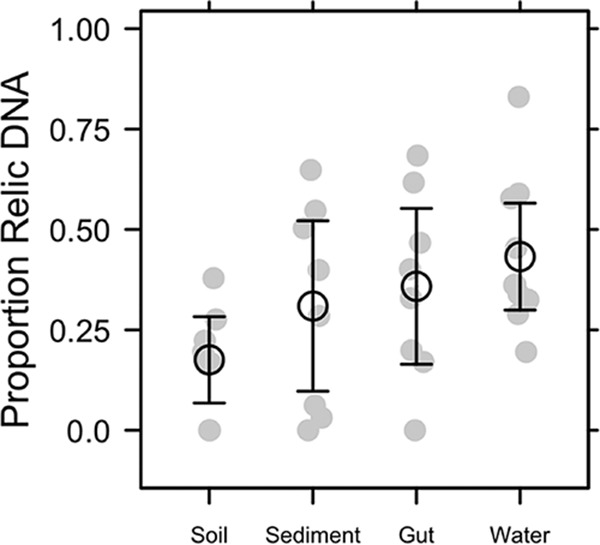
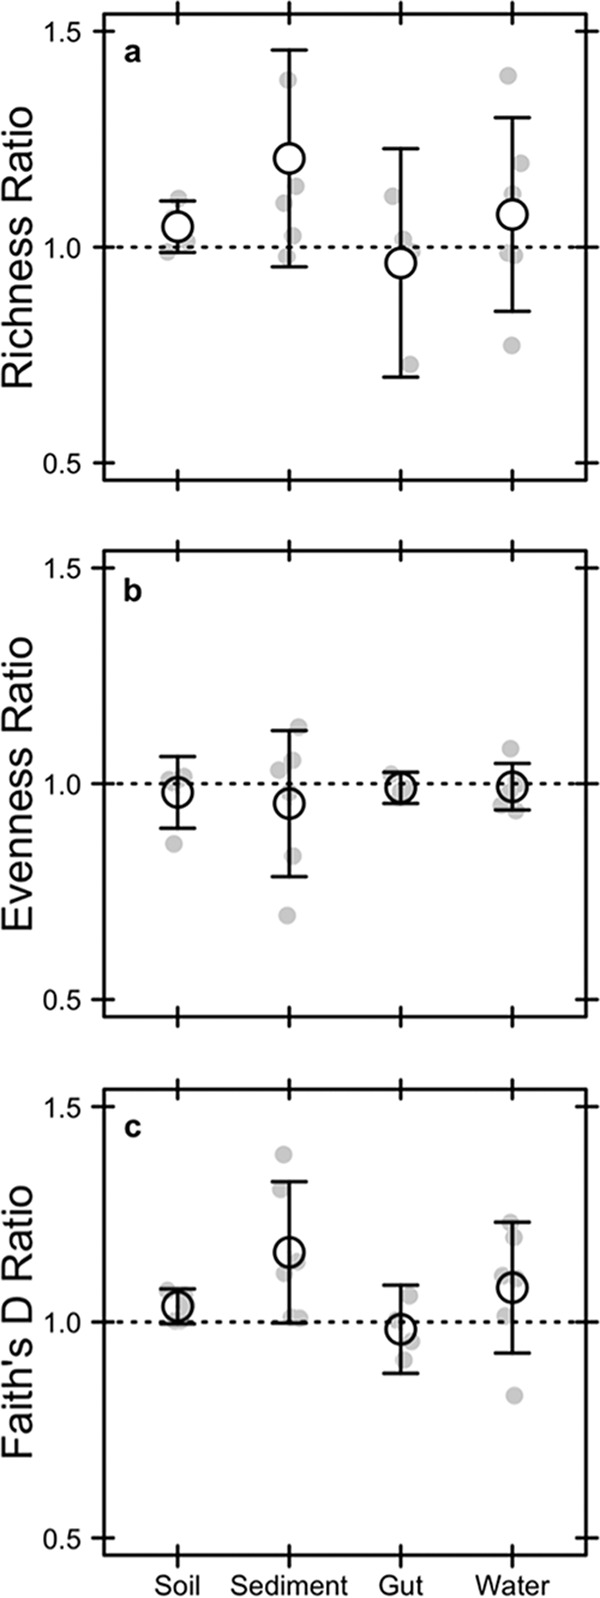
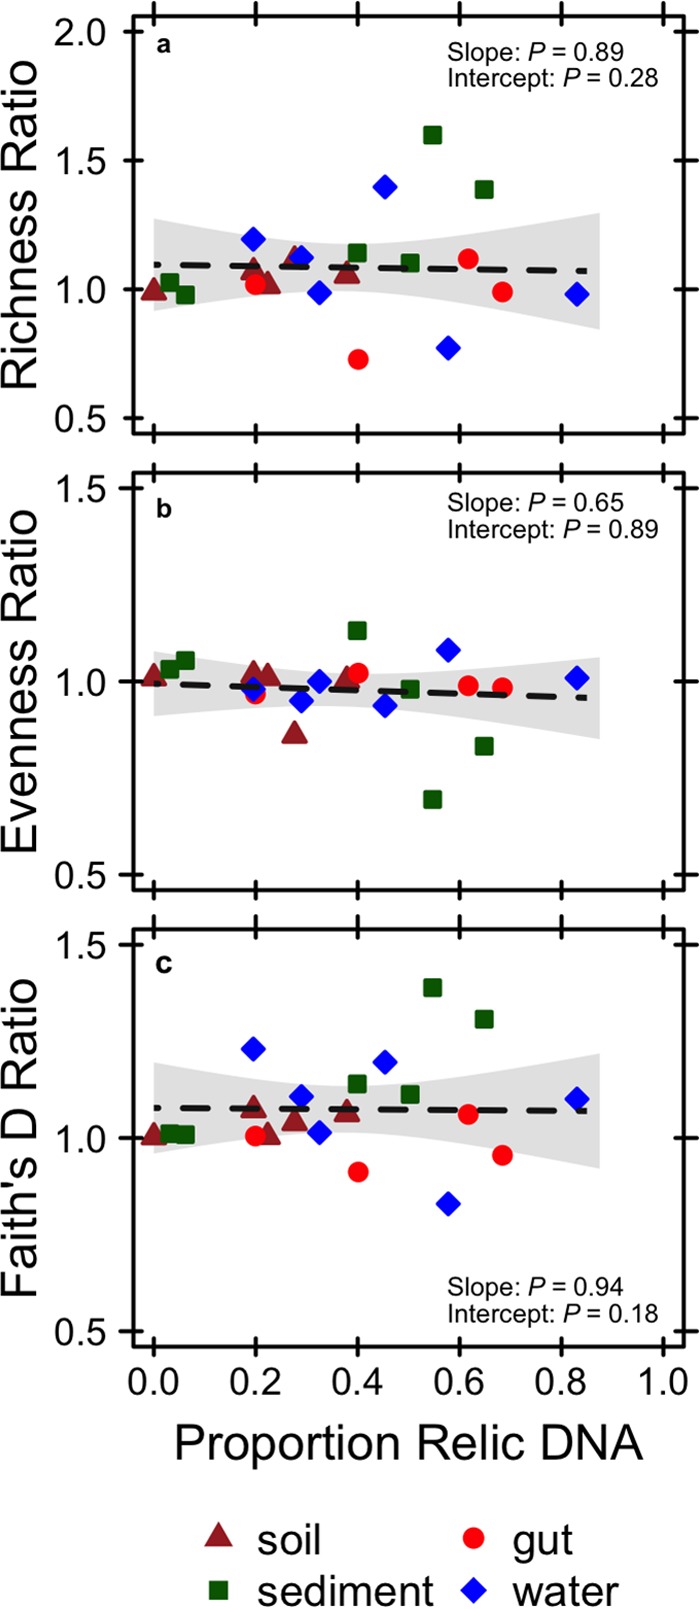
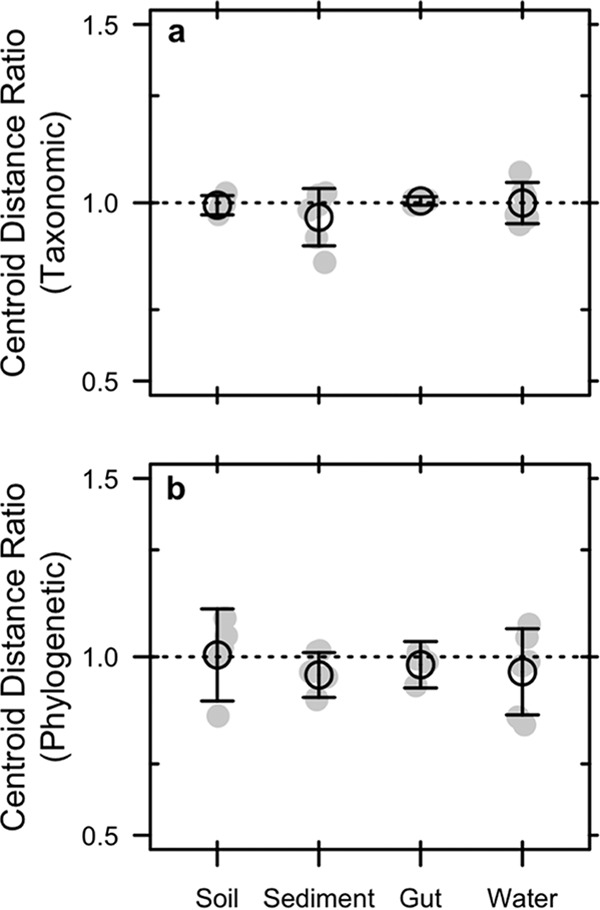
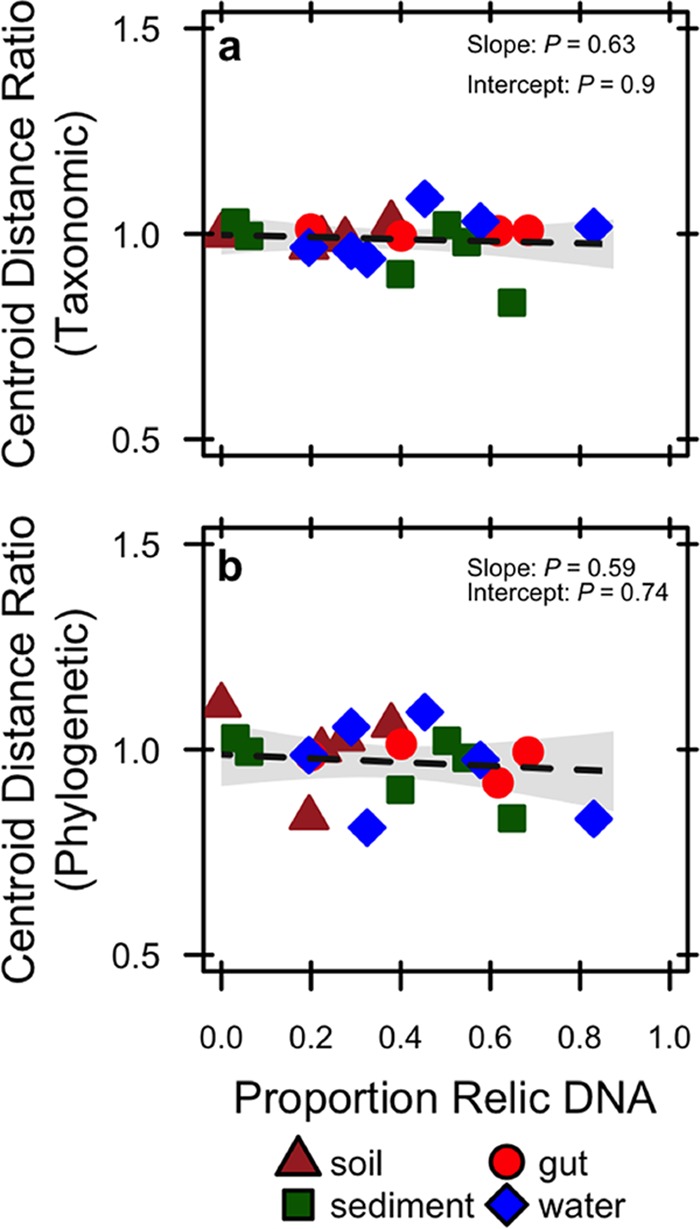
Extracellular or "relic" DNA is one of the largest pools of nucleic acids in the biosphere. Relic DNA can influence a number of important ecological and evolutionary processes, but it may also affect estimates of microbial abundance and diversity, which has implications for understanding environmental, engineered, and host-associated ecosystems. We developed models capturing the fundamental processes that regulate the size and composition of the relic DNA pools to identify scenarios leading to biased estimates of biodiversity. Our models predict that bias increases with relic DNA pool size, but only when the species abundance distributions (SADs) of relic and intact DNA are distinct from one another. We evaluated our model predictions by quantifying relic DNA and assessing its contribution to bacterial diversity using 16S rRNA gene sequences collected from different ecosystem types, including soil, sediment, water, and the mammalian gut. On average, relic DNA made up 33% of the total bacterial DNA pool but exceeded 80% in some samples. Despite its abundance, relic DNA had a minimal effect on estimates of taxonomic and phylogenetic diversity, even in ecosystems where processes such as the physical protection of relic DNA are common and predicted by our models to generate bias. Our findings are consistent with the expectation that relic DNA from different taxa degrades at a constant and equal rate, suggesting that it may not fundamentally alter estimates of microbial diversity.IMPORTANCE The ability to rapidly obtain millions of gene sequences and transcripts from a range of environments has greatly advanced understanding of the processes that regulate microbial communities. However, nucleic acids extracted from complex samples do not come only from viable microorganisms. Dead microorganisms can generate large pools of relic DNA that distort insight into the ecology and evolution of microbial systems. Here, we develop a conceptual and quantitative framework for understanding how relic DNA influences the structure of microbiomes. Our theoretical models and empirical results demonstrate that a large relic DNA pool does not automatically lead to biased estimates of microbial diversity. Rather, relic DNA effects emerge in combination with microscale processes that alter the commonness and rarity of sequences found in heterogeneous DNA pools.
Keywords: biodiversity; ecology; extracellular DNA; mathematical modeling; phylogenetic analysis; sampling theory.
Copyright © 2018 Lennon et al.
Figures
Similar articles
-
Phylogenetic and Functional Diversity of Total (DNA) and Expressed (RNA) Bacterial Communities in Urban Green Infrastructure Bioswale Soils.Appl Environ Microbiol. 2017 Aug 1;83(16):e00287-17. doi: 10.1128/AEM.00287-17. Print 2017 Aug 15. Appl Environ Microbiol. 2017. PMID: 28576763 Free PMC article.
-
Relic DNA effects on the estimates of bacterial community composition and taxa dynamics in soil.Appl Microbiol Biotechnol. 2023 Jun;107(12):4109-4117. doi: 10.1007/s00253-023-12576-3. Epub 2023 May 16. Appl Microbiol Biotechnol. 2023. PMID: 37191685
-
Relic DNA obscures bacterial diversity and interactions in ballast tank sediment.Environ Res. 2025 Feb 15;267:120715. doi: 10.1016/j.envres.2024.120715. Epub 2024 Dec 28. Environ Res. 2025. PMID: 39733986
-
Community Assembly Processes of the Microbial Rare Biosphere.Trends Microbiol. 2018 Sep;26(9):738-747. doi: 10.1016/j.tim.2018.02.011. Epub 2018 Mar 14. Trends Microbiol. 2018. PMID: 29550356 Review.
-
Deciphering Diversity Indices for a Better Understanding of Microbial Communities.J Microbiol Biotechnol. 2017 Dec 28;27(12):2089-2093. doi: 10.4014/jmb.1709.09027. J Microbiol Biotechnol. 2017. PMID: 29032640 Review.
Cited by
-
Temperature-gradient incubation isolates multiple competitive species from a single environmental sample.Access Microbiol. 2019 Dec 2;2(3):acmi000081. doi: 10.1099/acmi.0.000081. eCollection 2020. Access Microbiol. 2019. PMID: 32974564 Free PMC article.
-
Risk Assessment of Industrial Microbes Using a Terrestrial Mesocosm Platform.Microb Ecol. 2023 Dec 11;87(1):12. doi: 10.1007/s00248-023-02321-8. Microb Ecol. 2023. PMID: 38072911 Free PMC article.
-
Evidence for a Growth Zone for Deep-Subsurface Microbial Clades in Near-Surface Anoxic Sediments.Appl Environ Microbiol. 2020 Sep 17;86(19):e00877-20. doi: 10.1128/AEM.00877-20. Print 2020 Sep 17. Appl Environ Microbiol. 2020. PMID: 32709727 Free PMC article.
-
Spatial Variability of Antarctic Surface Snow Bacterial Communities.Front Microbiol. 2019 Mar 26;10:461. doi: 10.3389/fmicb.2019.00461. eCollection 2019. Front Microbiol. 2019. PMID: 30972032 Free PMC article.
-
Predominance of Anaerobic, Spore-Forming Bacteria in Metabolically Active Microbial Communities from Ancient Siberian Permafrost.Appl Environ Microbiol. 2019 Jul 18;85(15):e00560-19. doi: 10.1128/AEM.00560-19. Print 2019 Aug 1. Appl Environ Microbiol. 2019. PMID: 31152014 Free PMC article.
References
-
- Klein DA. 2007. Microbial communities in nature: a postgenomic perspective. Microbe 2:591–595. doi:10.1128/microbe.2.591.1. - DOI
MeSH terms
Substances
LinkOut - more resources
Full Text Sources
Other Literature Sources
