. 2018 Jun 19;9(1):2404.
doi: 10.1038/s41467-018-04495-z.

Patient derived organoids to model rare prostate cancer phenotypes

Affiliations

Patient derived organoids to model rare prostate cancer phenotypes

Loredana Puca et al. Nat Commun. .

Abstract

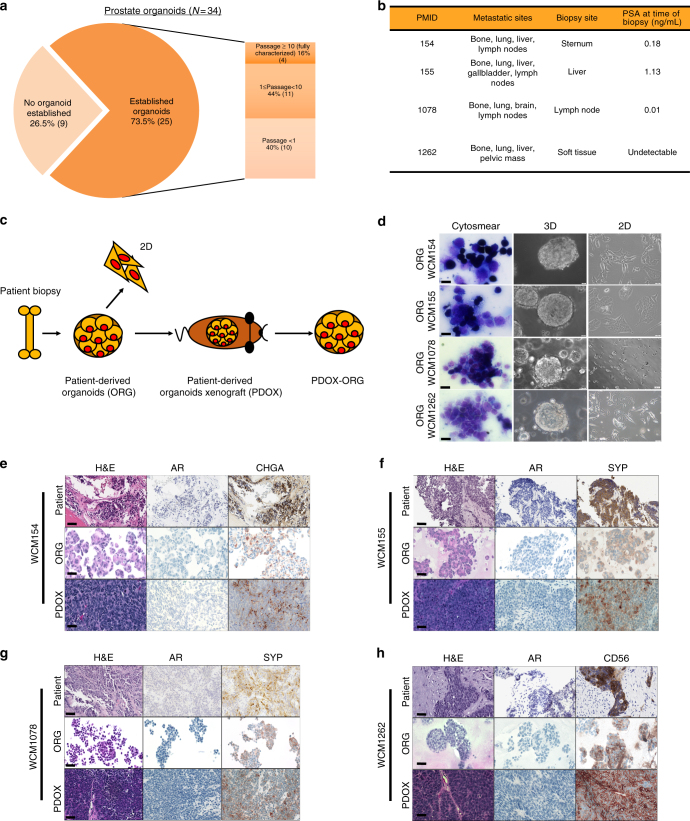
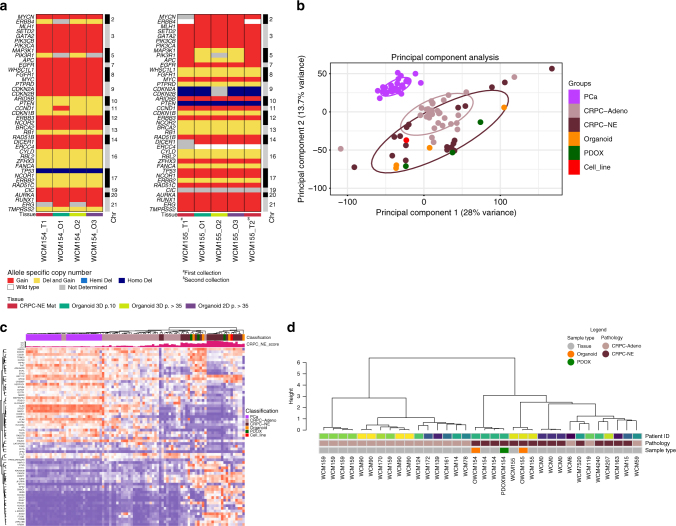
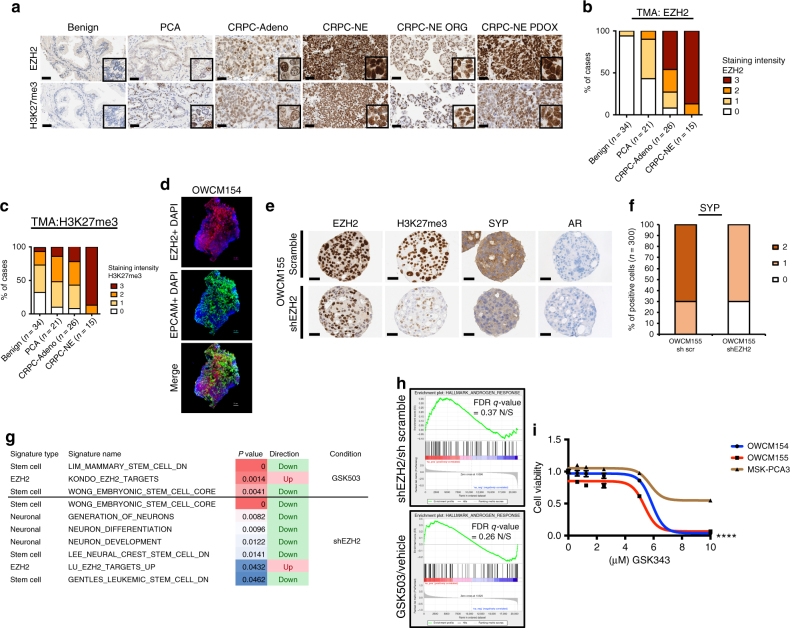
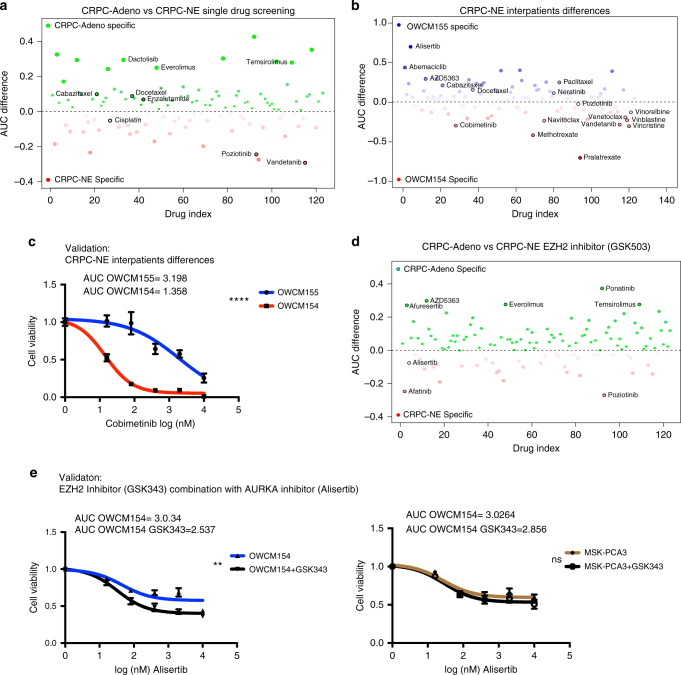
A major hurdle in the study of rare tumors is a lack of existing preclinical models. Neuroendocrine prostate cancer is an uncommon and aggressive histologic variant of prostate cancer that may arise de novo or as a mechanism of treatment resistance in patients with pre-existing castration-resistant prostate cancer. There are few available models to study neuroendocrine prostate cancer. Here, we report the generation and characterization of tumor organoids derived from needle biopsies of metastatic lesions from four patients. We demonstrate genomic, transcriptomic, and epigenomic concordance between organoids and their corresponding patient tumors. We utilize these organoids to understand the biologic role of the epigenetic modifier EZH2 in driving molecular programs associated with neuroendocrine prostate cancer progression. High-throughput organoid drug screening nominated single agents and drug combinations suggesting repurposing opportunities. This proof of principle study represents a strategy for the study of rare cancer phenotypes.


Conflict of interest statement

R.S. and R.R. are employees of SEngine Precision Medicine. C.G. has ownership interest (including patents) in SEngine Precision Medicine. The remaining authors declare no competing interests.

Figures

Fig. 1
Fig. 1
Development of patient-derived neuroendocrine prostate cancer models. a Pie chart of prostate cancer needle biopsies considered for the generation of organoids. No organoid established (light orange) represents no viable cells or no cellular material was found in culture after enzymatical digestion of the tissue. Established organoids (p < 1, lighter orange or 1 >p > 10 orange) refers to the presence of clusters of viable cells in culture that became senescent after few passages in culture. Passage >10, dark orange, indicates organoids that have been successfully grown in culture, molecularly characterized and used for functional studies and PDOX development. b Table of clinical data and biopsy sites of fully characterized CRPC-NE organoids. c Schematic view of the models generated from needle biopsies. In the scheme a patient biopsy is processed to generate 3D organoids (ORG). 3D organoids are then used to generate 2D cultures (2D) and also engrafted in an NSG mouse to grow patient-derived organoids xenograft (PDOX) and consequent organoids derived from the PDX (PDOX-ORG). d Air Dried Diff-Quick stained smears of organoids from small cell neuroendocrine prostate carcinoma and high grade adenocarcinomas with neuroendocrine features organoids (×40, scale bar 50 μm). Bright field image analysis (×40 magnification for 3D, ×20 magnification for 2D, scale bar 100 μm) of 3D and 2D organoids. eh Histology images of native tumor biopsy tissue (Patient) compared with corresponding 3D organoid cultures (ORG), patient-derived organoids xenograft tissue PDOX (×20 magnification, scare bar 100 μm patient images, ×40, scale bar 50 μm for models). Samples are stained with hematoxylin-and-eosin (H&E) and immunohistochemistry (IHC) for AR, synaptophysin (SYP), chromogranin A (CHGA), and CD56
Fig. 2
Fig. 2
Molecular characterization of patient-derived neuroendocrine prostate cancer models. a Allele-specific copy number of selected genes in organoids at different passages over time. b Transcriptomic analysis via principle component analysis including 26 PCA, 33 CRPC-Adeno, 13 CRPC-NE patient samples and CRPC-NE organoids (orange), CRPC-NE PDOX (green), NIC-H660 cell line (red) using RNAseq expression (FPKMS) of ~20k genes. c Clustering of study cohort samples using genes involved in CRPC-NE phenotype, based on RNAseq Expression (FPKMS). The cohort of localized prostate adenocarcinoma PCA (pink), CPRC-Adeno (mauve), and CRPC-NE (brown) patients (cohort from Beltran et al.) CRPC-NE organoids (orange), CRPC-NE PDOX (green), NIC-H660 cell line (red). The green barplot on the top of the heatmap represents the CRPC-NE score (range from 0, low to 1, high) calculated according to methodologies described in Beltran et al.. d Genome-wide DNA methylation cluster analysis using a cohort of CPRC-Adeno (mauve) and CRPC-NE (brown) patients together with models generated (organoids in orange and PDOX in green)
Fig. 3
Fig. 3
Manipulation of EZH2 in CRPC-NE models affects neuroendocrine-associated programs and tumor cell viability. a Representative EZH2 IHC images of benign prostate, localized prostate cancer (PCA), CRPC-Adeno and CRPC-NE patient tissue, representative CRPC-NE organoids, and corresponding PDOX. Tissue is stained with EZH2 and H3K27me3 antibodies (×20 magnification, scale bar 100 μm, inset ×40). b Bar plots scoring analysis of tissue staining intensity using EZH2 and H3K27me3 antibodies. The cases are represented as % and the number of cases is indicated in the figure. EZH2 and H3K27me3 staining intensity vary from 0 (no to minimal intensity) to 4 (high intensity). c Immunofluorescence staining of OWCM154 using EZH2 (Alexa Fluor® 555) and APC anti-human EPCAM and 4′,6-diamidino-2-phenylindole, dihydrochloride (DAPI) (scale bar 30 μm). d Immunohistochemistry of OWCM155 organoids infected with sh scramble or shEZH2. Organoids are stained using EZH2, H3K27me3, synaptophysin (SYP), and AR antibodies. (×40 objective, scale bar 50 μm). e Bar plot scoring analysis of SYP staining intensity in shEZH2 versus sh scramble. Staining intensity is calculated from 0 (no to minimal intensity) to 2 (medium-high intensity). Three hundred cells have been evaluated for the scoring. f GSEA table of signatures (EZH2 targets, Neuronal and Stem Cell) that are significantly enriched in organoids treated with shEZH2 compared to scramble and in organoids treated with GSK503 compared to vehicle treatment. These signatures are ranked based on p value (from 0.05 to 0.001) and FDR < 0.25. g GSEA enrichment plot of the AR pathway genes in organoids infected with shEZH2 versus scramble or treated with EZH2 inhibitor (GSK503) or vehicle. h Cell viability assay (Cell-Title Glo) of OWCM154 (blue), OWCM155 (red), MSK-PCA3 (dark orange) after 11 days of treatment with vehicle or indicated doses of GSK343 (n = 9, for each treatment dose, error bars: s.e.m.) Two-way ANOVA test is used, ****p < 0.0001 (OWCM154 vs MSK-PCA3 and OWCM155 vs MSK-PCA3)
Fig. 4
Fig. 4
High-throughput drug screening in organoids identifies novel single agents and combination therapies for CRPC-NE. a High-throughput drug screen in CRPC-NE organoids (OWCM154 OWCM155) vs control CRPC-Adeno organoids (MSK-PCA3 MSK-PCA2). The y-axis is the AUC (area under the curve) differential of the mean of the CRPC-NE samples – the mean of the CRPC-Adeno samples. Compounds indicated in red are specific for CRPC-NE while compounds indicated in blue are specific for CRPC-Adeno. Highlighted compounds are clinically relevant and represent a subclass of drugs. b High-throughput drug screen single agent analysis of differences in sensitivity within the CRPC-NE samples. c Cell viability assay using vehicle or different doses of cobimetinib in OWCM154 and OWCM155 (n = 9, for each treatment dose, error bars: s.e.m.), two-way ANOVA test is used. ****p < 0.0001. d High-throughput drug combination screen in CRPC-NE organoids (OWCM154, OWCM155) vs CRPC-Adeno organoids (MSK-PCA3, MSK-PCA2). GSK503 has been added to the drug screening plate at IC30. The y-axis is the AUC differential of the mean of the CRPC-NE samples – the mean of the CRPC-Adeno samples. Compounds indicated in red are more effective for CRPC-NE in combination with GSK503 while compounds indicated in blue are more effective for CRPC-Adeno in combination with GSK503. e Cell viability assay for high-throughput drug combination screen validation. Organoids are treated with a fixed dose of GSK343 (5 μM) and escalated doses of alisertib. The organoids treated with alisertib in combination with GSK343 are represented with a black line while the organoids treated with alisertib plus DMSO are represented in blue (n = 9, for each treatment dose, error bars, s.e.m.). Two-way ANOVA test is used. Alisertib-GSK503 combination in OWCM154 has p < 0.00.27, (**) while in MSK-PCA3 is not significant (ns)

References

    1. Siegel RL, Miller KD, Jemal A. Cancer statistics, 2018. CA Cancer J. Clin. 2018;68:7–30. doi: 10.3322/caac.21442. - DOI - PubMed
    1. Fizazi K, et al. Abiraterone plus prednisone in metastatic, castration-sensitive prostate cancer. N. Engl. J. Med. 2017;377:352–360. doi: 10.1056/NEJMoa1704174. - DOI - PubMed
    1. James ND, et al. Abiraterone for prostate cancer not previously treated with hormone therapy. N. Engl. J. Med. 2017;377:338–351. doi: 10.1056/NEJMoa1702900. - DOI - PMC - PubMed
    1. Bluemn EG, et al. Androgen receptor pathway-independent prostate cancer is sustained through FGF signaling. Cancer Cell. 2017;32:474–489.e476. doi: 10.1016/j.ccell.2017.09.003. - DOI - PMC - PubMed
    1. Wang HT, et al. Neuroendocrine prostate cancer (NEPC) progressing from conventional prostatic adenocarcinoma: factors associated with time to development of NEPC and survival from NEPC diagnosis-a systematic review and pooled analysis. J. Clin. Oncol. 2014;32:3383–3390. doi: 10.1200/JCO.2013.54.3553. - DOI - PubMed

Publication types

MeSH terms

Substances