. 2018 Jun 19;9(1):2308.
doi: 10.1038/s41467-018-04579-w.

A modular transcriptional signature identifies phenotypic heterogeneity of human tuberculosis infection

Affiliations

A modular transcriptional signature identifies phenotypic heterogeneity of human tuberculosis infection

Akul Singhania et al. Nat Commun. .

Abstract

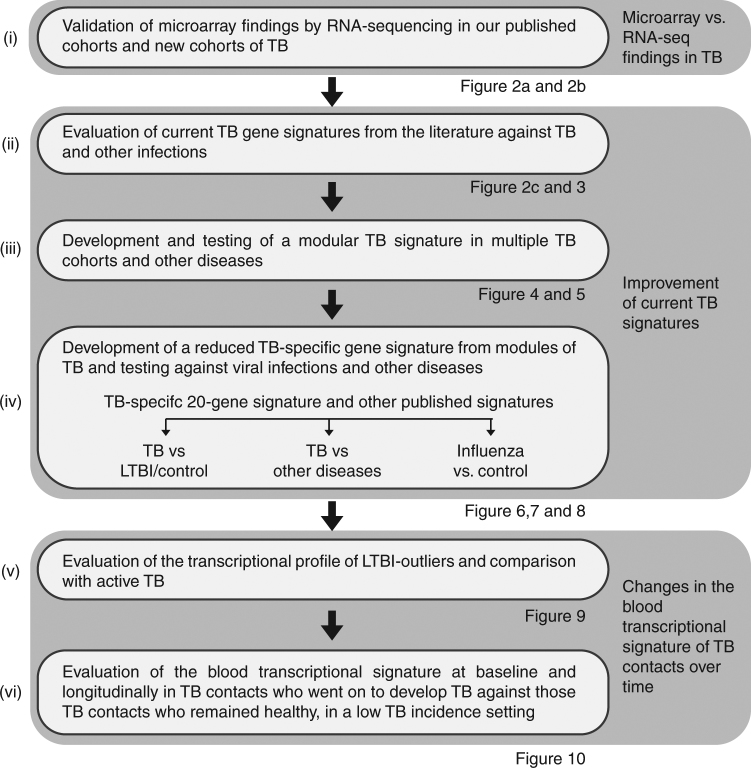
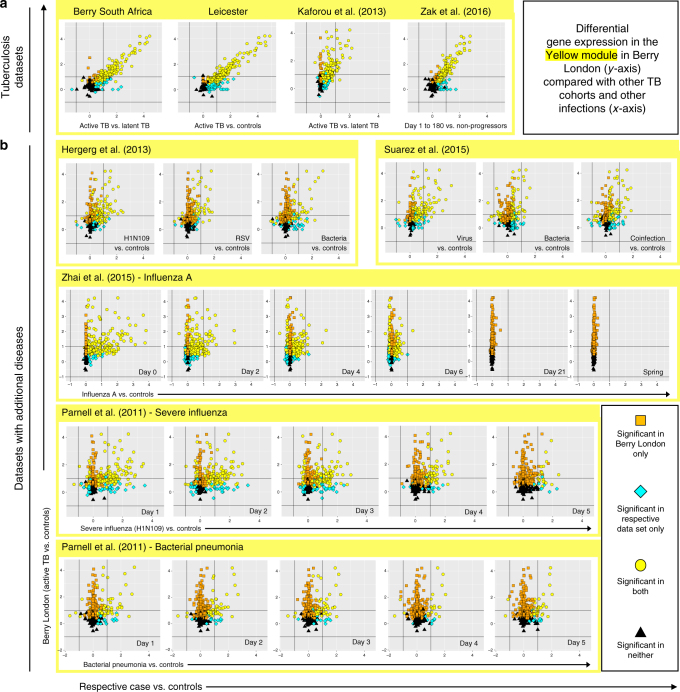
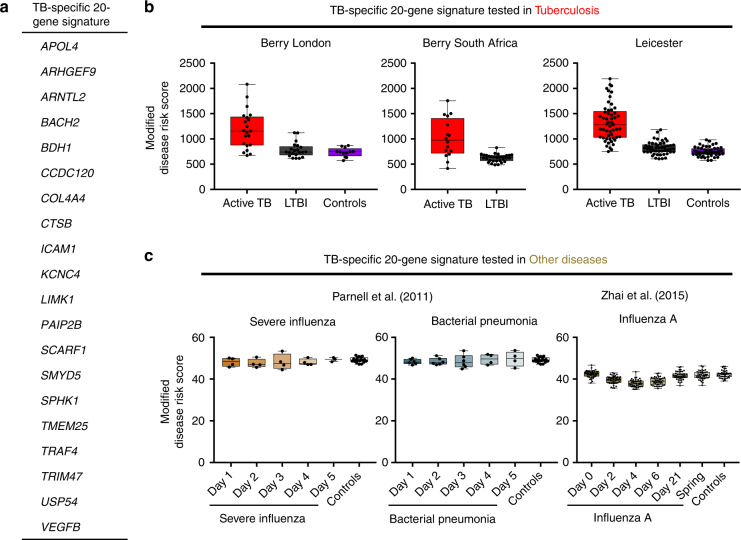
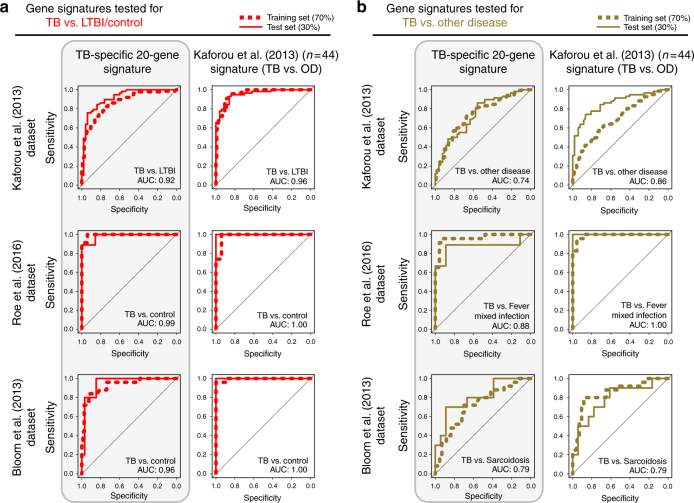
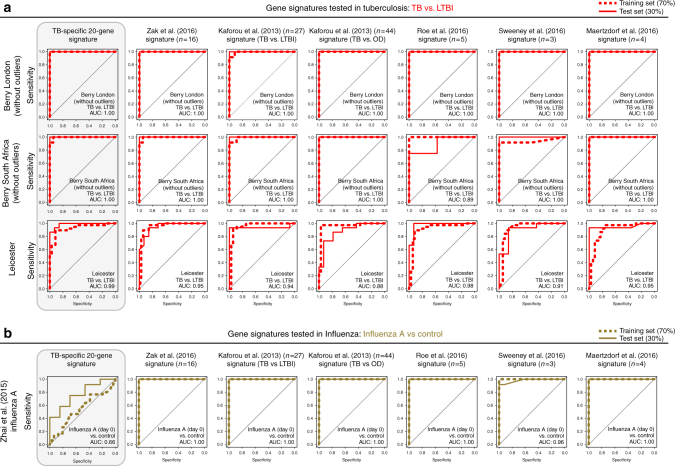
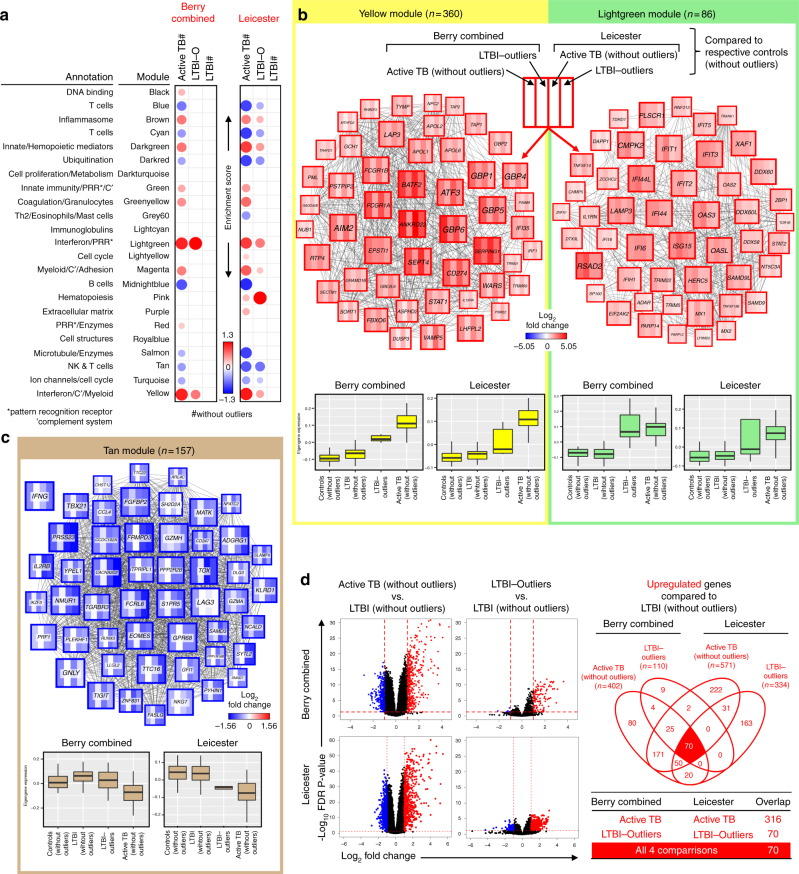
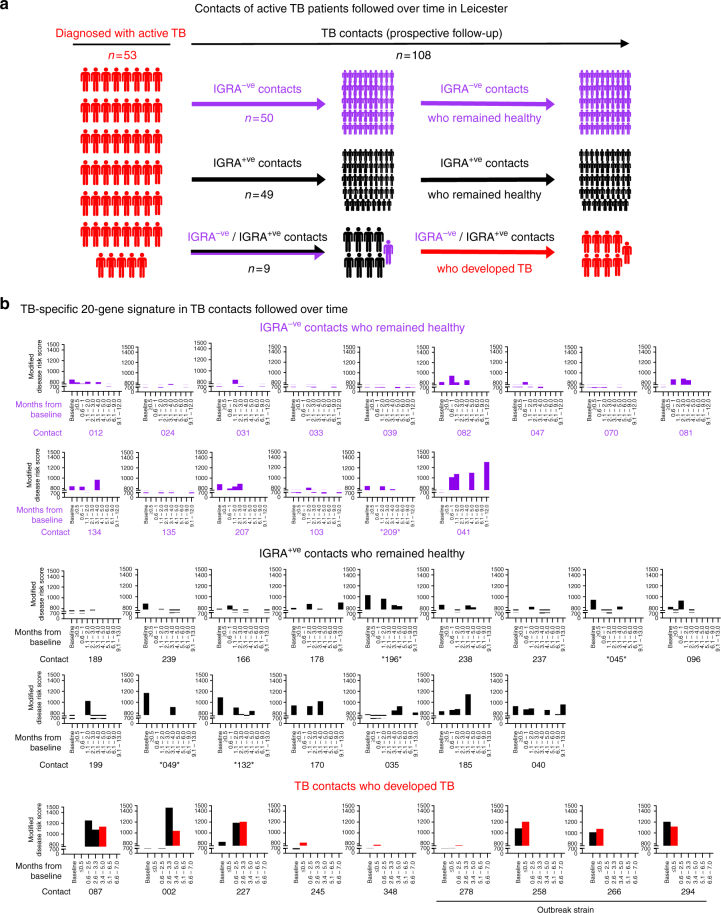
Whole blood transcriptional signatures distinguishing active tuberculosis patients from asymptomatic latently infected individuals exist. Consensus has not been achieved regarding the optimal reduced gene sets as diagnostic biomarkers that also achieve discrimination from other diseases. Here we show a blood transcriptional signature of active tuberculosis using RNA-Seq, confirming microarray results, that discriminates active tuberculosis from latently infected and healthy individuals, validating this signature in an independent cohort. Using an advanced modular approach, we utilise the information from the entire transcriptome, which includes overabundance of type I interferon-inducible genes and underabundance of IFNG and TBX21, to develop a signature that discriminates active tuberculosis patients from latently infected individuals or those with acute viral and bacterial infections. We suggest that methods targeting gene selection across multiple discriminant modules can improve the development of diagnostic biomarkers with improved performance. Finally, utilising the modular approach, we demonstrate dynamic heterogeneity in a longitudinal study of recent tuberculosis contacts.


Conflict of interest statement

The authors declare no competing interests and note that previous patents held by A.O.G. on the use of the blood transcriptomic for diagnosis of tuberculosis have lapsed and discontinued. Neither bioMérieux nor BIOASTER have filed patents related to this study.

Figures

Fig. 1
Fig. 1
The objectives of this study. An overview of the analysis undertaken in the study. Figures associated with each objective are stated below the box
Fig. 2
Fig. 2
Whole-blood transcriptional gene signatures in TB. a Heatmaps depicting unsupervised hierarchical clustering of active TB (red), LTBI (black) and control samples (purple) using a 373-gene signature derived using the Berry London cohort, tested in the Berry South Africa cohort, and b validated in an independent cohort from Leicester. Gene expression values were averaged and scaled across the row to indicate the number of standard deviations above (red) or below (blue) the mean, denoted as row Z-score. c Bar graphs depicting enrichment scores derived on a single sample basis using ssGSEA in the Berry London, Berry South Africa and Leicester cohorts using the 16-gene signature from Zak et al.. Purple, black and red bars represent control, LTBI and active TB samples, respectively, and * (control outliers), # (LTBI outliers) and § (active TB outliers) represent the outlier samples identified by hierarchical clustering
Fig. 3
Fig. 3
Enrichment of the published reduced TB gene signatures in TB, and other viral and bacterial infections. a Box plots depicting enrichment scores derived on a single-sample basis using ssGSEA, using the 16-gene signature from Zak et al., and the 27-gene (TB vs. LTBI) and 44-gene (TB vs. other diseases (OD)) signatures from Kaforou et al. in tuberculosis datasets (Berry London, Berry South Africa and Leicester), and b in datasets of other infections—severe influenza from Parnell et al., Influenza A from Zhai et al. and bacterial pneumonia from Parnell et al.. The box represents the 25th to 75th percentile, with a line inside the box indicating the median and the whiskers representing the minimum to the maximum points in the data
Fig. 4
Fig. 4
Modular transcriptional signatures of TB and other diseases. a Twenty-three modules of co-expressed genes derived using WGCNA from Combined Berry dataset (London and South Africa) and tested in other TB datasets, and b datasets with additional diseases. Fold enrichment scores derived using QuSAGE are depicted, with red and blue indicating modules over- or underexpressed, compared to the controls. Colour intensity and size represent the degree of enrichment, compared to the controls. Only modules with fold enrichment scores with FDR p-value < 0.05 were considered significant and depicted here. §, fold enrichment scores in the lightgreen module greater than the maximum score depicted on the scale (i.e. >1.3) in severe influenza (Parnell et al., score: 1.55) and influenza A (Zhai et al., score: 1.97)
Fig. 5
Fig. 5
Gene expression in the yellow module in TB compared to TB cohorts and to other viral and bacterial infections. a Log2-fold changes for genes in the yellow module from Berry London cohort (active TB vs. controls; y-axis) compared to the log2-fold changes in other datasets (respective cases vs. controls; x-axis) in TB and b other infections (Herberg et al., Suarez et al., time-course data from Zhai et al. (influenza A) and Parnell et al. (severe influenza and bacterial pneumonia)). Shapes and colours represent significantly differentially expressed genes (FDR p-value < 0.05) in either Berry London only (orange squares), respective dataset only (cyan diamonds), both dataset (yellow circles) or significant in neither (black triangles)
Fig. 6
Fig. 6
Whole-blood TB-specific 20-gene signature tested in TB and other infections. a A reduced 20-gene signature of TB derived from the TB-modular signature using genes significantly differentially expressed in Berry London cohort only and not in other flu datasets (Supplementary Figure 6). b Box plots depicting the modified Disease Risk Scores derived using the TB-specific 20-gene signature in TB datasets and in c datasets of other infections. The box represents 25th to 75th percentile, with a line inside the box indicating the median and the whiskers representing the minimum to the maximum points in the data
Fig. 7
Fig. 7
Comparison of our TB-specific 20-gene signature with Kafourou et al. in distinguishing TB and other diseases. a Receiver operating characteristic (ROC) curves depicting the predictive potential of the TB-specific 20-gene signature and the 44-gene (TB vs. other diseases (OD)) signature from Kaforou et al. in classifying a sample as TB or LTBI/Control, or b in classifying a sample as TB or other disease in datasets from Kaforou et al., Roe et al. and Bloom et al.. Area under the curve (AUC) is shown for each ROC curve
Fig. 8
Fig. 8
Comparison of our TB-specific 20-gene signature and others in distinguishing TB and influenza. a Receiver operating characteristic curves (ROC) depicting the predictive potential of the TB-specific 20-gene signature and the other published gene signatures in classifying a sample as TB or LTBI in the Berry London, Berry South Africa and Leicester cohorts, and b in classifying a sample as influenza A or control in the Zhai et al. dataset. Area under the curve (AUC) is shown for each ROC curve
Fig. 9
Fig. 9
Blood transcriptional profile of LTBI outliers compared with active TB. a Modules of co-expressed genes tested in LTBI outliers from the Combined Berry and Leicester cohorts. Fold enrichment scores derived using QuSAGE are depicted, with red and blue indicating modules over- or underexpressed, compared to the controls. Colour intensity and size represent the degree of enrichment, compared to the controls. Only modules with fold enrichment scores with FDR p-value < 0.05 were considered significant and depicted here. b Gene networks depicting the top 50 ‘hub’ genes, i.e. genes with high intramodular connectivity, for the yellow, light green and c tan modules. Each gene is represented as a square node with edges representing correlation between the gene expression profiles of the two respective genes (minimum Pearson correlation of 0.75). A key describing the four different partitions within each square node is shown, with each partition representing log2-fold changes for active TB (without outliers) and LTBI outliers from the Berry Combined and Leicester cohorts, compared to respective controls (without outliers). Red and blue represent up- and downregulated genes, respectively. In the tan module, the expression for IFNG is also shown, although it was not one of the top 50 hub genes within that module. Box plots depicting the module eigengene expression, i.e. the first principal component for all genes within the module, are shown below each gene network. d Volcano plots depicting differentially expressed genes for active TB (without outliers) and LTBI outliers in the Berry Combined and Leicester cohorts, compared to respective LTBI (without outliers). Significantly differentially expressed genes (log2 fold change >1 or <−1, and FDR p-value < 0.05) are represented as red (upregulated) or blue (downregulated) dots, along with a Venn diagram and table summarising overlaps between these different comparisons
Fig. 10
Fig. 10
Blood transcriptional profile of TB contacts followed over time. a Schematic representing active TB patients from the Leicester cohort and their contacts followed over time. Purple, black and red represent IGRA−ve (controls), IGRA+ve (LTBI) and active TB patients, respectively. b Bar plots depicting the modified disease risk scores using the TB-specific 20-gene signature in TB contacts who remained IGRA−ve and did not develop TB (n = 15), TB contacts who remained IGRA+ve and did not develop TB (n = 16) and TB contacts who developed TB during the study (n = 9). For TB contacts who developed TB during the study, the time point when the contact was diagnosed with active TB in the clinic is represented by a red bar. Baseline in the barplot is set at 766.64, average of all Baseline time point modified disease risk scores from all IGRA−ve contacts (n = 15)

References

    1. World Health Organisation. Global TB Report (WHO, Geneva, 2015).
    1. Pfyffer GE, Cieslak C, Welscher HM, Kissling P, Rusch-Gerdes S. Rapid detection of mycobacteria in clinical specimens by using the automated BACTEC 9000 MB system and comparison with radiometric and solid-culture systems. J. Clin. Microbiol. 1997;35:2229–2234. - PMC - PubMed
    1. Boehme CC, et al. Rapid molecular detection of tuberculosis and rifampin resistance. N. Engl. J. Med. 2010;363:1005–1015. doi: 10.1056/NEJMoa0907847. - DOI - PMC - PubMed
    1. Center for Communicable Disease Control and Prevention. Reported Tuberculosis in the United States, 2007. (US Department of Health and Human Services, Atlanta, GA, 2007).
    1. Vynnycky E, Fine PE. Lifetime risks, incubation period, and serial interval of tuberculosis. Am. J. Epidemiol. 2000;152:247–263. doi: 10.1093/aje/152.3.247. - DOI - PubMed

Publication types

MeSH terms