. 2018 Jun 19;9(1):2318.
doi: 10.1038/s41467-018-04744-1.

Caffeine-inducible gene switches controlling experimental diabetes

Affiliations

Caffeine-inducible gene switches controlling experimental diabetes

Daniel Bojar et al. Nat Commun. .

Abstract

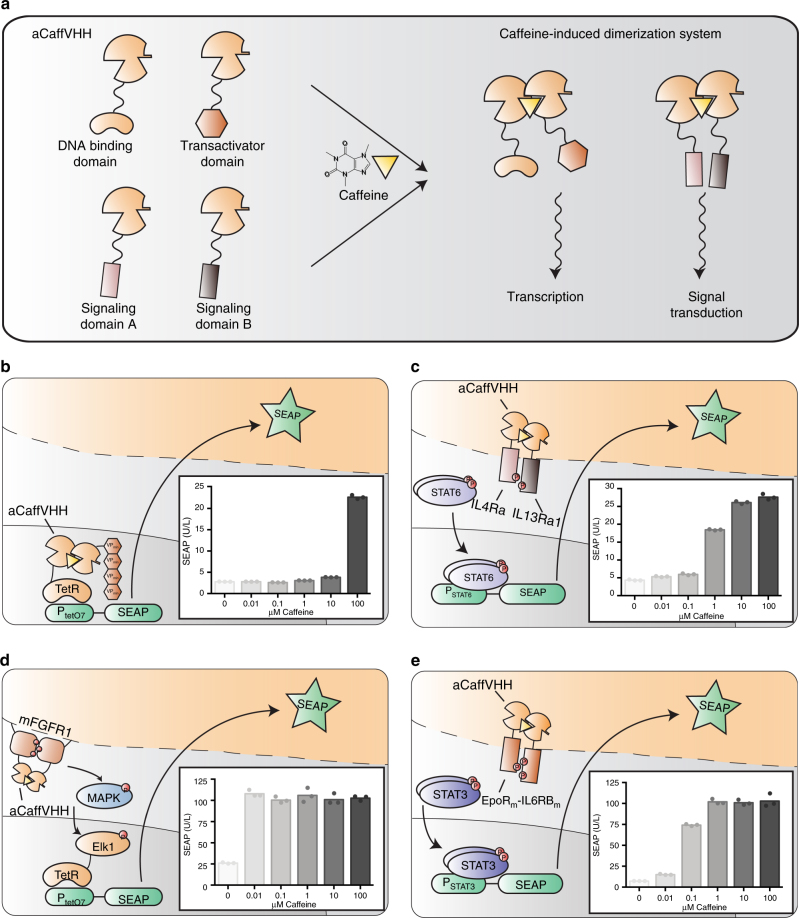
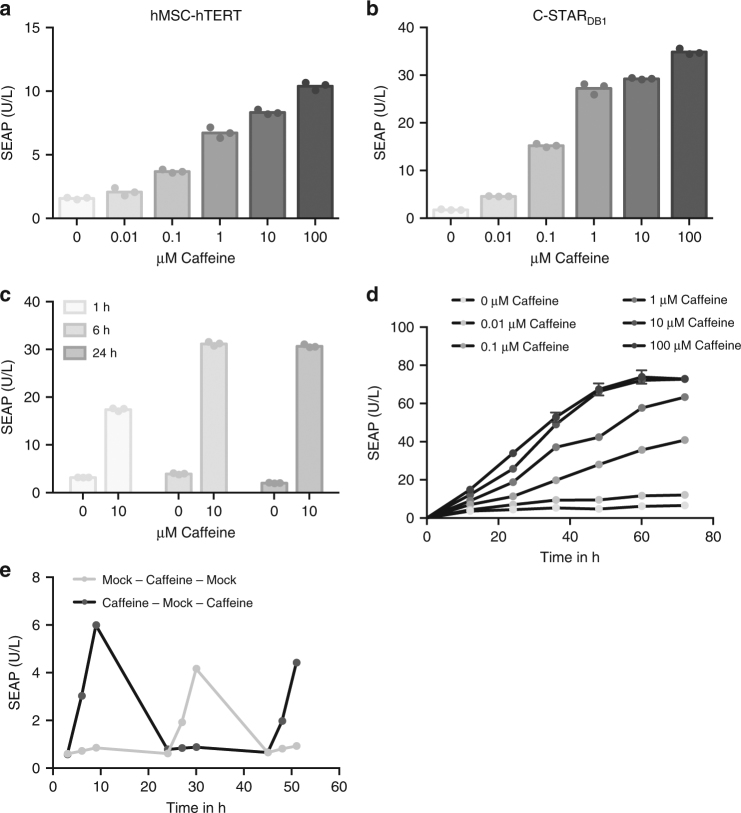
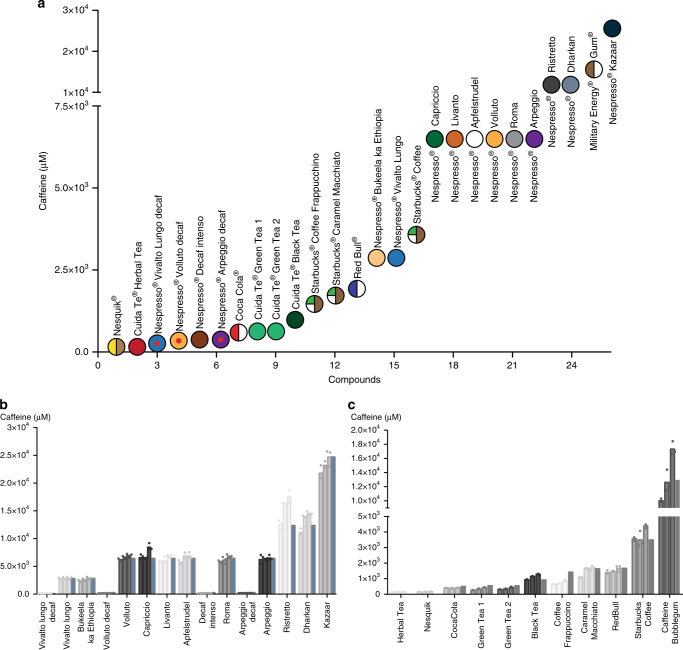
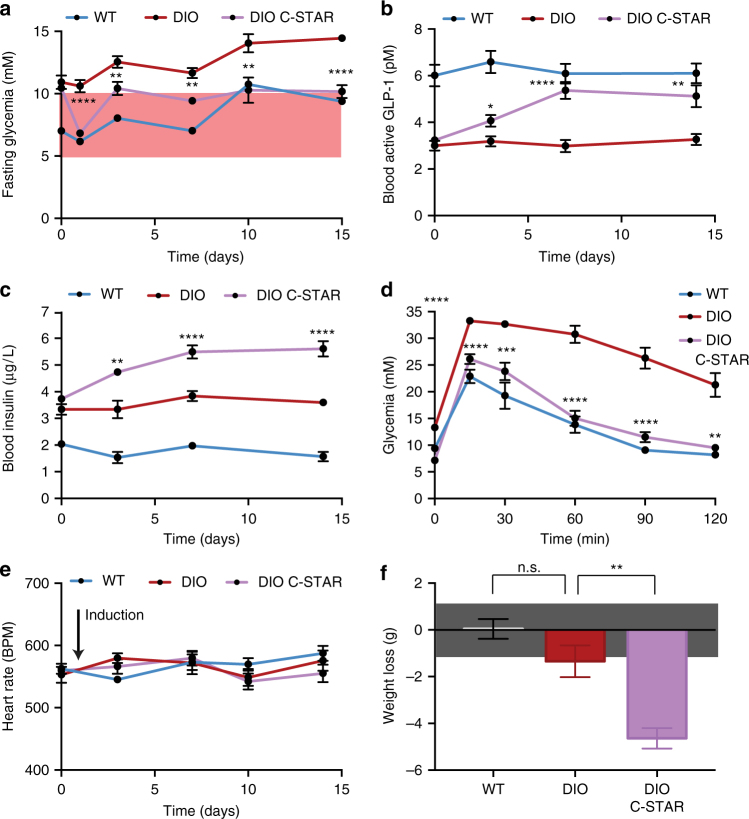
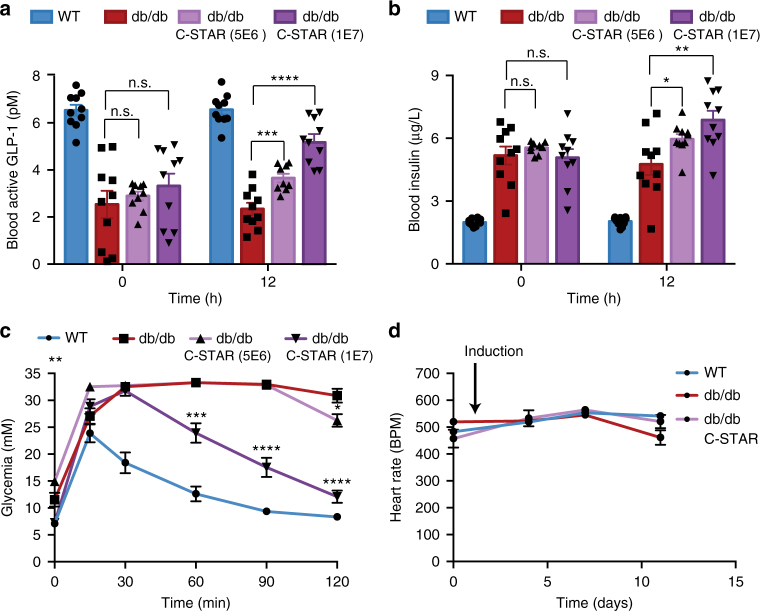
Programming cellular behavior using trigger-inducible gene switches is integral to synthetic biology. Although significant progress has been achieved in trigger-induced transgene expression, side-effect-free remote control of transgenes continues to challenge cell-based therapies. Here, utilizing a caffeine-binding single-domain antibody we establish a caffeine-inducible protein dimerization system, enabling synthetic transcription factors and cell-surface receptors that enable transgene expression in response to physiologically relevant concentrations of caffeine generated by routine intake of beverages such as tea and coffee. Coffee containing different caffeine concentrations dose-dependently and reversibly controlled transgene expression by designer cells with this caffeine-stimulated advanced regulators (C-STAR) system. Type-2 diabetic mice implanted with microencapsulated, C-STAR-equipped cells for caffeine-sensitive expression of glucagon-like peptide 1 showed substantially improved glucose homeostasis after coffee consumption compared to untreated mice. Biopharmaceutical production control by caffeine, which is non-toxic, inexpensive and only present in specific beverages, is expected to improve patient compliance by integrating therapy with lifestyle.


Conflict of interest statement

The authors declare no competing interests.

Figures

Fig. 1
Fig. 1
Synthetic biology-inspired genetic circuits for caffeine-induced gene expression. a Caffeine-inducible protein dimerization system based on the camelid-derived single-domain antibody aCaffVHH. aCaffVHH homodimerizes in the presence of caffeine and can be used to reconstitute synthetic transcription factors or signaling cascades that fine-tune caffeine-responsive gene expression. b Caffeine-sensing circuit based on the heterodimerization of aCaffVHH-TetR (pDB307) and aCaffVHH-VPminx4 (pDB335), leading to direct transcriptional activation. The caffeine dose-response relationship was quantified with the reporter gene SEAP (PtetO7-SEAP-pASV40, pMF111). c Caffeine-sensing circuit based on the IL13 receptor and the JAK/STAT6 pathway. Caffeine-induced heterodimerization of aCaffVHH-IL13Rα1 (pDB323) and aCaffVHH-IL4Rα (pDB324) leads to phosphorylation of STAT6 (pLS16) by JAK kinases and subsequent transcriptional activation of the STAT6-responsive promoter PSTAT6. The caffeine dose-response relationship was quantified with the reporter gene SEAP (PSTAT6-SEAP-pASV40, pLS12). d Caffeine-sensing circuit based on the MAPK pathway. Caffeine-induced homodimerization of mFGFR1405-822-aCaffVHH (pDB395) led to phosphorylation of MEK1/2 and downstream signaling of the MAPK cascade. Rewiring the signaling cascade through the hybrid transcription factor TetR-Elk1 (MKp37) led to expression of the reporter gene SEAP (PtetO7-SEAP-pASV40, pMF111), enabling quantification of the caffeine dose-response relationship. e Caffeine-sensing circuit based on the Epo receptor and the JAK/STAT3 pathway. Caffeine-induced homodimerization of aCaffVHH-EpoRm-IL-6RBm (pDB306) leads to phosphorylation of STAT3 by JAK kinases and subsequent transcriptional activation of the STAT3-responsive promoter PSTAT3. The caffeine dose-response relationship was quantified with the reporter gene SEAP (PSTAT3-SEAP-pASV40, pLS13). Data in (be) are shown as the mean in bar graphs and symbols indicate individual data points. The data displayed represent three independent experiments (n = 3)
Fig. 2
Fig. 2
Characterization of the caffeine-induced gene switch C-STAR. a Functionality of C-STAR in hMSC-hTERT cells. hMSC-hTERT cells were transiently transfected with pDB306 (PhCMV-aCaffVHH-EpoRm-IL-6RBm-pAbGH) and pLS13 (PSTAT3-SEAP-pASV40). Sixteen hours after transfection, the cells were exposed to increasing concentrations of caffeine in standard cell culture medium. The caffeine dose-response relationship was quantified in terms of SEAP expression after 24 h. The data displayed represent three independent experiments (n = 3). b Caffeine-responsiveness of polyclonal C-STARDB1 cells. Polyclonal C-STARDB1 cells were exposed to increasing caffeine concentrations to examine their sensitivity. Supernatant levels of SEAP were quantified after 24 h. The data displayed represent three independent experiments (n = 3). c Caffeine exposure time needed for the activation of the C-STAR system. C-STARDB1 cells were exposed to H2O or 10 µM caffeine in standard cell culture medium for different periods of time to determine the minimum exposure time needed for induction. After the indicated time, the caffeinated medium was replaced with standard cell culture medium and SEAP expression proceeded for 24 h before quantification. Data in ac are shown as the mean in bar graphs and symbols indicate individual data points. The data displayed represent three independent experiments (n = 3). d Response time of the C-STAR system to caffeine. C-STARDB1 cells were exposed to H2O or increasing concentrations of caffeine in standard cell culture medium to determine the response time of the system. Supernatant samples containing SEAP were taken every 12 h for 72 h. The data displayed represent the means ± s.d. of three independent experiments (n = 3). e Reversibility of the C-STAR system. C-STARDB1 cells were alternately exposed to H2O and 10 µM caffeine in standard cell culture medium to show the reversibility of the system. Supernatant samples containing SEAP were taken every three hours for nine hours per day. The data displayed represent the means ± s.d. of three independent experiments (n = 3)
Fig. 3
Fig. 3
In vitro caffeine quantification in commercial caffeine sources. a Illustration of the tested solutions with their respective caffeine concentration. From left to right, the boxes correspond to Nesquik® capsules, Forest Fruits® (herbal tea), Vivalto lungo decaffeinato®, Volluto decaffeinato®, Decaffeinato intenso®, Arpeggio decaffeinato®, Coca-Cola®, Mediterranean® (green tea), Marrakech® (green tea), Earl Grey® (black tea), Starbucks® Coffee Frappuccino, Starbucks® Caramel Macchiato, Red Bull®, Bukeela ka Ethiopia®, Vivalto lungo®, Starbucks® Coffee, Capriccio®, Livanto®, Apfelstrudel®, Volluto®, Roma®, Arpeggio®, Ristretto®, Dharkan®, Military Energy Gum®, and Kazaar®. The indicated caffeine concentrations were calculated from the specifications of the vendor regarding the amount of caffeine in each beverage. b, c Quantification of the caffeine concentration in coffee from Nespresso Grand Cru® capsules (b) and other commercially available caffeine sources (c). Caffeine-containing samples were added to C-STARDB1 cells with a dilution of 1:50,000. A standard curve obtained with pure caffeine enabled conversion of the quantified SEAP levels to caffeine concentrations in the original samples. Each beverage was prepared or bought on three separate occasions and the data represent the quantification of each replicate in triplicate (n = 3). Data in (b, c) are shown as the mean in bar graphs and symbols indicate individual data points. The caffeine concentration indicated by the vendor is shown in blue
Fig. 4
Fig. 4
Coffee-induced designer cell-based treatment of diabetic diet-induced obese mice. ad Caffeine-dependent insulinotropic action of shGLP-1. Wild type (WT) or diet-induced obese mice (DIO) were intraperitoneally implanted with microencapsulated C-STARDB6 cells or control HEK-293T cells containing only pDB387 (PSTAT3-shGLP-1-pASV40) and received daily oral doses of 300 µL Nespresso Volluto® coffee. a Fasting glycemia, b blood active GLP-1, and c 4 h postprandial insulin levels were recorded for 14 days. d Intraperitoneal glucose tolerance tests were performed by administration of 2 g kg−1 aqueous D-glucose. e Caffeine-dependent cardiovascular effects. Heart rate of the same mice shown in (b, c) was measured prior to the collection of blood samples. f Caffeine-triggered shGLP-1-mediated effects on body weight. On day 15, the body weights of individual mice shown in (ae) were compared to their initial body weights (day 1; prior to first coffee intake). The confidence interval of the balance is indicated by a gray box. All data displayed are mean ± SEM (n = 10 mice). Comparisons were made with Welch’s t test: *P < 0.05, **P < 0.01, ***P < 0.001, ****P < 0.0001 vs. control, n.s. not significant. The range of homeostatic fasting glycemia is indicated with a red box
Fig. 5
Fig. 5
Coffee-induced designer cell-based treatment of diabetic db/db mice. ac Caffeine-dependent insulinotropic action of shGLP-1. Wild type (WT) or leptin receptor-deficient mice (db/db) were intraperitoneally implanted with different doses of microencapsulated C-STARDB6 cells (0 to 1 × 107 cells) or 1 × 107 control HEK-293T cells containing only pDB387 (PSTAT3-shGLP-1-pASV40), and received an oral dose of 300 µL Nespresso Volluto® coffee. a blood active GLP-1 and b 4 h postprandial insulin levels were recorded before cell implantation and 1 day afterwards. c Intraperitoneal glucose tolerance tests were performed by administration of 2 g kg−1 aqueous D-glucose. d Caffeine-dependent cardiovascular effects. Heart rate of the same mice described in (ac) was measured prior to the collection of blood samples. All data displayed are mean ± SEM (n = 10 mice). Comparisons were made with Welch’s t test: *P < 0.05, **P < 0.01, ***P < 0.001, ****P < 0.0001 vs. control, n.s. not significant

Similar articles

Cited by

References

    1. Ausländer S, Ausländer D, Fussenegger M. Synthetic biology-the synthesis of biology. Angew. Chem. Int. Ed. 2017;56:6396–6419. doi: 10.1002/anie.201609229. - DOI - PubMed
    1. Xie M, et al. β-cell-mimetic designer cells provide closed-loop glycemic control. Science. 2016;354:1296–1301. doi: 10.1126/science.aaf4006. - DOI - PubMed
    1. Bai P, et al. A synthetic biology-based device prevents liver injury in mice. J. Hepatol. 2016;65:84–94. doi: 10.1016/j.jhep.2016.03.020. - DOI - PMC - PubMed
    1. Guye P, et al. Genetically engineering self-organization of human pluripotent stem cells into a liver bud-like tissue using Gata6. Nat. Commun. 2016;7:10243. doi: 10.1038/ncomms10243. - DOI - PMC - PubMed
    1. Saxena P, et al. A programmable synthetic lineage-control network that differentiates human IPSCs into glucose-sensitive insulin-secreting beta-like cells. Nat. Commun. 2016;7:11247. doi: 10.1038/ncomms11247. - DOI - PMC - PubMed

Publication types

MeSH terms