. 2018 Jun 19;9(1):2392.
doi: 10.1038/s41467-018-04760-1.

Nuclear PTEN safeguards pre-mRNA splicing to link Golgi apparatus for its tumor suppressive role

Affiliations

Nuclear PTEN safeguards pre-mRNA splicing to link Golgi apparatus for its tumor suppressive role

Shao-Ming Shen et al. Nat Commun. .

Abstract

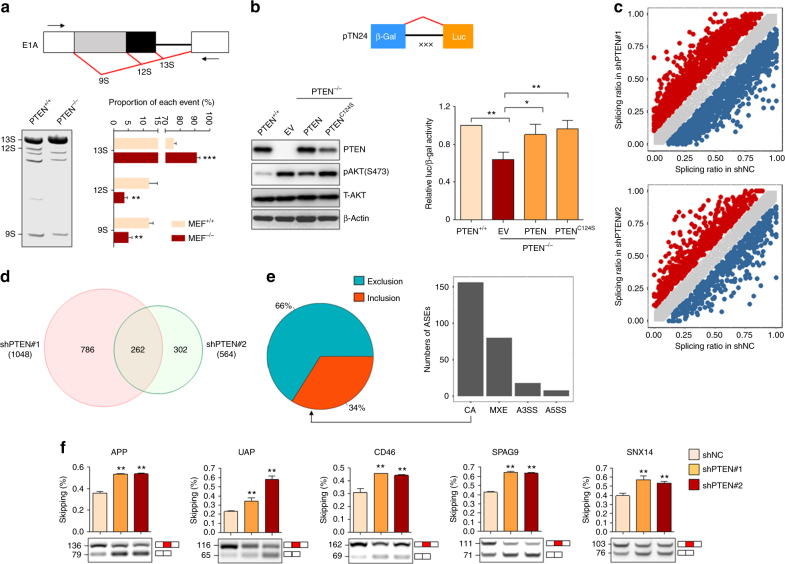
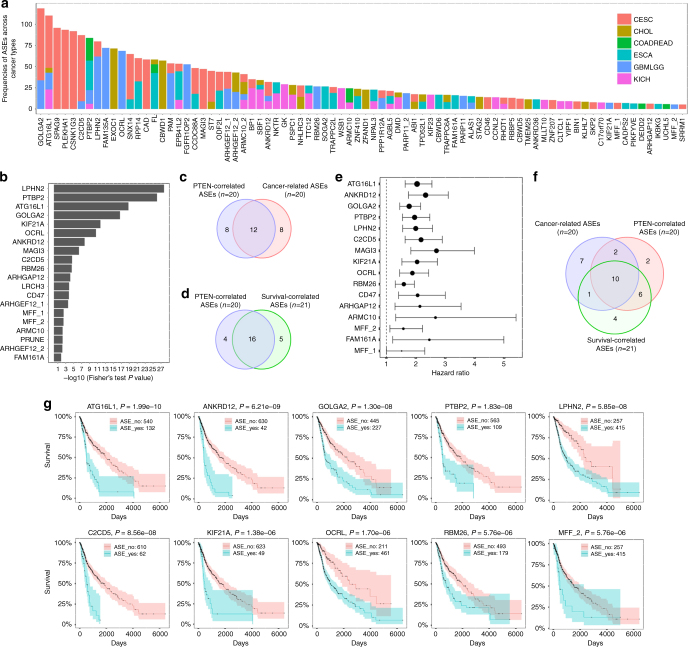
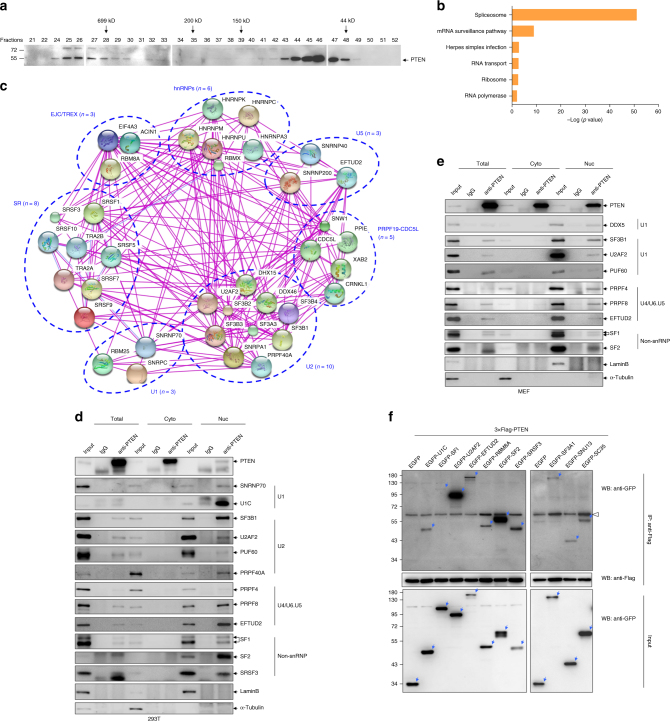
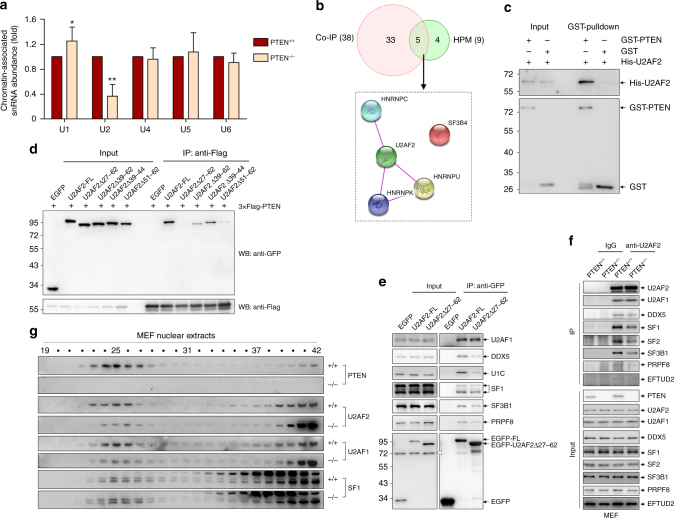
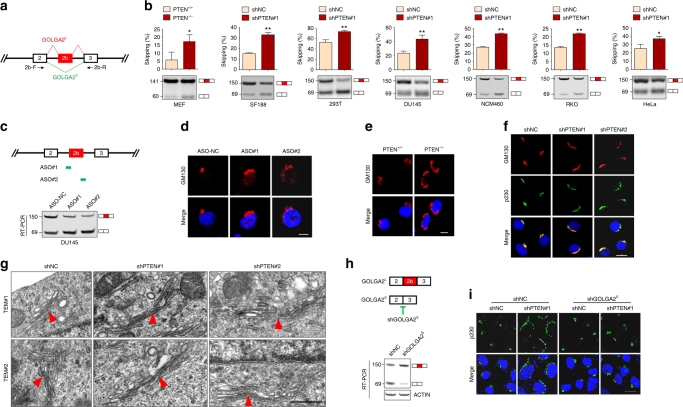
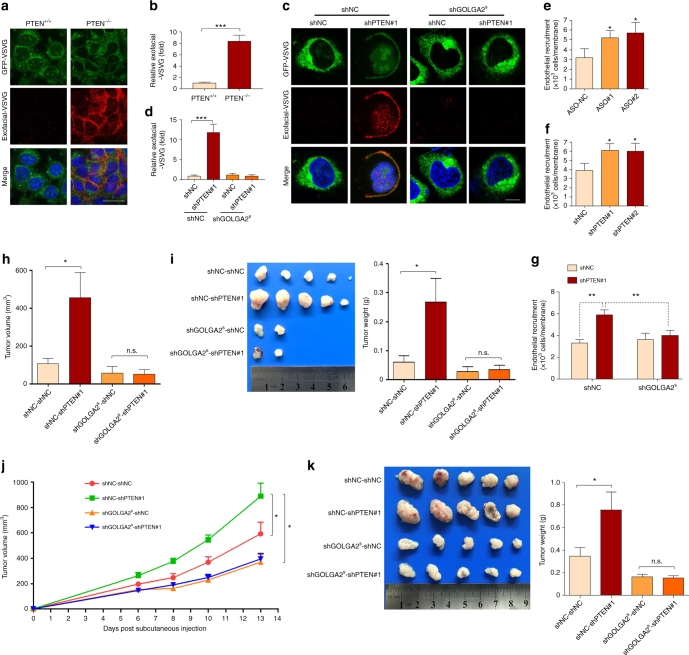
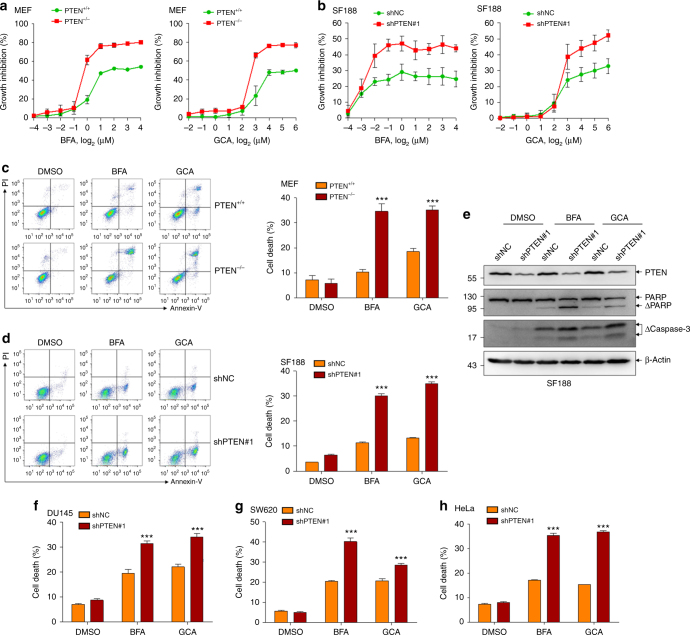
Dysregulation of pre-mRNA alternative splicing (AS) is closely associated with cancers. However, the relationships between the AS and classic oncogenes/tumor suppressors are largely unknown. Here we show that the deletion of tumor suppressor PTEN alters pre-mRNA splicing in a phosphatase-independent manner, and identify 262 PTEN-regulated AS events in 293T cells by RNA sequencing, which are associated with significant worse outcome of cancer patients. Based on these findings, we report that nuclear PTEN interacts with the splicing machinery, spliceosome, to regulate its assembly and pre-mRNA splicing. We also identify a new exon 2b in GOLGA2 transcript and the exon exclusion contributes to PTEN knockdown-induced tumorigenesis by promoting dramatic Golgi extension and secretion, and PTEN depletion significantly sensitizes cancer cells to secretion inhibitors brefeldin A and golgicide A. Our results suggest that Golgi secretion inhibitors alone or in combination with PI3K/Akt kinase inhibitors may be therapeutically useful for PTEN-deficient cancers.


Conflict of interest statement

The authors declare no competing interests.

Figures

Fig. 1
Fig. 1
PTEN regulates alternative splicing. a Quantification of E1A mRNA isoforms. A diagram of the E1A reporter gene indicating the alternative 5’ splice sites and splicing events that generate 13S, 12S and 9S mRNAs. The locations of the exon primers used for RT-PCR analysis are shown (top). RT-PCR analysis of pMTE1A containing E1A reporter gene transfected in PTEN+/+ and PTEN−/− MEF cells was performed, with a representative example (left, bottom) and quantification for the percentage of each isoform from three independent biological replicates (right, bottom) are shown. b The pTN24 minigene construct (top) consisting of β-gal, an upstream intron that contains three translational stop codons (represented as “×××”) and luciferase (Luc), was transfected into PTEN+/+ MEF cells, as well as PTEN−/− MEF cells infected with empty vector (EV), PTENWT or PTENC124S. The indicated proteins were immunoblotted (left, bottom), and the ratios of luciferase expression relative to β-gal expression are shown (right, bottom). c Splicing ratio profiles of the ASEs identified in 293T cells with or without PTEN knockdown. The red and blue dots respectively represent significantly upregulated and downregulated ASEs in shPTEN#1 (top) or shPTEN#2 (bottom)-infected cells compared to shNC ones. d The Venn diagram of ASEs significantly changed in shPTEN#1 and shPTEN#2 compared to shNC-infected cells. e Numbers of four kinds of ASEs (right) and numbers of excluded (EX) or included (IN) in CA (left) significantly changed in PTEN knocked down 293T cells. f RT-PCR analysis of five representative PTEN-regulated EX splicings identified in 293T cells. Quantification of three independent biological replicates (top) and a representative example is shown (bottom). For a, b, g, data represent means with bar as s.d. of three independent experiments; *p < 0.05; **p < 0.01; ***p < 0.001; two-sided unpaired t-test
Fig. 2
Fig. 2
PTEN-regulated ASEs are cancer-related and correlate with patient survival. a The 262 PTEN-regulated ASEs identified in 293T cells were analyzed in TCGA tumor collections. ASEs with frequency of >5% in a single cancer type were considered to be cancer related, and the frequencies of cancer-related ASEs across 6 cancer types are shown. CESC cervical squamous cell carcinoma and endocervical adenocarcinoma, CHOL cholangiocarcinoma, COADREAD colon adenocarcinoma+rectum adenocarcinoma, ESCA esophageal carcinoma, GBMLGG glioblastoma multiforme+low-grade glioma, KICH kidney chromophobe. b Tumor samples of GBMLGG were divided into two groups with or without PTEN copy loss, and 20 ASEs were identified to be correlated with PTEN status according to the frequency of each ASE in the two groups as assayed by Fisher’s exact test. c The Venn diagram of cancer-related ASEs from a and PTEN-correlated ASEs from b in GBMLGG. d The Venn diagram of PTEN-correlated ASEs from b and survival-correlated ASEs from Supplementary Fig. 1A in GBMLGG. e Hazard ratios of PTEN- and survival-correlated ASEs from d. f The Venn diagram of cancer-related ASEs from a, PTEN-correlated ASEs from b, and survival-correlated ASEs from Supplementary Fig. 1A in GBMLGG. g Tumor samples of GBMLGG were divided into two groups with or without occurrence of an ASE, and survival curves were drawn between the two groups for each ASE from f
Fig. 3
Fig. 3
PTEN associates with spliceosomal proteins. a Size exclusion chromatography analysis of nuclear extracts from 293T cells, followed by immunoblotting with anti-PTEN antibody. b KEGG pathway analyses of PTEN-associated proteins. c Analysis of the PTEN-associated spliceosomal proteins by String database. The edge indicates known interaction between two proteins. Proteins in the same complex or family are circled. d, e 293T (d) and MEF (e) cells were fractionated into total, cytoplasmic (Cyto) and nuclear (Nuc) fractions, and immunoprecipitation with anti-PTEN antibody or control IgG was performed in each fraction, followed by immunoblotting for indicated proteins. f 3×Flag-tagged PTEN was cotransfected with EGFP-tagged spliceosomal proteins or EGFP into 293T cells, and immunoprecipitation with anti-Flag antibody was performed, followed by immunoblotting with anti-Flag or anti-GFP antibody. The blue arrows points to the corresponding EGFP-tagged proteins, and empty arrow indicates a non-specific band
Fig. 4
Fig. 4
PTEN regulates spliceosome assembly through U2AF2. a Chromatin-associated five snRNAs in PTEN+/+ and PTEN−/− MEF cells were assayed by qRT-PCR. Data represent means with bar as s.d. of three independent experiments; *p < 0.05; **p < 0.01; two-sided unpaired t-test. b The Venn diagram of PTEN-interacting spliceosomal proteins identified by co-IP assay or HPM (top). Spliceosomal proteins identified by both assays are analyzed by String database (bottom). The edge indicates known interaction between two proteins. c Bacterially expressed GST or GST-tagged PTEN proteins were incubated with His-tagged U2AF2, followed by GST pulldown and immunoblotting for His and GST. d 3×Flag-tagged PTEN and EGFP-tagged U2AF2 constructs were cotransfected into 293T-PTENΔ cells, and immunoprecipitation with anti-Flag antibody was performed, followed by immunoblotting with anti-Flag or anti-GFP antibody. e EGFP, EGFP-tagged U2AF2-FL or U2AF2Δ27-62 was transfected into 293T-PTENΔ cells, and immunoprecipitation with GFP-Trap was performed, followed by immunoblotting for indicated proteins. f Immunoprecipitation with anti-U2AF2 antibody or control IgG in PTEN+/+ and PTEN−/− MEF cells, followed by immunoblotting for indicated proteins. g Size exclusion chromatography analysis of nuclear extracts from PTEN+/+ and PTEN−/− MEF cells, followed by immunoblotting with fractions 19–42 from both cells for indicated proteins
Fig. 5
Fig. 5
PTEN regulates Golgi extension through GOLGA2 exon 2b splicing. a Schematic representation of a part of GOLGA2 gene with exons 2, 2b and 3 shown as boxes. Splicing patterns are shown as diagonal red (exon 2b included) or green (exon 2b excluded) lines. Arrows indicate the locations of primers used in RT-PCR analysis. b RT-PCR analysis of GOLGA2 exon 2b alternative splicing in PTEN+/+ and PTEN−/− MEF cells, as well as in the indicated cells with or without PTEN knockdown. Quantification of three independent biological replicates (top) and a representative example (bottom) are shown. Data represent means with bar as s.d. of three independent experiments; *p < 0.05; **p < 0.01; two-sided unpaired t-test. c Schematic representation of ASOs designed to induce exon 2b skipping of GOLGA2 (top), and RT-PCR verification of GOLGA2 exon 2b skipping in ASOs-transfected DU145 cells. d, e Immunofluorescent staining of GM130 together with re-staining of DAPI in ASOs-transfected DU145 cells (d) and PTEN+/+ and PTEN−/− MEF cells (e). Scale bar represents 10 μm. f Immunofluorescent staining of GM130 and p230 together with re-staining of DAPI in DU145 cells with or without PTEN knockdown. Scale bar represents 20 μm. g Two fields of TEM images of Golgi structure of DU145 cells with or without PTEN knockdown. The red triangles point to Golgi. Scale bar represents 500 nm. h A pair of shRNA targeting the exon 2/3 junction for specific knockdown of GOLGA2S was designed (top) and transfected into DU145 cells, and the efficiency was verified by RT-PCR (bottom). i DU145 cells with or without GOLGA2S knockdown were further subjected to PTEN knockdown, and immunofluorescent staining of p230 together with re-staining of DAPI were performed. Scale bar represents 20 μm
Fig. 6
Fig. 6
GOLGA2S promotes secretion and tumorigenesis upon PTEN loss. a, b Trafficking of ts045-VSVG-EGFP in PTEN+/+ and PTEN−/− MEF cells. Cells transfected with ts045-VSVG-EGFP were incubated at 40 °C for 3 h, then shifted to 32 °C for 1 h. Arrival at plasma membrane of ts045-VSVG-EGFP was determined with antibody against the exofacial-VSVG in unpermeabilized cells with scale bar representing 25 μm (a). The ratio of plasma membrane-arrived VSVG was determined by comparing exofacial-VSVG signal to the total cellular EGFP signal, followed by normalization to the control group (b). c, d DU145 cells with or without GOLGA2S knockdown were subjected to PTEN knockdown, and trafficking of ts045-VSVG-EGFP were determined (c) with scale bar representing 10 μm and quantified (c). eg DU145 cells transfected with ASOs (e), with or without PTEN knockdown (f) and with or without GOLGA2S knockdown together with shNC or shPTEN#1 viruses (g) were subjected to endothelial recruitment assay. h, i DU145 cells with or without GOLGA2S knockdown were infected with shNC or shPTEN#1 viruses, and subcutaneously injected into nude mice. After 52 days, tumor volumes were measured (h), harvested and weighed (i). j, k SW620 cells with or without GOLGA2S knockdown were infected with shNC or shPTEN#1 viruses, and subcutaneously injected into nude mice. Tumor volumes were measured at different time points (j). At 13 days after subcutaneous injection, tumors were harvested and weighed (k). For b and d, data represent means with bar as s.d. of 10 cells in each group. For eg, data represent means with bar as s.d. of three independent experiments. For hk, data represent means with bar as s.d.; *p < 0.05; **p < 0.01, ***p < 0.001; two-sided unpaired t-test for b, d, e–i, k; two-sided paired t-test for j
Fig. 7
Fig. 7
PTEN deficiency sensitizes cancer cells to secretion inhibitors. a Growth inhibition of PTEN+/+ and PTEN−/−MEF cells at 24 h after treatment with the indicated concentrations of BFA or GCA. b Growth inhibition of SF188 cells with or without PTEN knockdown at 14 h after treatment with the indicated concentrations of BFA or GCA. c Representative FACS plots of annexin-V and propidium iodide (PI) staining (left) and quantification of cell death (right) of PTEN+/+ and PTEN−/−MEF cells following 24 h of BFA (1 μM), GCA (10 μM) or DMSO treatment. d, e SF188 cells with or without PTEN knockdown were treated for 14 h with BFA (1 μM), GCA (10 μM) or DMSO treatment. Representative FACS plots of annexin-V and PI staining (left, d), quantification of cell death (right, d) and immunoblotted for indicated proteins (e) are shown. fh DU145 (f), SW620 (g) and HeLa (h) cells with or without PTEN knockdown were stained with annexin-V and PI following 32, 28 and 46 h of BFA (1, 1.5, 2 μM), GCA (10, 10, 15 μM) or DMSO treatment. Quantification of cell death is shown. Data represent means with bar as s.d. of three independent experiments; ***p < 0.001; two-sided unpaired t-test

Similar articles

Cited by

References

    1. Wang ET, et al. Alternative isoform regulation in human tissue transcriptomes. Nature. 2008;456:470–476. doi: 10.1038/nature07509. - DOI - PMC - PubMed
    1. Pan Q, Shai O, Lee LJ, Frey BJ, Blencowe BJ. Deep surveying of alternative splicing complexity in the human transcriptome by high-throughput sequencing. Nat. Genet. 2008;40:1413–1415. doi: 10.1038/ng.259. - DOI - PubMed
    1. Yang X, et al. Widespread expansion of protein interaction capabilities by alternative splicing. Cell. 2016;164:805–817. doi: 10.1016/j.cell.2016.01.029. - DOI - PMC - PubMed
    1. Dvinge H, Bradley RK. Widespread intron retention diversifies most cancer transcriptomes. Genome Med. 2015;7:45. doi: 10.1186/s13073-015-0168-9. - DOI - PMC - PubMed
    1. Jung H, et al. Intron retention is a widespread mechanism of tumor-suppressor inactivation. Nat. Genet. 2015;47:1242–1248. doi: 10.1038/ng.3414. - DOI - PubMed

Publication types

MeSH terms