. 2018 Jun 19;8(1):9326.
doi: 10.1038/s41598-018-27691-9.

Effects of a Finger Tapping Fatiguing Task on M1-Intracortical Inhibition and Central Drive to the Muscle

Affiliations

Effects of a Finger Tapping Fatiguing Task on M1-Intracortical Inhibition and Central Drive to the Muscle

Antonio Madrid et al. Sci Rep. .

Erratum in

Abstract

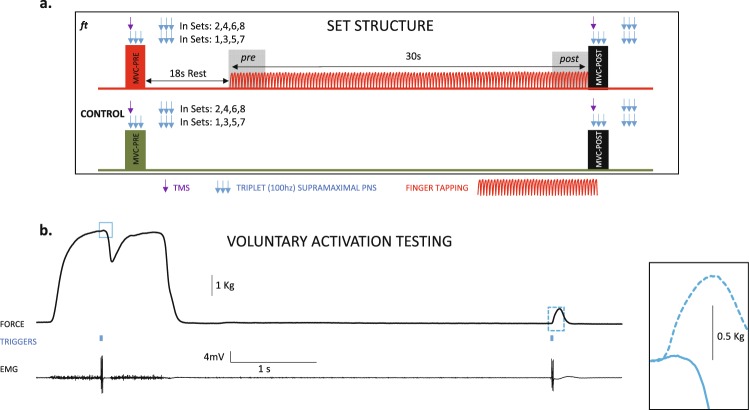
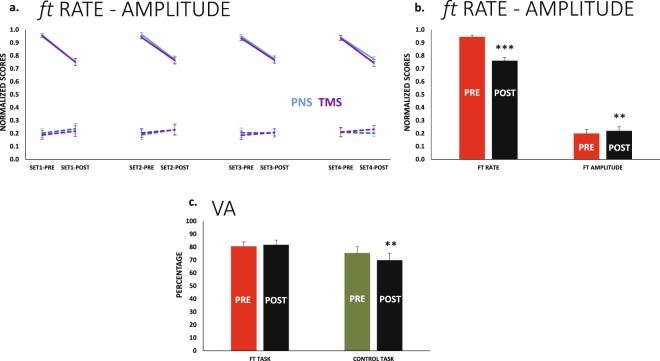
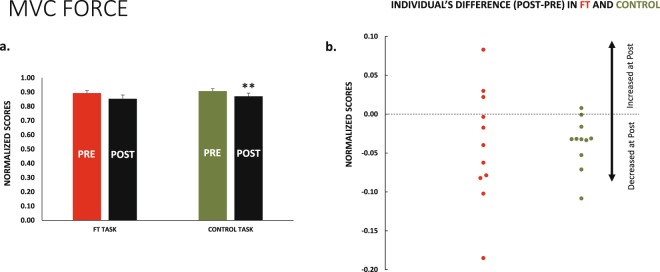
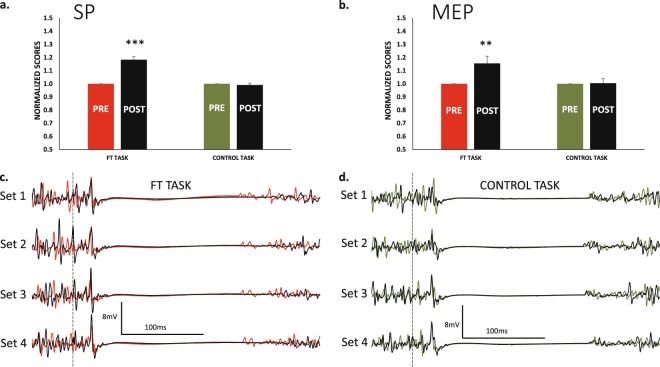
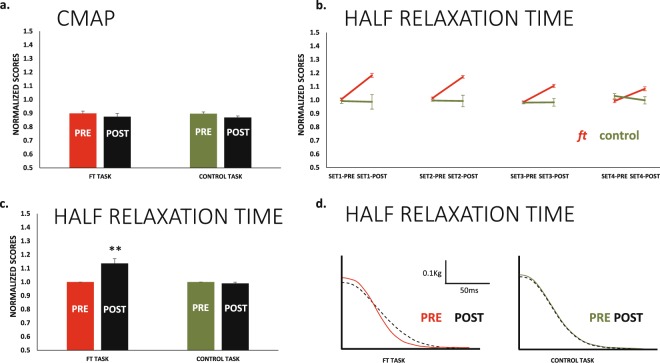
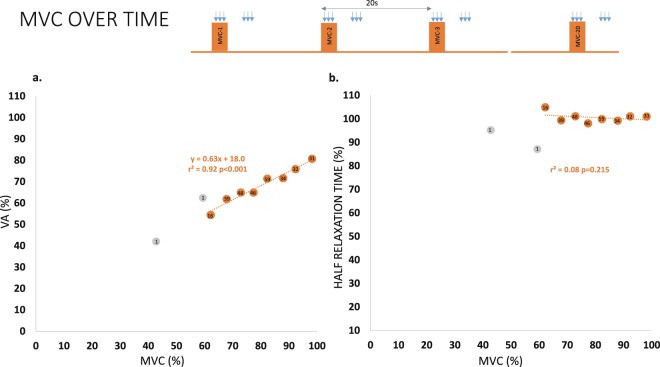
The central drive to the muscle reduces when muscle force wanes during sustained MVC, and this is generally considered the neurophysiological footprint of central fatigue. The question is if force loss and the failure of central drive to the muscle are responsible mechanisms of fatigue induced by un-resisted repetitive movements. In various experimental blocks, we validated a 3D-printed hand-fixation system permitting the execution of finger-tapping and maximal voluntary contractions (MVC). Subsequently, we checked the suitability of the system to test the level of central drive to the muscle and developed an algorithm to test it at the MVC force plateau. Our main results show that the maximum rate of finger-tapping dropped at 30 s, while the excitability of inhibitory M1-intracortical circuits and corticospinal excitability increased (all by approximately 15%). Furthermore, values obtained immediately after finger-tapping showed that MVC force and the level of central drive to the muscle remained unchanged. Our data suggest that force and central drive to the muscle are not determinants of fatigue induced by short-lasting un-resisted repetitive finger movements, even in the presence of increased inhibition of the motor cortex. According to literature, this profile might be different in longer-lasting, more complex and/or resisted repetitive movements.


Conflict of interest statement

The authors declare no competing interests.

Figures

Figure 1
Figure 1
Set structure for ft and control session and VA testing. (a) The ft and control sessions included 8 sets. The set started with an MVC-pre; after 18 sec of rest, subjects executed ft as fast as possible for 30 sec, which continued with an MVC-post (in red colour). From the grey-shaded areas (4 secs at the beginning and end of ft) we obtained the ft rate and amplitude, termed pre and post, respectively. During MVC (pre and post) in sets 1, 3, 5, and 7, we delivered a triplet PNS at the time of force’s plateau, and another triplet after 5.5s during the rest period. In sets 2, 4, 6, and 8, the stimulation during the MVC was TMS, but PNS was maintained at rest. In consecutive subjects, we reversed the order of PNS and TMS during MVC. (b) Example of the VA testing. Stimulation was delivered at the MVC plateau (see supporting video and figures). It is shown the force recording (up), the line of triggers (triple-PNS) (middle) and electromyographic activity. The insets on the right present an enlarged view of the twitches obtained during MVC and in the resting muscle. The Supporting Video displays the last seconds of a 30 s ft set, the execution of the MVC-post just at the end of ft, and the PNS (at MVC plateau and again in the resting potentiated muscle) to calculate the VA; the video was obtained with permission of the participant, in a different session from the experimental ones.
Figure 2
Figure 2
Ft rate and amplitude. Voluntary Activation (a) Changes from pre to post in ft rate (solid lines) and ROM amplitude (dashed lines). Sets corresponding to PNS during MVC are displayed in blue, and those corresponding to TMS are in purple. The profiles did not differ significantly along sets or for PNS and TMS (in these cases, we will plot results pooling sets and stimulation modes, similar to in b). (b) The same results in a pre-post basis. The ft rate decreased significantly, and the ft ROM amplitude presented a small but significant increase at post. (c) The VA reduced significantly at post only in the control session, this was not different in the four sets; the bars represent the four sets of each task pooled. **p < 0.01, ***p < 0.001.
Figure 3
Figure 3
MVC force. (a) The muscle force during MVC was slightly reduced at post in the two sessions (ft and control). This was only significant in the case of the control session. (b) The small reduction in MVC force was more consistent across subjects, represented by green dots in the control session (red dots for ft session); the graphs represent all sets of each task pooled. **p < 0.01.
Figure 4
Figure 4
TMS SP and MEP amplitudes. For the ft session, the SP durations (a) and MEP amplitudes (b) increased significantly at post. This was not the case for the control session. In both cases, the bars represent the 4 sets of each task pooled because responses were not different in the sets. This is clearly observed at the lower section of the graph. (c) Recordings of the four TMS sets in a representative individual during the two sessions; ft at left, control at right. Dashed vertical lines represents the moment of delivering the TMS pulse, recordings in red for ft and green for control are pre, in black are post.
Figure 5
Figure 5
CMAP amplitudes and Half Relaxation Time. (a) The amplitude of the CMAP (considering the first potential of the triplet) remained stable at all testing points for both ft and control sessions. (b) In the ft session, the muscle relaxed progressively faster set after set (red lines); this effect was significant (see main text). However, in all sets, muscle relaxation was significantly slower at post compared to pre in the ft session. The same results represented in a pre-post basis in (c). In the case of the control session, these effects were absent. (d) Relaxation profile of the resting twitch in a same subject in the two sessions (waveforms are the average of the 8 sets at pre and post, solid and dotted lines respectively). **p < 0.01.
Figure 6
Figure 6
Effects of repeating MVC over time on VA and Half Relaxation Time. (a) The repetitions of MVC over time (executed during and after the control session) reduced the magnitude of force and the level of VA. The relation was linear in the range of forces tested (orange dots). (b) However, the drop in MVC force was not associated with the changes in half relaxation time. The score within each dot indicates the number of repetitions included for its computation (considering the 20 MVCs repeated with a 20 sec rest and the control session performed immediately prior to the 20 MVCs). The force ranges with a small number of events (force ranges below 60% MVC, grey dots) were not included in the computation of the regression models.

Similar articles

Cited by

References

    1. Gandevia SC. Spinal and supraspinal factors in human muscle fatigue. Physiol Rev. 2001;81:1725–1789. doi: 10.1152/physrev.2001.81.4.1725. - DOI - PubMed
    1. Merton PA. Voluntary strength and fatigue. J Physiol. 1954;123:553–564. doi: 10.1113/jphysiol.1954.sp005070. - DOI - PMC - PubMed
    1. Enoka RM, Stuart DG. Neurobiology of muscle fatigue. J Appl Physiol. 1992;72:1631–1648. doi: 10.1152/jappl.1992.72.5.1631. - DOI - PubMed
    1. Shimoyama I, Ninchoji T, Uemura K. The finger-tapping test. A quantitative analysis. Arch Neurol. 1990;47:681–684. doi: 10.1001/archneur.1990.00530060095025. - DOI - PubMed
    1. Teo WP, Rodrigues JP, Mastaglia FL, Thickbroom GW. Post-exercise depression in corticomotor excitability after dynamic movement: a general property of fatiguing and non-fatiguing exercise. Exp Brain Res. 2012;216:41–49. doi: 10.1007/s00221-011-2906-6. - DOI - PubMed

LinkOut - more resources