. 2019 Sep;16(9):746-756.
doi: 10.1038/s41423-018-0059-2. Epub 2018 Jun 19.

PDCD5 regulates iNKT cell terminal maturation and iNKT1 fate decision

Affiliations

PDCD5 regulates iNKT cell terminal maturation and iNKT1 fate decision

Ke Wang et al. Cell Mol Immunol. 2019 Sep.

Abstract

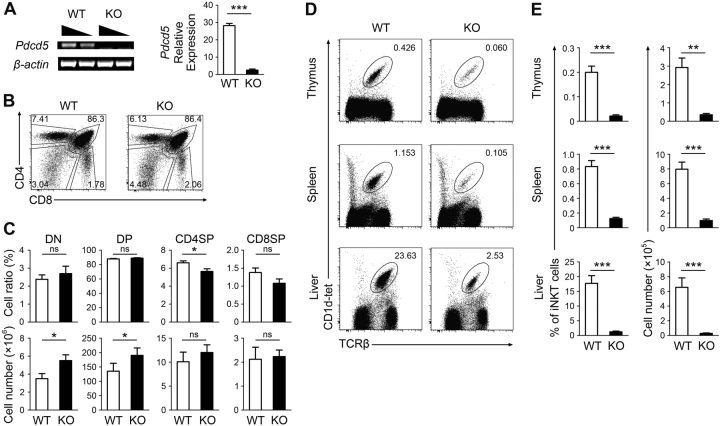
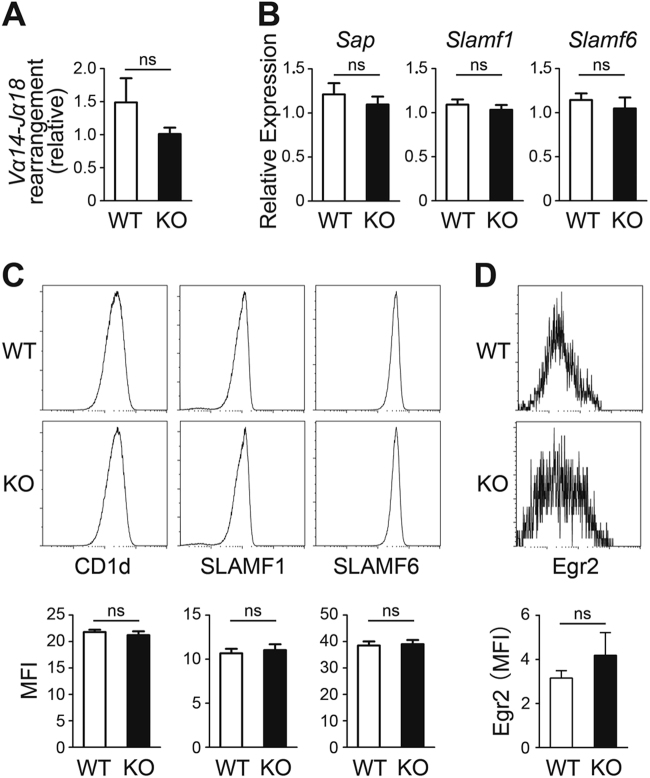
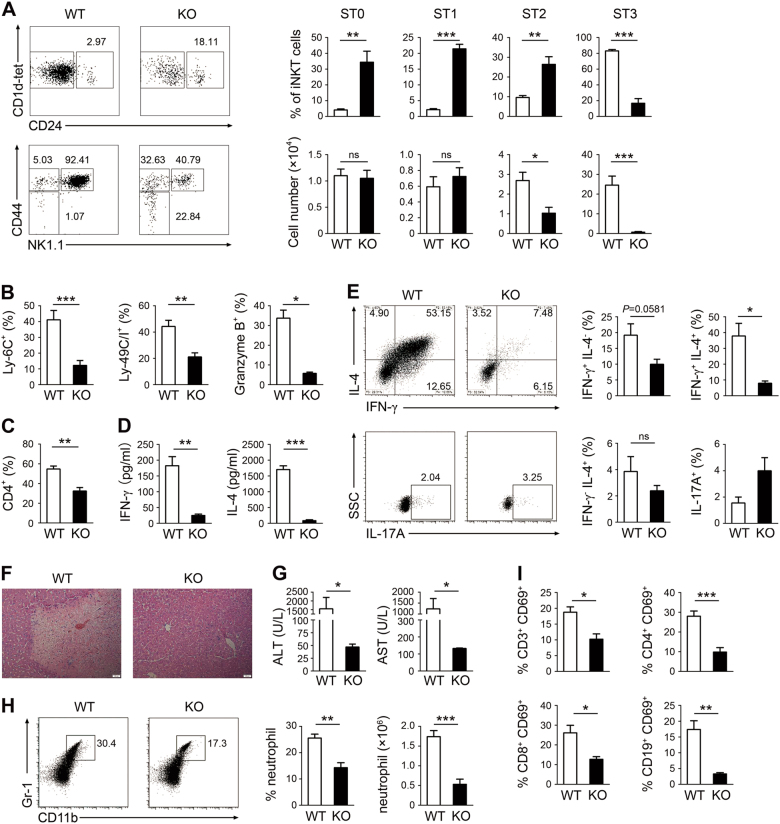
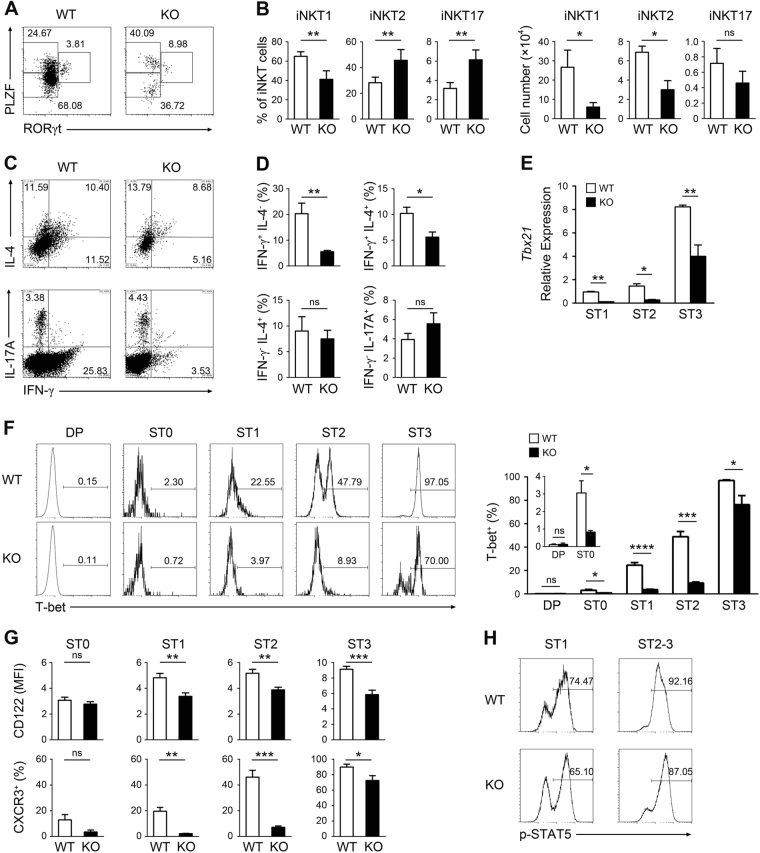
Invariant natural killer T1 (iNKT1) cells are characterized by the preferential expression of T-box transcription factor T-bet (encoded by Tbx21) and the production of cytokine IFN-γ, but the relationship between the developmental process and iNKT1 lineage diversification in the thymus remains elusive. We report in the present study a crucial role of programmed cell death 5 (PDCD5) in iNKT cell terminal maturation and iNKT1 fate determination. Mice with T cell-specific deletion of PDCD5 had decreased numbers of thymic and peripheral iNKT cells with a predominantly immature phenotype and defects in response to α-galactosylceramide. Loss of PDCD5 also selectively abolished the iNKT1 lineage by reducing T-bet expression in iNKT cells at an early thymic developmental stage (before CD44 upregulation). We further demonstrated that TOX2, one of the high mobility group proteins that was highly expressed in iNKT cells at stage 1 and could be stabilized by PDCD5, promoted the permissive histone H3K4me3 modification in the promoter region of Tbx21. These data indicate a pivotal and unique role of PDCD5/TOX2 in iNKT1 lineage determination. They also suggest that the fate of iNKT1 may be programmed at the developmental stage of iNKT cells in the thymus.


Conflict of interest statement

The authors declare no competing interests.

Figures

Fig. 1
Fig. 1
Mice carrying a T cell-specific deletion of PDCD5 had reduced thymic and peripheral iNKT cells. a Semiquantitative RT-PCR (left panel) and quantitative PCR (right panel) analysis of Pdcd5 mRNA in DP thymocytes from WT and PDCD5KO mice. β-actin was used as the housekeeping gene control. Data are representative of 3 independent experiments with 8 mice in each group. b, c Flow cytometry analysis of CD4 and CD8 expression in WT and PDCD5KO thymocytes. The frequency and number of CD4 and CD8 double-negative (DN), DP, CD4SP, or CD8SP thymocytes are shown (c). Data are representative of 3 independent experiments with 5 mice in the WT or PDCD5KO groups. d, e Flow cytometry analysis of iNKT cells (stained with PBS57-loaded CD1d tetramer (CD1d-tet) and TCRβ) in the thymus, spleen, and liver of WT and PDCD5KO mice. The percentage (left panels) and number (right panels) of iNKT cells in thymus, spleen, and liver were calculated (e). Data are representative of 3–4 independent experiments with 5–6 mice in each group. Student’s t-test was used for statistical analysis. *P< 0.05, **P< 0.01, ***P< 0.001, ns not significant
Fig. 2
Fig. 2
PDCD5 regulated iNKT cell development in a cell-intrinsic manner. Flow cytometry analysis (a) and percentage (b) of iNKT cells in the thymus, spleen, and liver from mixed bone marrow chimeric mice are shown. Data are representative of four chimeric mice. Student’s t-test was used for statistical analysis. *P < 0.05, **P < 0.01, ***P < 0.001
Fig. 3
Fig. 3
PDCD5 did not affect thymic-positive selection. a Quantitative PCR analysis of invariant Vα14-Jα18 TCR in WT and PDCD5KO DP thymocytes. Each group had five mice. b Quantitative PCR analysis of Sap, Slamf1, and Slamf6 mRNA in DP thymocytes. Each group contained four mice. c Flow cytometry analysis of the expression of CD1d, SLAMF1, and SLAMF6 in WT and PDCD5KO DP thymocytes. Data are representative of 4–5 mice per group. d Flow cytometry analysis of Egr2 expression in stage 0 (ST0) iNKT cells from WT and PDCD5KO mice. Each group contained four mice. Student’s t-test was used for statistical analysis; ns not significant
Fig. 4
Fig. 4
Impaired phenotypic and functional maturation of thymic iNKT cells in PDCD5KO mice. a Thymic development of iNKT cells in WT and PDCD5KO mice was analyzed by first gating on the cells expressing CD1d-tet, TCRβ, CD24, CD44, and NK1.1. ST0 cells with the phenotype of CD1d-tet+TCRβ+CD24+. The CD1d-tet+TCRβ+CD24- population was further analyzed for their expression of CD44 and NK1.1 (ST1, CD44-NK1.1-, ST2, CD44+NK1.1-, and ST3, CD44+NK1.1+). The frequency and number of each thymic iNKT cell population from WT and PDCD5KO mice were compared (right panels). Data are representative of three independent experiments with five mice in each group. b The percentages of Ly-6C+, Ly-49C/I+, and granzyme B+ cells (measured by flow cytometry) in WT and PDCD5KO thymic iNKT cells. Data are representative of 2–5 independent experiments with 3–10 mice in each group. c Flow cytometry analysis of CD4 expression in WT and PDCD5KO thymic ST3 iNKT cells. Data are representative of 2 independent experiments with 4–5 mice in each group. d Analysis of serum IFN-γ and IL-4 levels by ELISA. WT and PDCD5KO mice were stimulated with α-GalCer (2 μg/mouse) via intravenous injection. The sera were collected 2 h later. Data are representative of 2 independent experiments with 3–4 mice in each group. e Flow cytometry analysis of IFN-γ+, IL-4+, and IL-17A+ splenic iNKT cells. At 2 h after α-GalCer stimulation, the splenocytes from WT and PDCD5KO mice were harvested, cultured in the presence of BFA (3 μg/ml) for 3 h, and stained for intracellular cytokines. Data are representative of two independent experiments. f Representative H&E staining of liver sections obtained from α-GalCer-stimulated WT and PDCD5KO mice. The scale bar is 20 μm. g Quantification of serum ALT and AST obtained from α-GalCer-stimulated mice. Data are representative of 2 independent experiments with 3–4 mice in each group. h Flow cytometry analysis of neutrophils (Gr-1+CD11b+) infiltrated in the liver of α-GalCer-immunized mice. Data are representative of two independent experiments with five mice in each group. i The percentage of T- and B-cell activation (CD69+) in the liver of α-GalCer-immunized mice. Data are representative of 2 independent experiments with 3–5 mice in each group. Student’s t-test was used for statistical analysis. *P < 0.05, **P < 0.01, ***P < 0.001
Fig. 5
Fig. 5
PDCD5 did not affect cell proliferation and apoptosis at early developmental stages. a BrdU incorporation analysis of thymic iNKT cells from WT and PDCD5KO mice after 24 h of BrdU injection. Data are representative of 2–3 independent experiments with 4–7 mice in each group. b Flow cytometry analysis of Annexin V+ cells in WT and PDCD5KO thymic iNKT cells. Data are representative of 2 independent experiments with 4–5 mice in each group. c, d Flow cytometry analysis of Bcl-2 (c) and Bcl-xL (d) expression in WT and PDCD5KO thymic iNKT cells. Data are representative of 2 independent experiments with 4–5 mice in each group. e Comparison of iNKT cell frequencies in the thymus (left panel) and spleen (right panel) of WT and Pdcd5-null Bcl2tg mice. Data are representative of three independent experiments with three mice in each group. Student’s t-test was used for statistical analysis. *P < 0.05, **P < 0.01, ***P < 0.001
Fig. 6
Fig. 6
Thymic iNKT1 cell development was impaired in PDCD5KO mice. a, b Flow cytometry comparison of iNKT1 (PLZFloRORγt-), iNKT2 (PLZFhiRORγt-), and iNKT17 (PLZFintRORγt+) cells in thymic CD24 iNKT cells obtained from WT and PDCD5KO mice. The percentages (left panel) and numbers (right panel) of iNKT1, iNKT2, and iNKT17 cells were calculated (b). Data are representative of 3–4 independent experiments with 4–9 mice per group. c, d Intracellular staining of IFN-γ, IL-4, and IL-17A in thymic CD24- iNKT cells following 4 h of PMA (10 ng/ml) and ionomycin (100 ng/ml) stimulation and BFA (3 μg/ml) blockade. The percentages of IFN-γ+IL-4, IFN-γ+IL-4+, IFN-γ-IL-4+, and IFN-γ-IL-17A+ thymic CD24- iNKT cells are shown (d). Data are representative of 2–3 independent experiments with 3–5 mice per group. e Quantitative PCR analysis of Tbx21 mRNA in WT and PDCD5KO thymic iNKT cells. Data are representative of four independent experiments. f Flow cytometry analysis of T-bet expression in WT and PDCD5KO thymic iNKT cells and DP thymocytes. The percentages of T-bet+ cells among various cell populations were compared between WT and PDCD5KO mice (right panel). Data are representative of 3–4 independent experiments with 4–7 mice per group. g Comparison of the fluorescence intensity of CD122 staining (top panel) and percentage of CXCR3+ cells (bottom panel) between WT and PDCD5KO thymic iNKT cells. Data are representative of 3–4 independent experiments with 4–7 mice per group. h Flow cytometry analysis of p-STAT5 in WT and PDCD5KO thymic iNKT cells after 10 min of IL-15 stimulation. Data are representative of two independent experiments with three mice per group. Student’s t-test was used for statistical analysis. *P < 0.05, **P < 0.01, ***P < 0.001
Fig. 7
Fig. 7
Epigenetic regulation of T-bet expression by PDCD5/TOX2. a Quantitative PCR analysis of Pdcd5 mRNA in DP thymocytes and various thymic iNKT cell populations obtained from WT and PDCD5KO mice. Data are representative of 2–4 independent experiments. b The analysis of Tbx21 mRNA (by quantitative PCR, left panel) and the T-bet+ cell percentage (by flow cytometry, right panel) in vector- or PDCD5-transduced DN32.D3 cells. Data are representative of three independent experiments. c Western blotting of Ets1 and TOX2 expression in WT and PDCD5KO thymic iNKT cells (left panel). The ratio of KO-to-WT Ets1 and TOX2 protein expression is shown in the right panels. The expression levels were normalized to β-actin. Data are representative of 2–4 independent experiments. d 293T cells were cotransfected with Flag-HA-PDCD5 and GFP-TOX2 plasmids. The interaction of PDCD5 and TOX2 was measured by immunoprecipitation and western blotting. Data are representative of two independent experiments. e 293T cells were cotransfected with HA-Ub, GFP-TOX2, and Flag-HA-PDCD5 or control vector. After 24 h, the cells were treated with 10 μM MG132 for another 6 h. Ubiquitination of TOX2 was measured by immunoprecipitation and western blotting. Data are representative of two independent experiments. f Western blotting of TOX2 expression in vector- or PDCD5-transduced DN32.D3 cells. g Analysis of Tbx21 mRNA (by quantitative PCR, left panel) and the T-bet+ cell percentage (by flow cytometry, right panel) in vector- or TOX2-transduced DN32.D3 cells. Data are representative of 2–3 independent experiments. h ChIP-qPCR of the H3K4me3 modification in the promoter region of Tbx21 in vector- or TOX2-transduced DN32.D3 cells. Data are representative of two independent experiments. i ChIP-qPCR of the H3K4me3 modification in the promoter region of Tbx21 in thymic iNKT cells from WT and PDCD5KO mice. Data are representative of two independent experiments. Student’s t-test was used for statistical analysis. *P < 0.05, ***P < 0.001

Similar articles

Cited by

References

    1. Georgiev H, Ravens I, Benarafa C, Forster R, Bernhardt G. Distinct gene expression patterns correlate with developmental and functional traits of iNKT subsets. Nat. Commun. 2016;7:13116. doi: 10.1038/ncomms13116. - DOI - PMC - PubMed
    1. Bendelac A, Savage PB, Teyton L. The biology of NKT cells. Annu. Rev. Immunol. 2007;25:297–336. doi: 10.1146/annurev.immunol.25.022106.141711. - DOI - PubMed
    1. Godfrey DI, Stankovic S, Baxter AG. Raising the NKT cell family. Nat. Immunol. 2010;11:197–206. doi: 10.1038/ni.1841. - DOI - PubMed
    1. Kronenberg M. Toward an understanding of NKT cell biology: progress and paradoxes. Annu. Rev. Immunol. 2005;23:877–900. doi: 10.1146/annurev.immunol.23.021704.115742. - DOI - PubMed
    1. Ma CS, Nichols KE, Tangye SG. Regulation of cellular and humoral immune responses by the SLAM and SAP families of molecules. Annu. Rev. Immunol. 2007;25:337–379. doi: 10.1146/annurev.immunol.25.022106.141651. - DOI - PubMed

Publication types