

Diet-Induced Obesity Affects Muscle Regeneration After Murine Blunt Muscle Trauma-A Broad Spectrum Analysis
- PMID: 29922174
- PMCID: PMC5996306
- DOI: 10.3389/fphys.2018.00674
Diet-Induced Obesity Affects Muscle Regeneration After Murine Blunt Muscle Trauma-A Broad Spectrum Analysis
Abstract
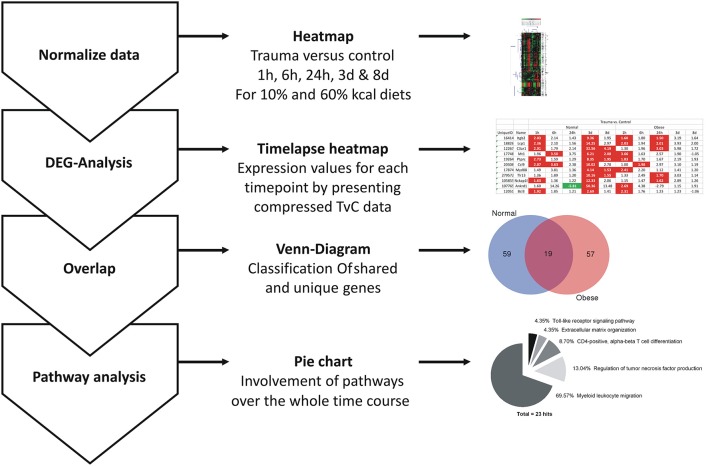
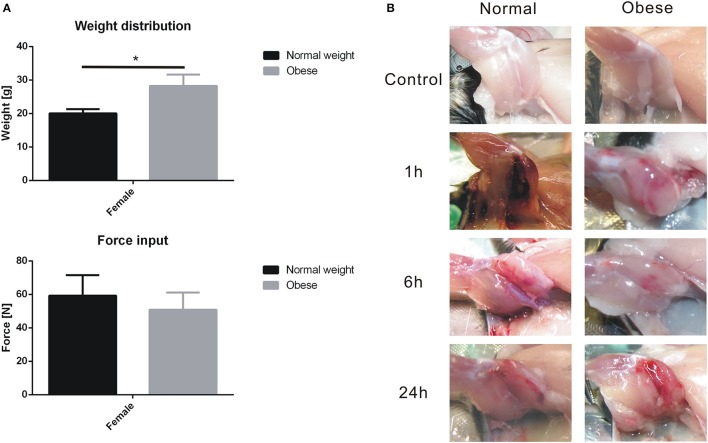
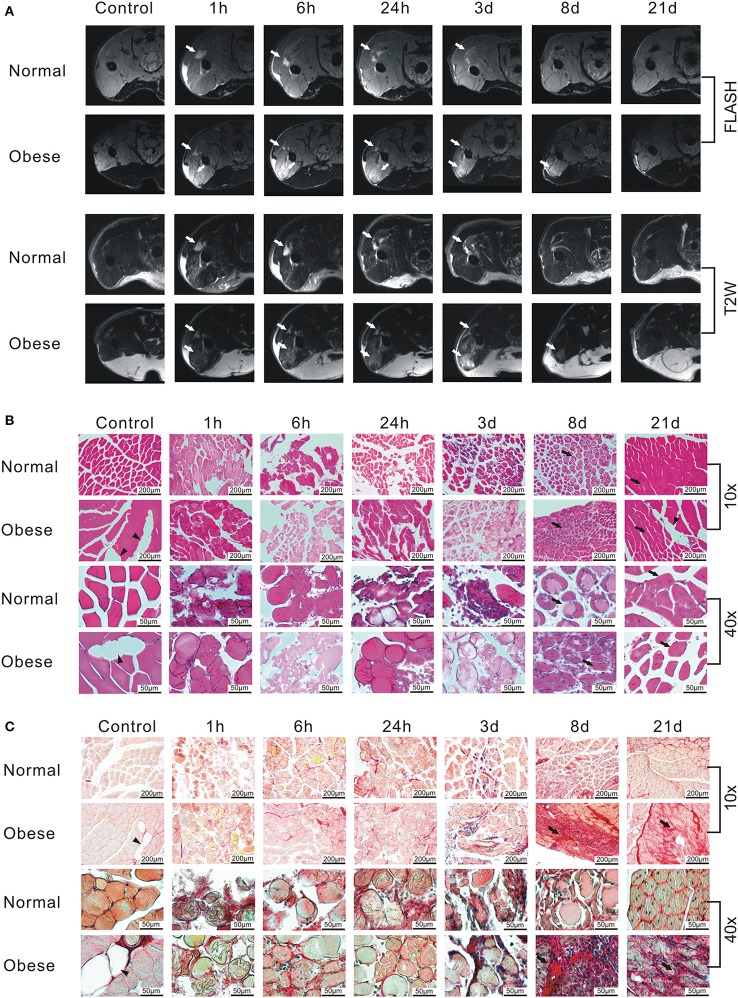
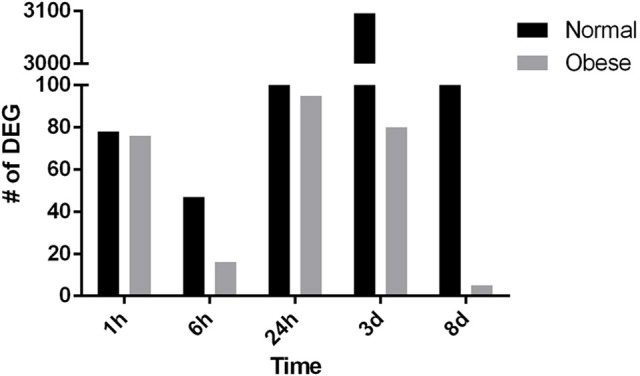
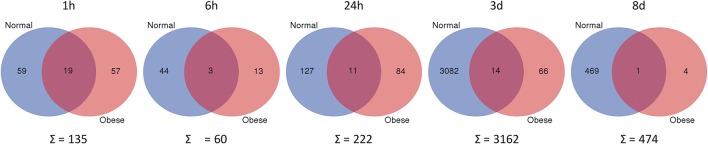
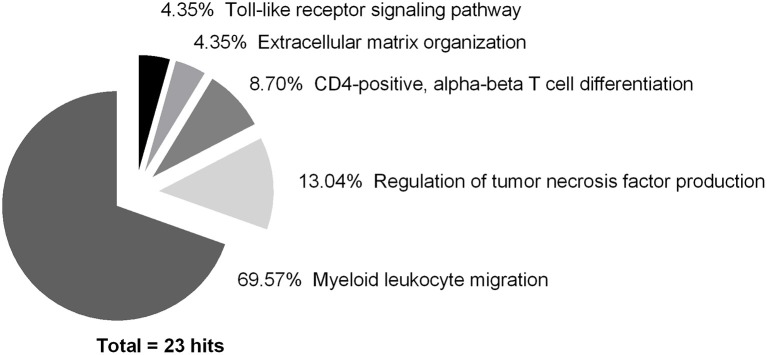
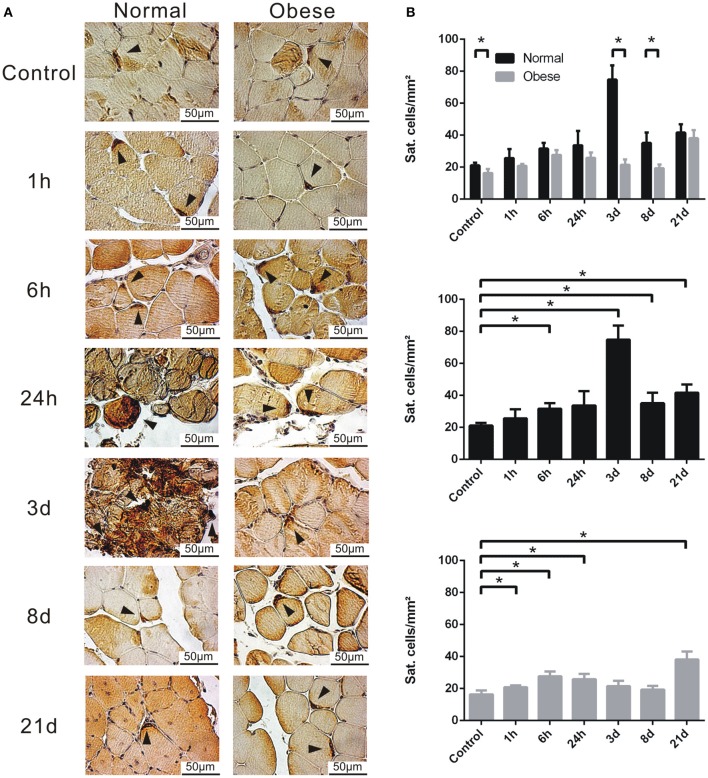
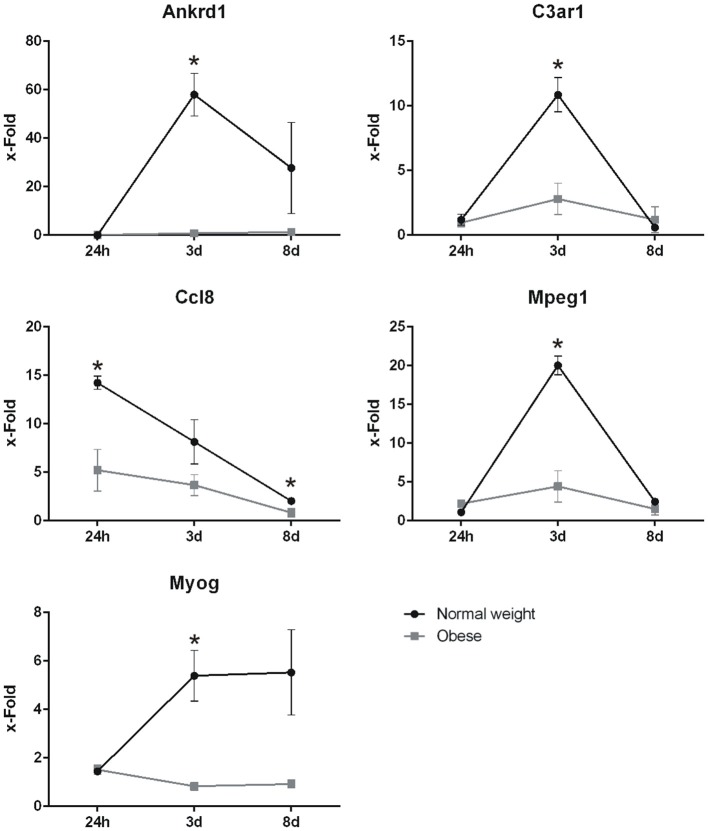
Injury to skeletal muscle affects millions of people worldwide. The underlying regenerative process however, is a very complex mechanism, time-wise highly coordinated, and subdivided in an initial inflammatory, a regenerative and a remodeling phase. Muscle regeneration can be impaired by several factors, among them diet-induced obesity (DIO). In order to evaluate if obesity negatively affects healing processes after trauma, we utilized a blunt injury approach to damage the extensor iliotibialis anticus muscle on the left hind limb of obese and normal weight C57BL/6J without showing any significant differences in force input between normal weight and obese mice. Magnetic resonance imaging (MRI) of the injury and regeneration process revealed edema formation and hemorrhage exudate in muscle tissue of normal weight and obese mice. In addition, morphological analysis of physiological changes revealed tissue necrosis, immune cell infiltration, extracellular matrix (ECM) remodeling, and fibrosis formation in the damaged muscle tissue. Regeneration was delayed in muscles of obese mice, with a higher incidence of fibrosis formation due to hampered expression levels of genes involved in ECM organization. Furthermore, a detailed molecular fingerprint in different stages of muscle regeneration underlined a delay or even lack of a regenerative response to injury in obese mice. A time-lapse heatmap determined 81 differentially expressed genes (DEG) with at least three hits in our model at all-time points, suggesting key candidates with a high impact on muscle regeneration. Pathway analysis of the DEG revealed five pathways with a high confidence level: myeloid leukocyte migration, regulation of tumor necrosis factor production, CD4-positive, alpha-beta T cell differentiation, ECM organization, and toll-like receptor (TLR) signaling. Moreover, changes in complement-, Wnt-, and satellite cell-related genes were found to be impaired in obese animals after trauma. Furthermore, histological satellite cell evaluation showed lower satellite cell numbers in the obese model upon injury. Ankrd1, C3ar1, Ccl8, Mpeg1, and Myog expression levels were also verified by qPCR. In summary, increased fibrosis formation, the reduction of Pax7+ satellite cells as well as specific changes in gene expression and signaling pathways could explain the delay of tissue regeneration in obese mice post trauma.
Keywords: C57BL/6J; fibrosis; microarray; obesity; satellite cells; skeletal muscle; trauma.
Figures
Similar articles
-
Influence of Obesity on the Organization of the Extracellular Matrix and Satellite Cell Functions After Combined Muscle and Thorax Trauma in C57BL/6J Mice.Front Physiol. 2020 Jul 28;11:849. doi: 10.3389/fphys.2020.00849. eCollection 2020. Front Physiol. 2020. PMID: 32848828 Free PMC article.
-
Comparison of Fatty Acid and Gene Profiles in Skeletal Muscle in Normal and Obese C57BL/6J Mice before and after Blunt Muscle Injury.Front Physiol. 2018 Jan 30;9:19. doi: 10.3389/fphys.2018.00019. eCollection 2018. Front Physiol. 2018. PMID: 29441023 Free PMC article.
-
Influence of obesity on remodeling of lung tissue and organization of extracellular matrix after blunt thorax trauma.Respir Res. 2020 Sep 17;21(1):238. doi: 10.1186/s12931-020-01502-0. Respir Res. 2020. PMID: 32943048 Free PMC article.
-
The effects of obesity on skeletal muscle regeneration.Front Physiol. 2013 Dec 17;4:371. doi: 10.3389/fphys.2013.00371. Front Physiol. 2013. PMID: 24381559 Free PMC article. Review.
-
Extracellular matrix: the critical contributor to skeletal muscle regeneration-a comprehensive review.Inflamm Regen. 2023 Nov 27;43(1):58. doi: 10.1186/s41232-023-00308-z. Inflamm Regen. 2023. PMID: 38008778 Free PMC article. Review.
Cited by
-
Retinoic acid signalling in fibro/adipogenic progenitors robustly enhances muscle regeneration.EBioMedicine. 2020 Oct;60:103020. doi: 10.1016/j.ebiom.2020.103020. Epub 2020 Sep 24. EBioMedicine. 2020. PMID: 32980698 Free PMC article.
-
The Microenvironment Is a Critical Regulator of Muscle Stem Cell Activation and Proliferation.Front Cell Dev Biol. 2019 Oct 29;7:254. doi: 10.3389/fcell.2019.00254. eCollection 2019. Front Cell Dev Biol. 2019. PMID: 31737625 Free PMC article. Review.
-
Inhibition of angiogenesis and regenerative lung growth in Lepob/ob mice through adiponectin-VEGF/VEGFR2 signaling.Front Cardiovasc Med. 2024 Oct 16;11:1491971. doi: 10.3389/fcvm.2024.1491971. eCollection 2024. Front Cardiovasc Med. 2024. PMID: 39479393 Free PMC article.
-
Influence of Obesity on the Organization of the Extracellular Matrix and Satellite Cell Functions After Combined Muscle and Thorax Trauma in C57BL/6J Mice.Front Physiol. 2020 Jul 28;11:849. doi: 10.3389/fphys.2020.00849. eCollection 2020. Front Physiol. 2020. PMID: 32848828 Free PMC article.
-
Histopathological and aquaporin7 mRNA expression analyzes in the skeletal and cardiac muscles of obese db/db mice.J Vet Med Sci. 2021 Jul 28;83(7):1155-1160. doi: 10.1292/jvms.20-0470. Epub 2021 May 31. J Vet Med Sci. 2021. PMID: 34053976 Free PMC article.
References
LinkOut - more resources
Full Text Sources
Other Literature Sources
Molecular Biology Databases
Research Materials
Miscellaneous