

Transcriptomics of the Vaccine Immune Response: Priming With Adjuvant Modulates Recall Innate Responses After Boosting
- PMID: 29922291
- PMCID: PMC5996052
- DOI: 10.3389/fimmu.2018.01248
Transcriptomics of the Vaccine Immune Response: Priming With Adjuvant Modulates Recall Innate Responses After Boosting
Abstract
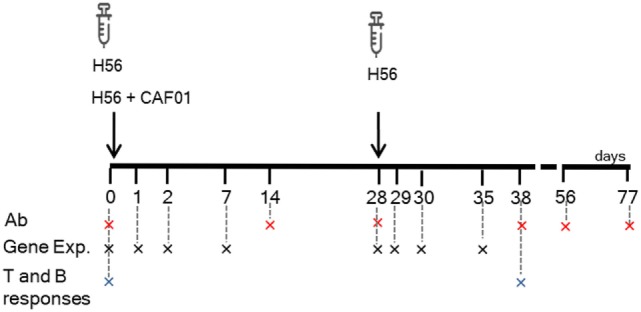
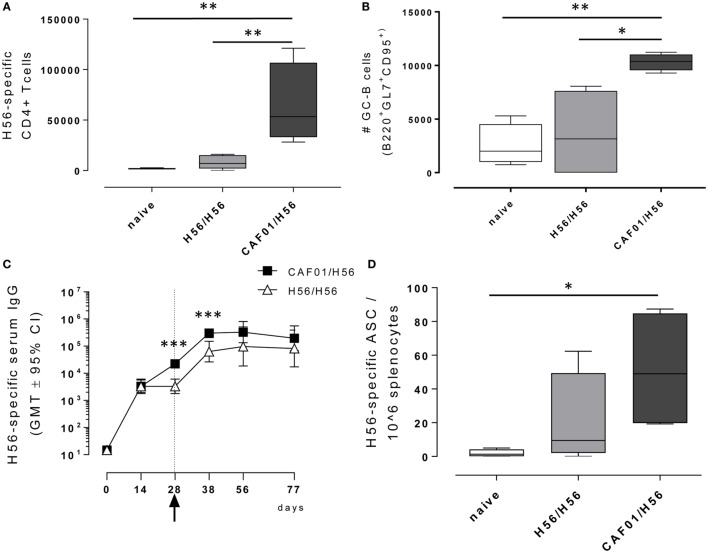
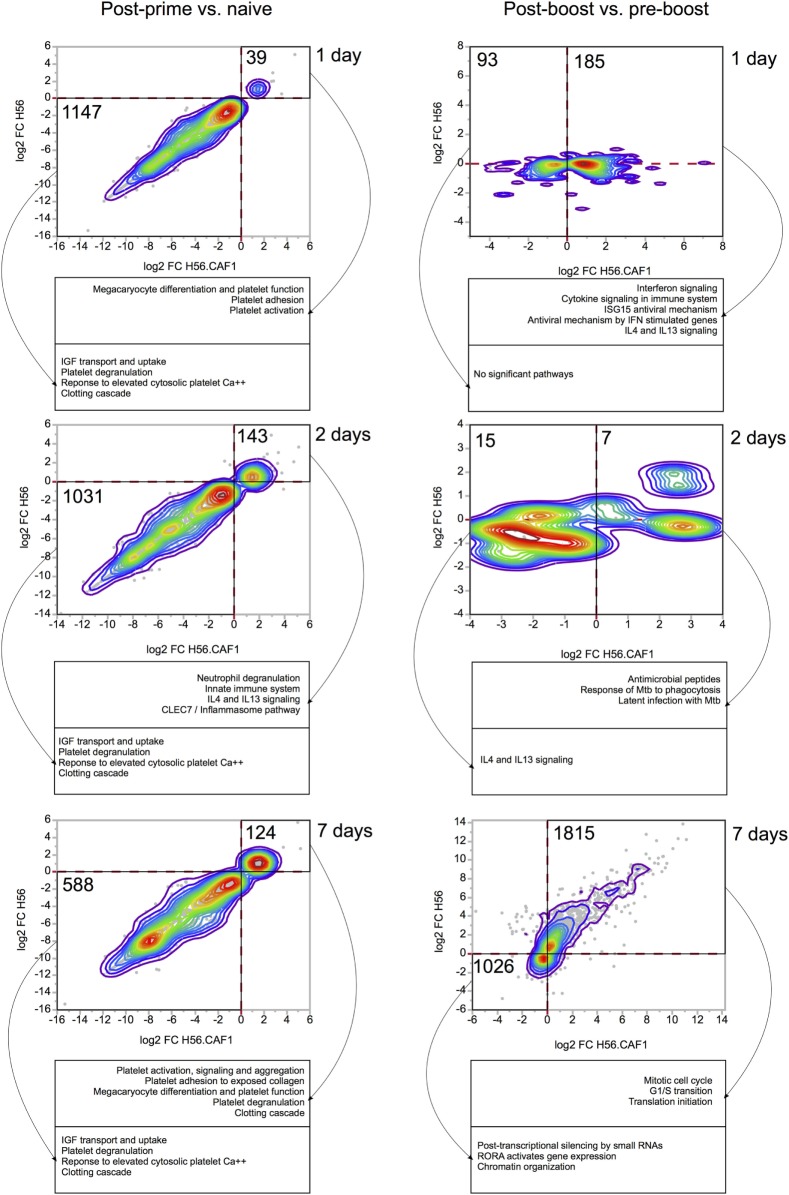
Transcriptomic profiling of the immune response induced by vaccine adjuvants is of critical importance for the rational design of vaccination strategies. In this study, transcriptomics was employed to profile the effect of the vaccine adjuvant used for priming on the immune response following re-exposure to the vaccine antigen alone. Mice were primed with the chimeric vaccine antigen H56 of Mycobacterium tuberculosis administered alone or with the CAF01 adjuvant and boosted with the antigen alone. mRNA sequencing was performed on blood samples collected 1, 2, and 7 days after priming and after boosting. Gene expression analysis at day 2 after priming showed that the CAF01 adjuvanted vaccine induced a stronger upregulation of the innate immunity modules compared with the unadjuvanted formulation. The immunostimulant effect of the CAF01 adjuvant, used in the primary immunization, was clearly seen after a booster immunization with a low dose of antigen alone. One day after boost, we observed a strong upregulation of multiple genes in blood of mice primed with H56 + CAF01 compared with mice primed with the H56 alone. In particular, blood transcription modules related to innate immune response, such as monocyte and neutrophil recruitment, activation of antigen-presenting cells, and interferon response were activated. Seven days after boost, differential expression of innate response genes faded while a moderate differential expression of T cell activation modules was appreciable. Indeed, immunological analysis showed a higher frequency of H56-specific CD4+ T cells and germinal center B cells in draining lymph nodes, a strong H56-specific humoral response and a higher frequency of antibody-secreting cells in spleen of mice primed with H56 + CAF01. Taken together, these data indicate that the adjuvant used for priming strongly reprograms the immune response that, upon boosting, results in a stronger recall innate response essential for shaping the downstream adaptive response.
Keywords: CAF01; RNA sequencing; adaptive immunity; recall innate response; vaccine adjuvant.
Figures

Similar articles
-
Intrapulmonary (i.pulmon.) Pull Immunization With the Tuberculosis Subunit Vaccine Candidate H56/CAF01 After Intramuscular (i.m.) Priming Elicits a Distinct Innate Myeloid Response and Activation of Antigen-Presenting Cells Than i.m. or i.pulmon. Prime Immunization Alone.Front Immunol. 2020 May 7;11:803. doi: 10.3389/fimmu.2020.00803. eCollection 2020. Front Immunol. 2020. PMID: 32457748 Free PMC article.
-
Heterologous Prime-Boost Combinations Highlight the Crucial Role of Adjuvant in Priming the Immune System.Front Immunol. 2018 Mar 12;9:380. doi: 10.3389/fimmu.2018.00380. eCollection 2018. Front Immunol. 2018. PMID: 29593710 Free PMC article.
-
Heterologous prime-boost immunization combining parenteral and mucosal routes with different adjuvants mounts long-lived CD4+ T cell responses in lungs.Front Immunol. 2025 Jul 1;16:1599713. doi: 10.3389/fimmu.2025.1599713. eCollection 2025. Front Immunol. 2025. PMID: 40666512 Free PMC article.
-
Optimize Prime/Boost Vaccine Strategies: Trained Immunity as a New Player in the Game.Front Immunol. 2021 Mar 8;12:612747. doi: 10.3389/fimmu.2021.612747. eCollection 2021. Front Immunol. 2021. PMID: 33763063 Free PMC article. Review.
-
Skin delivery of a hybrid liposome/ISCOM vaccine implicates a role for adjuvants in rapid modulation of inflammatory cells involved in innate immunity before the enhancement of adaptive immune responses.Immunol Cell Biol. 1998 Jun;76(3):245-55. doi: 10.1046/j.1440-1711.1998.00742.x. Immunol Cell Biol. 1998. PMID: 9682968 Review.
Cited by
-
Human Transcriptomic Response to the VSV-Vectored Ebola Vaccine.Vaccines (Basel). 2021 Jan 20;9(2):67. doi: 10.3390/vaccines9020067. Vaccines (Basel). 2021. PMID: 33498214 Free PMC article.
-
Adjuvant activity of tubeimosides by mediating the local immune microenvironment.Front Immunol. 2023 Feb 10;14:1108244. doi: 10.3389/fimmu.2023.1108244. eCollection 2023. Front Immunol. 2023. PMID: 36845089 Free PMC article.
-
In situ injectable hydrogel-loaded drugs induce anti-tumor immune responses in melanoma immunochemotherapy.Mater Today Bio. 2022 Mar 15;14:100238. doi: 10.1016/j.mtbio.2022.100238. eCollection 2022 Mar. Mater Today Bio. 2022. PMID: 35330634 Free PMC article.
-
Recent developments in systems biology and genetic engineering toward design of vaccines for TB.Crit Rev Biotechnol. 2022 Jun;42(4):532-547. doi: 10.1080/07388551.2021.1951649. Epub 2021 Oct 12. Crit Rev Biotechnol. 2022. PMID: 34641752 Free PMC article. Review.
-
Computational Analysis of Multiparametric Flow Cytometric Data to Dissect B Cell Subsets in Vaccine Studies.Cytometry A. 2020 Mar;97(3):259-267. doi: 10.1002/cyto.a.23922. Epub 2019 Nov 11. Cytometry A. 2020. PMID: 31710181 Free PMC article.
References
-
- Ciabattini A, Prota G, Christensen D, Andersen P, Pozzi G, Medaglini D. Characterization of the antigen-specific CD4(+) T Cell response induced by prime-boost strategies with CAF01 and CpG adjuvants administered by the intranasal and subcutaneous routes. Front Immunol (2015) 6:430.10.3389/fimmu.2015.00430 - DOI - PMC - PubMed
Publication types
MeSH terms
Substances
Grants and funding
LinkOut - more resources
Full Text Sources
Other Literature Sources
Medical
Research Materials