. 2018 Jun 5:9:1286.
doi: 10.3389/fimmu.2018.01286. eCollection 2018.

seq-ImmuCC: Cell-Centric View of Tissue Transcriptome Measuring Cellular Compositions of Immune Microenvironment From Mouse RNA-Seq Data

Affiliations

seq-ImmuCC: Cell-Centric View of Tissue Transcriptome Measuring Cellular Compositions of Immune Microenvironment From Mouse RNA-Seq Data

Ziyi Chen et al. Front Immunol. .

Abstract

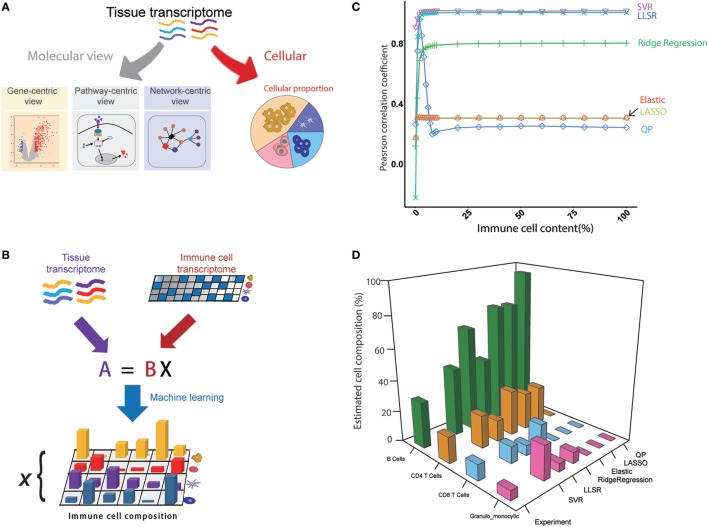
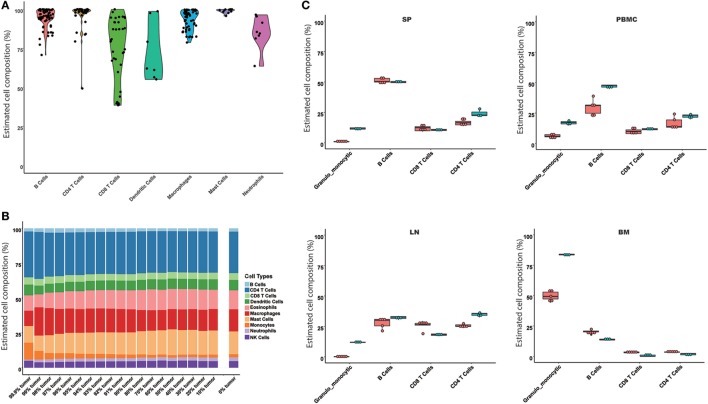
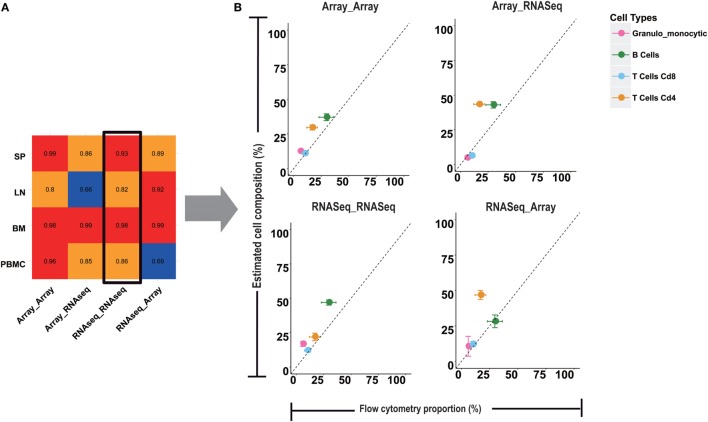
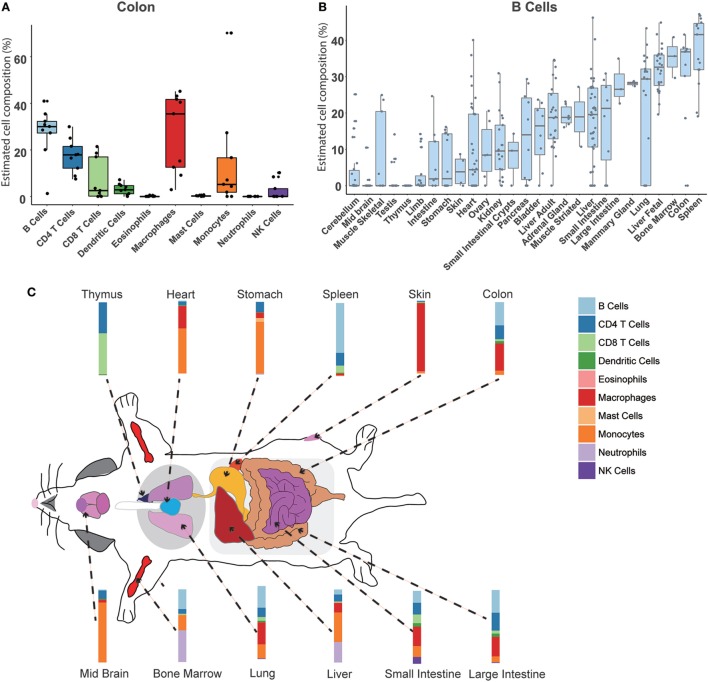
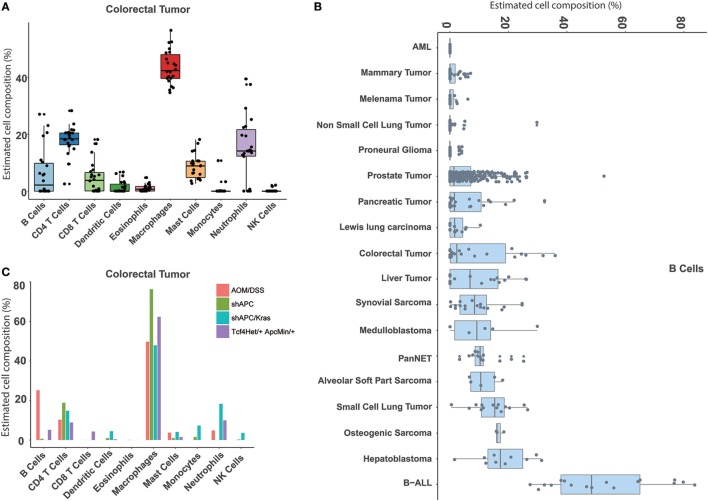
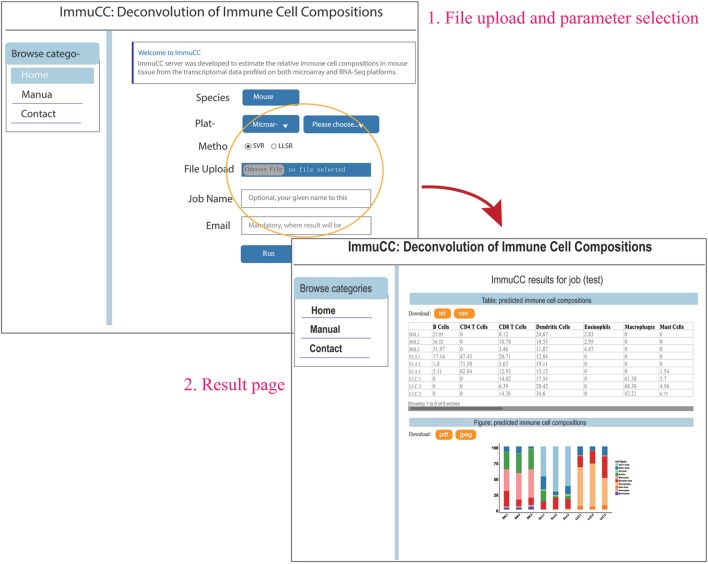
The RNA sequencing approach has been broadly used to provide gene-, pathway-, and network-centric analyses for various cell and tissue samples. However, thus far, rich cellular information carried in tissue samples has not been thoroughly characterized from RNA-Seq data. Therefore, it would expand our horizons to better understand the biological processes of the body by incorporating a cell-centric view of tissue transcriptome. Here, a computational model named seq-ImmuCC was developed to infer the relative proportions of 10 major immune cells in mouse tissues from RNA-Seq data. The performance of seq-ImmuCC was evaluated among multiple computational algorithms, transcriptional platforms, and simulated and experimental datasets. The test results showed its stable performance and superb consistency with experimental observations under different conditions. With seq-ImmuCC, we generated the comprehensive landscape of immune cell compositions in 27 normal mouse tissues and extracted the distinct signatures of immune cell proportion among various tissue types. Furthermore, we quantitatively characterized and compared 18 different types of mouse tumor tissues of distinct cell origins with their immune cell compositions, which provided a comprehensive and informative measurement for the immune microenvironment inside tumor tissues. The online server of seq-ImmuCC are freely available at http://wap-lab.org:3200/immune/.

Keywords: RNA-Seq; deconvolution; immune cell; machine learning; mouse; tumor.


Figures

Figure 1
Figure 1
An overview of the seq-ImmuCC model. (A) Molecular and cellular views of the tissue transcriptome. (B) Schematics of the seq-ImmuCC model. (C) Comparison of six machine learning methods over the simulated data. (D) Comparison of six machine learning methods with the experimental data.
Figure 2
Figure 2
Evaluation of the seq-ImmuCC model in the simulated and experimental data. The performance of the model was evaluated in the enriched cell samples (A), simulated tumor samples (B), and measured results from flow cytometry (C). Four immune cell types were compared in (C), namely, granulo-monocytic cells, CD4 T cells, CD8 T cells, and B cells. Red: predicted results; green: flow cytometry results.
Figure 3
Figure 3
Comparison of microarray and RNA-seq based deconvolution models. (A) Four cross models with microarray or RNA-seq data as the training or testing input were compared. The value in the heatmap is the Pearson correlation coefficient between the results from four computational models and flow cytometry in four tissues. (B) The error bar plots are the comparison of the RNA-seq training and testing model with the flow cytometry for granulo-monocytic cells, CD4 T cells, CD8 T cells, and B cells in peripheral blood mononuclear cell.
Figure 4
Figure 4
Atlas of immune cell compositions in normal mouse tissues. (A). Inferred proportions of 10 immune cells in the colon. (B) Distribution of B cell proportion across 27 mouse tissues. (C) Immune cell fingerprint in 12 representative mouse tissues.
Figure 5
Figure 5
Atlas of immune cell compositions in mouse tumor tissues. (A) Inferred proportions of 10 immune cells in colorectal tumors. (B) Distribution of B cell proportion across 18 tumor types. (C) Comparison of the immune cell compositions in the same tumor type (colorectal tumors) with four different inducing models.
Figure 6
Figure 6
Online webserver for the deconvolution of immune cell compositions in mouse tissues. The webserver is available at http://wap-lab.org:3200/immune/.

References

    1. De Simone M, Arrigoni A, Rossetti G, Gruarin P, Ranzani V, Politano C, et al. Transcriptional landscape of human tissue lymphocytes unveils uniqueness of tumor-infiltrating T regulatory cells. Immunity (2016) 45:1135–47.10.1016/j.immuni.2016.10.021 - DOI - PMC - PubMed
    1. Tisoncik-Go J, Gasper DJ, Kyle JE, Eisfeld AJ, Selinger C, Hatta M, et al. Integrated omics analysis of pathogenic host responses during pandemic H1N1 influenza virus infection: the crucial role of lipid metabolism. Cell Host Microbe (2016) 19:254–66.10.1016/j.chom.2016.01.002 - DOI - PMC - PubMed
    1. Odhams CA, Cunninghame Graham DS, Vyse TJ. Profiling RNA-Seq at multiple resolutions markedly increases the number of causal eQTLs in autoimmune disease. PLoS Genet (2017) 13:e1007071.10.1371/journal.pgen.1007071 - DOI - PMC - PubMed
    1. Lonnberg T, Chen Z, Lahesmaa R. From a gene-centric to whole-proteome view of differentiation of T helper cell subsets. Brief Funct Genomics (2013) 12:471–82.10.1093/bfgp/elt033 - DOI - PMC - PubMed
    1. Karathia H, Kingsford C, Girvan M, Hannenhalli S. A pathway-centric view of spatial proximity in the 3D nucleome across cell lines. Sci Rep (2016) 6:39279.10.1038/srep39279 - DOI - PMC - PubMed

Publication types