. 2018 Jun 15:6:e4869.
doi: 10.7717/peerj.4869. eCollection 2018.

Primates in peril: the significance of Brazil, Madagascar, Indonesia and the Democratic Republic of the Congo for global primate conservation

Affiliations

Primates in peril: the significance of Brazil, Madagascar, Indonesia and the Democratic Republic of the Congo for global primate conservation

Alejandro Estrada et al. PeerJ. .

Abstract

Primates occur in 90 countries, but four-Brazil, Madagascar, Indonesia, and the Democratic Republic of the Congo (DRC)-harbor 65% of the world's primate species (439) and 60% of these primates are Threatened, Endangered, or Critically Endangered (IUCN Red List of Threatened Species 2017-3). Considering their importance for global primate conservation, we examine the anthropogenic pressures each country is facing that place their primate populations at risk. Habitat loss and fragmentation are main threats to primates in Brazil, Madagascar, and Indonesia. However, in DRC hunting for the commercial bushmeat trade is the primary threat. Encroachment on primate habitats driven by local and global market demands for food and non-food commodities hunting, illegal trade, the proliferation of invasive species, and human and domestic-animal borne infectious diseases cause habitat loss, population declines, and extirpation. Modeling agricultural expansion in the 21st century for the four countries under a worst-case-scenario, showed a primate range contraction of 78% for Brazil, 72% for Indonesia, 62% for Madagascar, and 32% for DRC. These pressures unfold in the context of expanding human populations with low levels of development. Weak governance across these four countries may limit effective primate conservation planning. We examine landscape and local approaches to effective primate conservation policies and assess the distribution of protected areas and primates in each country. Primates in Brazil and Madagascar have 38% of their range inside protected areas, 17% in Indonesia and 14% in DRC, suggesting that the great majority of primate populations remain vulnerable. We list the key challenges faced by the four countries to avert primate extinctions now and in the future. In the short term, effective law enforcement to stop illegal hunting and illegal forest destruction is absolutely key. Long-term success can only be achieved by focusing local and global public awareness, and actively engaging with international organizations, multinational businesses and consumer nations to reduce unsustainable demands on the environment. Finally, the four primate range countries need to ensure that integrated, sustainable land-use planning for economic development includes the maintenance of biodiversity and intact, functional natural ecosystems.

Keywords: Agricultural expansion; Community forests; Corruption and governance; Deforestation; Forest-risk commodity trade; Hunting; Illegal trade; Logging; Poaching; Protected areas.


Conflict of interest statement

Russell A. Mittermeier and Anthony B. Rylands are employed by Global Wildlife Conservation, Christoph Schwitzer is employed by Bristol Zoological Society, Christian Roos is employed by Deutsches Primatenzentrum, Made Wedana is employed by The Aspinall Foundation and Arif Setiawan is employed by SwaraOwa.

Figures

Figure 1
Figure 1. The richness of species and IUCN species conservation and population status of primates in Brazil, the Democratic Republic of the Congo (DRC), Madagascar and Indonesia.
In the graph, the numbers below the names of the countries refer to the number of species used to calculate the percentages for species threatened and declining populations. Because population assessments are not available for all species, we focused on those for which recent information is available (Table S2). Source of data: IUCN Red List 2017-3 (http://www.iucnredlist.org; accessed 5 February 2018).
Figure 2
Figure 2
(A) Trends in tree cover loss (>30% canopy cover) in Brazil, DRC, Indonesia, and Madagascar for the period 2001–2016. (B) Cumulative tree cover (in Intact Forest Landscapes IFL) loss in each country for the same period. Source of data Global Forest Watch (http://www.globalforestwatch.org; accessed 5 February 2018). IFL: an unbroken expanse of natural ecosystems of at least 500 km2, forested, and without signs of significant human activity (Potapov et al., 2008). Forest loss ranged in Brazil from 2.74 M ha in 2001 to 5.37 M ha in 2016; in Indonesia from 745.43 K ha to 2.42 M ha; in DRC from 455.43 K ha to 1.38 M ha, and in Madagascar from 86.95 K ha to 383.55 K ha.
Figure 3
Figure 3. The projected expansion of agriculture and pastures in (A) Brazil, (B) the Democratic Republic of the Congo, (C) Madagascar, and (D) Indonesia for 2050 and 2100, under a worst-case scenario of land use from native vegetation to agricultural fields and pasture.
See Text S1 for a description of the methods used. Data on species geographic distribution are derived from IUCN (2017) and the scenarios of agricultural expansion from the Integrated Model to Assess the Global Environment (IMAGE, version 2.2) (IMAGE Team, 2001) (see Dobrovolski et al., 2013). Notice the spatial shift of conservation conflicts, including the abandonment of some agricultural areas by 2100 in DRC and Madagascar. This condition, however, may not imply an immediate benefit for primate species, as local populations would have been extirpated, areas would have been dramatically altered prior to abandonment, and would likely require decades to regenerate to closed-canopy, old secondary forest. See Fig. S6 for a model based on an optimistic scenario and on a business-as-usual scenario.
Figure 4
Figure 4. Photos of selected land cover changes in primate range countries, illegal primate trade, and the primate bushmeat trade.
Photo credits include the following: (A) Soybean plantation and recent deforestation of forest patches in the Cerrado Biome, Jataí, Goiás State, Brazil (Photo credit: Fabiano R. de Melo), (B) Pastures for cattle ranching surrounding Atlantic Forest patches inside the Cerrado Biome, Rio Verde, Goiás State, Brazil. (Photo credit: Izaltino Guimarães Jr), (C) Indonesia, illegal logging Central Kalimantan (Photo credit: R. Butler), (D) Indonesia, deforestation (Photo credit: R. Butler), (E) Indonesia, Sunda slow loris (Nycticebus coucang), sold in Jakarta (Photo credit: A. Walmsley and Little Fireface Project), (F) DRC, smoked bonobo (Pan paniscus) meat at a rural meat market (Photo credit: J. Head).
Figure 5
Figure 5. Total urban and rural population growth and projections for (A) Brazil, (B) DRC, (C) Madagascar, and (D) Indonesia.
Steep growth is forecasted for the next few decades with urban populations significantly increasing, while rural populations are expected to decline. Source: http://www.fao.org/faostat/en/#data (accessed 15 August 2017).
Figure 6
Figure 6
(A) Gross Domestic Product per capita (GDPPC International USD) in the four countries for the period 1990 to 2015. Included for comparison are the world’s average and the average for the top 25 most developed nations. (B) Trends for DRC and Madagascar. (C) Percent gain for each country for 1990–2006. Available at http://data.worldbank.org/indicator/NY.GDP.PCAP.CD?contextual=max&locations=BR&year_high_desc=false; http://data.worldbank.org/indicator/NY.GDP.PCAP.CD (accessed November 2017).
Figure 7
Figure 7. The 1990–2015 Human Development Index (HDI) in Brazil, Indonesia, Madagascar, and DRC (Lowest human development = 0; highest = 1.0). Also shown is the average HDI for the world and for the top 25 most developed nations.
The number in parentheses after each country indicates their HDI world rank. The number in parenthesis after the name of each country indicates its HDI ranking compared to 188 countries. No data are available for Madagascar for 1990. Source: United Nations Development Program (http://hdr.undp.org/en/composite/trend (accessed 11 January 2018).
Figure 8
Figure 8. The graph, produced using the World Bank database, shows the percentile rank of four key World Bank governance indicators for Brazil, DRC, Madagascar, and Indonesia. Percentile rank: the percentage of countries that rate below the selected country.
Higher values indicate better governance ratings. Shown for comparison is the percentile rank for high-income OECD countries (n = 35; Organization for Economic Co-operation and Development). Percentile ranks have been adjusted to account for changes over time in the set of countries covered by the governance indicators. The statistically likely range of the governance indicator is shown as a thin black line. For instance, a bar of length 75% with the thin black lines extending from 60% to 85% has the following interpretation: an estimated 75% of the countries rate worse and an estimated 25% of the countries rate better than the country of choice. Source: http://info.worldbank.org/governance/wgi/index.aspx#reports (accessed 17 November 2017).
Figure 9
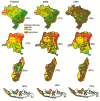
Figure 9. Distribution of protected areas and primate distributions in (A) Brazil, (B) DRC, (C) Madagascar, and (D) Indonesia.
In this model, primate species distributions are based on data from the IUCN Red List (accessed May 2017), protected areas distributions from UNEP-WCMC (2017) and forest cover from Hansen et al. (2013). Images are scaled to ca. 300 m of spatial resolution. We included 2,190 protected areas in the Brazil dataset, 49 in DRC, 147 in Madagascar and 646 in Indonesia (Text S1).
Figure 10
Figure 10. Photos of selected primates from each country.
Conservation status and photo credits include the following: (A) DRC, Grauer’s gorilla (Gorilla beringei graueri), Critically Endangered, (Photo credit: J. Martin), (B) Madagascar, Sahafary sportive lemur (Lepilemur septentrionalis) Critically Endangered (Photo credit: R. A. Mittermeier), (C) Indonesia, Javan slow loris (Nycticebus javanicus), Critically Endangered (Photo Credit: Andrew Walmsley/Little Fireface Project), (D) Brazil, northern muriqui (Brachyteles hypoxanthus), Critically Endangered (Photo credit: Raphaella Coutinho), (E) Brazil, pygmy marmoset (Cebuella pygmaea), Vulnerable, (Photo credit: Pablo Yépez), (F) Sumatran orangutan (Pongo abelii), Critically Endangered (Photo Credit: Perry van Duijnhoven).
Figure 11
Figure 11. Diagram summarizing key environmental challenges common to Brazil, DRC, Madagascar, and Indonesia that affect conservation of their primate fauna.
The relative importance of some pressures and population aspects vary from country to country. For example, hunting in DRC is a large-scale pressure because the local human population has little or no access to domestic meat. Because of their large size and low population density relative to the size of the country, Brazil and DRC are in a better position to anticipate the direction of these pressures and prevent primate declines and extirpation. However, in contrast to Brazil, DRC is particularly poor, its human population is rapidly growing, and human development is very low, whereas civil unrest is predominant and corruption and weak governance are an ever-present condition. Madagascar differs from these two countries, and from Indonesia in having a very small percentage of its original forest left. A rapidly expanding human population and high levels of poverty and weak governance are predominant. Indonesia is a developing country with a large human population that has embarked on a policy of rapidly replacing its forests with commercial plantations and expanding industrial logging at the expense of biodiversity.

References

    1. Abernethy KA, Coad L, Taylor G, Lee ME, Maisels F. Extent and ecological consequences of hunting in Central African rainforests in the twenty-first century. Philosophical Transactions of the Royal Society B: Biological Sciences. 2013;368(1625):20120303. doi: 10.1098/rstb.2012.0303. - DOI - PMC - PubMed
    1. Abernethy KA, Maisels F, White LJT. Environmental issues in Central Africa. Annual Review of Environment and Resources. 2016;41(1):1–33. doi: 10.1146/annurev-environ-110615-085415. - DOI
    1. Abood SA, Lee JSH, Burivalova Z, Garcia-Ulloa J, Koh LP. Relative contributions of the logging, fiber, oil palm, and mining industries to forest loss in Indonesia. Conservation Letters. 2015;8(1):58–67. doi: 10.1111/conl.12103. - DOI
    1. Adams WA, Hutton J. People, parks and poverty: political ecology and biodiversity conservation. Conservation and Society. 2007;5:147–183.
    1. Agustin IK, Anggriawan A, Miliyanawati BK, Setiawan A. Distribution of Sumatran surili (Presbytis melalophos) in Kerinci and Jambi Province Indonesia. Project report. Primate Conservation Inc. 2016. http://www.primate.org/support.htm http://www.primate.org/support.htm

LinkOut - more resources