

The use of chloroplast genome sequences to solve phylogenetic incongruences in Polystachya Hook (Orchidaceae Juss)
- PMID: 29922511
- PMCID: PMC6005162
- DOI: 10.7717/peerj.4916
The use of chloroplast genome sequences to solve phylogenetic incongruences in Polystachya Hook (Orchidaceae Juss)
Abstract
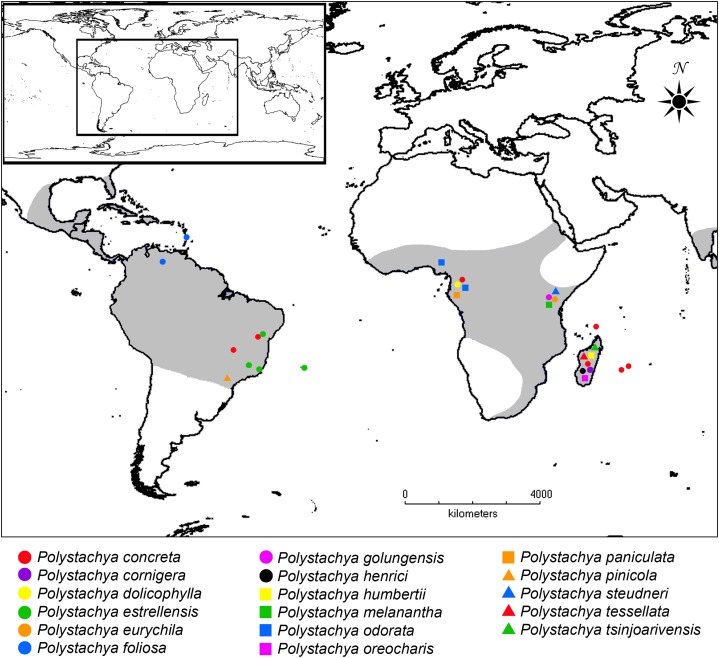
Background: Current evidence suggests that for more robust estimates of species tree and divergence times, several unlinked genes are required. However, most phylogenetic trees for non-model organisms are based on single sequences or just a few regions, using traditional sequencing methods. Techniques for massive parallel sequencing or next generation sequencing (NGS) are an alternative to traditional methods that allow access to hundreds of DNA regions. Here we use this approach to resolve the phylogenetic incongruence found in Polystachya Hook. (Orchidaceae), a genus that stands out due to several interesting aspects, including cytological (polyploid and diploid species), evolutionary (reticulate evolution) and biogeographical (species widely distributed in the tropics and high endemism in Brazil). The genus has a notoriously complicated taxonomy, with several sections that are widely used but probably not monophyletic.
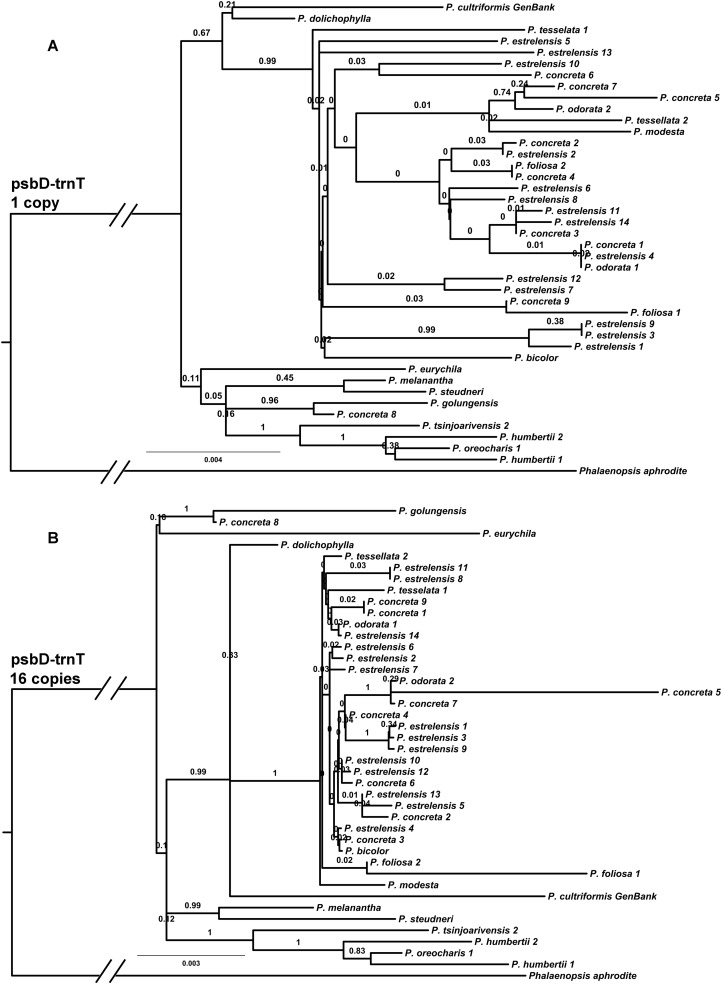
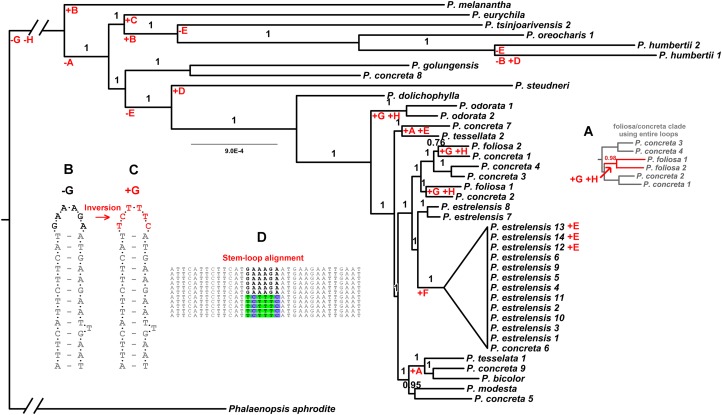
Methods: We generated the complete plastid genome of 40 individuals from one clade within the genus. The method consisted in construction of genomic libraries, hybridization to RNA probes designed from available sequences of a related species, and subsequent sequencing of the product. We also tested how well a smaller sample of the plastid genome would perform in phylogenetic inference in two ways: by duplicating a fast region and analyzing multiple copies of this dataset, and by sampling without replacement from all non-coding regions in our alignment. We further examined the phylogenetic implications of non-coding sequences that appear to have undergone hairpin inversions (reverse complemented sequences associated with small loops).
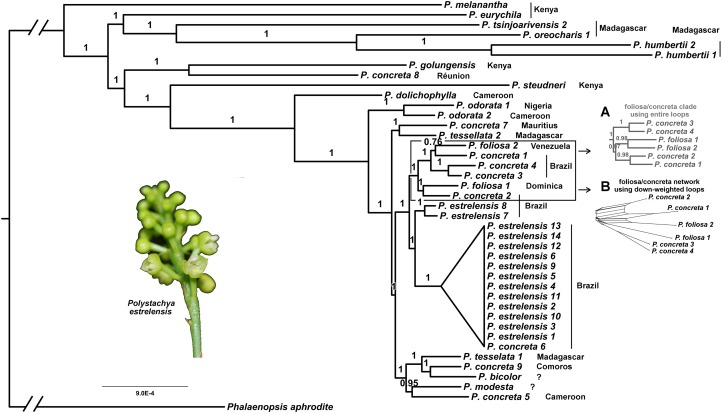
Results: We retrieved 131,214 bp, including coding and non-coding regions of the plastid genome. The phylogeny was able to fully resolve the relationships among all species in the targeted clade with high support values. The first divergent species are represented by African accessions and the most recent ones are among Neotropical species.
Discussion: Our results indicate that using the entire plastid genome is a better option than screening highly variable markers, especially when the expected tree is likely to contain many short branches. The phylogeny inferred is consistent with the proposed origin of the genus, showing a probable origin in Africa, with later dispersal into the Neotropics, as evidenced by a clade containing all Neotropical individuals. The multiple positions of Polystachya concreta (Jacq.) Garay & Sweet in the phylogeny are explained by allotetraploidy. Polystachya estrellensis Rchb.f. can be considered a genetically distinct species from P. concreta and P. foliosa (Lindl.) Rchb.f., but the delimitation of P. concreta remains uncertain. Our study shows that NGS provides a powerful tool for inferring relationships at low taxonomic levels, even in taxonomically challenging groups with short branches and intricate morphology.
Keywords: Chloroplast; Complete genome; Hybridization; Next generation sequencing; Orchids; Phylogenetics; Polystachya.
Conflict of interest statement
The authors declare that they have no competing interests.
Figures
References
-
- Barros F, Vinhos F, Rodrigues VT, Barberena FFVA, Fraga CN. 2010. Orchidaceae in Flora do Brasil. Jardim Botânico do Rio de Janeiro.
-
- Brenan JPM, editor. Plants collected by the Vernay Nyasaland expedition of 1946. Memoirs of the New York Botanical Garden. 1954;9:1–132.
LinkOut - more resources
Full Text Sources
Other Literature Sources
