

Differences in Obesity Prevalence by Demographics and Urbanization in US Children and Adolescents, 2013-2016
- PMID: 29922826
- PMCID: PMC6393914
- DOI: 10.1001/jama.2018.5158
Differences in Obesity Prevalence by Demographics and Urbanization in US Children and Adolescents, 2013-2016
Abstract
Importance: Differences in childhood obesity by demographics and urbanization have been reported.
Objective: To present data on obesity and severe obesity among US youth by demographics and urbanization and to investigate trends by urbanization.
Design, setting, and participants: Measured weight and height among youth aged 2 to 19 years in the 2001-2016 National Health and Nutrition Examination Surveys, which are serial, cross-sectional, nationally representative surveys of the civilian, noninstitutionalized population.
Exposures: Sex, age, race and Hispanic origin, education of household head, and urbanization, as assessed by metropolitan statistical areas (MSAs; large: ≥ 1 million population).
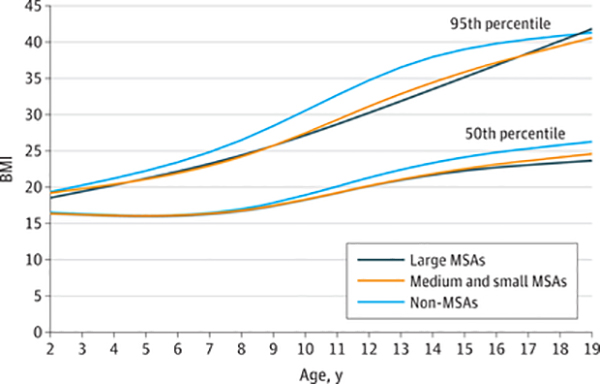
Main outcomes and measures: Prevalence of obesity (body mass index [BMI] ≥95th percentile of US Centers for Disease Control and Prevention [CDC] growth charts) and severe obesity (BMI ≥120% of 95th percentile) by subgroups in 2013-2016 and trends by urbanization between 2001-2004 and 2013-2016.
Results: Complete data on weight, height, and urbanization were available for 6863 children and adolescents (mean age, 11 years; female, 49%). In 2013-2016, the prevalence among youth aged 2 to 19 years was 17.8% (95% CI, 16.1%-19.6%) for obesity and 5.8% (95% CI, 4.8%-6.9%) for severe obesity. Prevalence of obesity in large MSAs (17.1% [95% CI, 14.9%-19.5%]), medium or small MSAs (17.2% [95% CI, 14.5%-20.2%]) and non-MSAs (21.7% [95% CI, 16.1%-28.1%]) were not significantly different from each other (range of pairwise comparisons P = .09-.96). Severe obesity was significantly higher in non-MSAs (9.4% [95% CI, 5.7%-14.4%]) compared with large MSAs (5.1% [95% CI, 4.1%-6.2%]; P = .02). In adjusted analyses, obesity and severe obesity significantly increased with greater age and lower education of household head, and severe obesity increased with lower level of urbanization. Compared with non-Hispanic white youth, obesity and severe obesity prevalence were significantly higher among non-Hispanic black and Hispanic youth. Severe obesity, but not obesity, was significantly lower among non-Hispanic Asian youth than among non-Hispanic white youth. There were no significant linear or quadratic trends in obesity or severe obesity prevalence from 2001-2004 to 2013-2016 for any urbanization category (P range = .07-.83).
Conclusions and relevance: In 2013-2016, there were differences in the prevalence of obesity and severe obesity by age, race and Hispanic origin, and household education, and severe obesity was inversely associated with urbanization. Demographics were not related to the urbanization findings.
Conflict of interest statement
Figures
References
-
- Hales CM, Carroll MD, Fryar CD, Ogden CL. Prevalence of obesity among adults and youth: United States, 2015–2016. NCHS Data Brief. 2017; (288):1–8. - PubMed
-
- US Department of Health and Human Services. Healthy People 2020: nutrition and weight status. https://www.healthypeople.gov/2020/topics-objectives/topic/nutrition-and....
MeSH terms
Grants and funding
LinkOut - more resources
Full Text Sources
Other Literature Sources
Medical
