

Differences in Obesity Prevalence by Demographic Characteristics and Urbanization Level Among Adults in the United States, 2013-2016
- PMID: 29922829
- PMCID: PMC6583043
- DOI: 10.1001/jama.2018.7270
Differences in Obesity Prevalence by Demographic Characteristics and Urbanization Level Among Adults in the United States, 2013-2016
Abstract
Importance: Differences in obesity by sex, age group, race and Hispanic origin among US adults have been reported, but differences by urbanization level have been less studied.
Objectives: To provide estimates of obesity by demographic characteristics and urbanization level and to examine trends in obesity prevalence by urbanization level.
Design, setting, and participants: Serial cross-sectional analysis of measured height and weight among adults aged 20 years or older in the 2001-2016 National Health and Nutrition Examination Survey, a nationally representative survey of the civilian, noninstitutionalized US population.
Exposures: Sex, age group, race and Hispanic origin, education level, smoking status, and urbanization level as assessed by metropolitan statistical areas (MSAs; large: ≥1 million population).
Main outcomes and measures: Prevalence of obesity (body mass index [BMI] ≥30) and severe obesity (BMI ≥40) by subgroups in 2013-2016 and trends by urbanization level between 2001-2004 and 2013-2016.
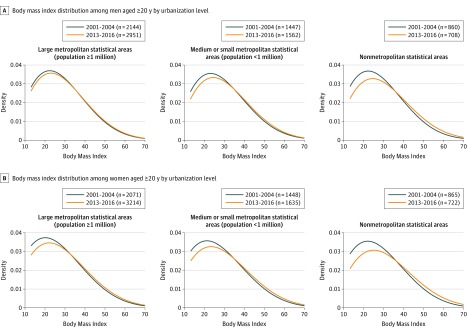
Results: Complete data on weight, height, and urbanization level were available for 10 792 adults (mean age, 48 years; 51% female [weighted]). During 2013-2016, 38.9% (95% CI, 37.0% to 40.7%) of US adults had obesity and 7.6% (95% CI, 6.8% to 8.6%) had severe obesity. Men living in medium or small MSAs had a higher age-adjusted prevalence of obesity compared with men living in large MSAs (42.4% vs 31.8%, respectively; adjusted difference, 9.8 percentage points [95% CI, 5.1 to 14.5 percentage points]); however, the age-adjusted prevalence among men living in non-MSAs was not significantly different compared with men living in large MSAs (38.9% vs 31.8%, respectively; adjusted difference, 4.8 percentage points [95% CI, -2.9 to 12.6 percentage points]). The age-adjusted prevalence of obesity was higher among women living in medium or small MSAs compared with women living in large MSAs (42.5% vs 38.1%, respectively; adjusted difference, 4.3 percentage points [95% CI, 0.2 to 8.5 percentage points]) and among women living in non-MSAs compared with women living in large MSAs (47.2% vs 38.1%, respectively; adjusted difference, 4.7 percentage points [95% CI, 0.2 to 9.3 percentage points]). Similar patterns were seen for severe obesity except that the difference between men living in large MSAs compared with non-MSAs was significant. The age-adjusted prevalence of obesity and severe obesity also varied significantly by age group, race and Hispanic origin, and education level, and these patterns of variation were often different by sex. Between 2001-2004 and 2013-2016, the age-adjusted prevalence of obesity and severe obesity significantly increased among all adults at all urbanization levels.
Conclusions and relevance: In this nationally representative survey of adults in the United States, the age-adjusted prevalence of obesity and severe obesity in 2013-2016 varied by level of urbanization, with significantly greater prevalence of obesity and severe obesity among adults living in nonmetropolitan statistical areas compared with adults living in large metropolitan statistical areas.
Conflict of interest statement
Figures
References
-
- Ogden CL, Carroll MD, Fryar CD, Flegal KM. Prevalence of obesity among adults and youth: United States, 2011-2014. NCHS Data Brief. 2015;(219):1-8. - PubMed
Publication types
MeSH terms
LinkOut - more resources
Full Text Sources
Other Literature Sources
Medical
