. 2018 Aug;45(1):1-28.
doi: 10.1007/s10827-018-0688-6. Epub 2018 Jun 19.

Dynamics of spontaneous activity in random networks with multiple neuron subtypes and synaptic noise : Spontaneous activity in networks with synaptic noise

Affiliations

Dynamics of spontaneous activity in random networks with multiple neuron subtypes and synaptic noise : Spontaneous activity in networks with synaptic noise

Rodrigo F O Pena et al. J Comput Neurosci. 2018 Aug.

Abstract

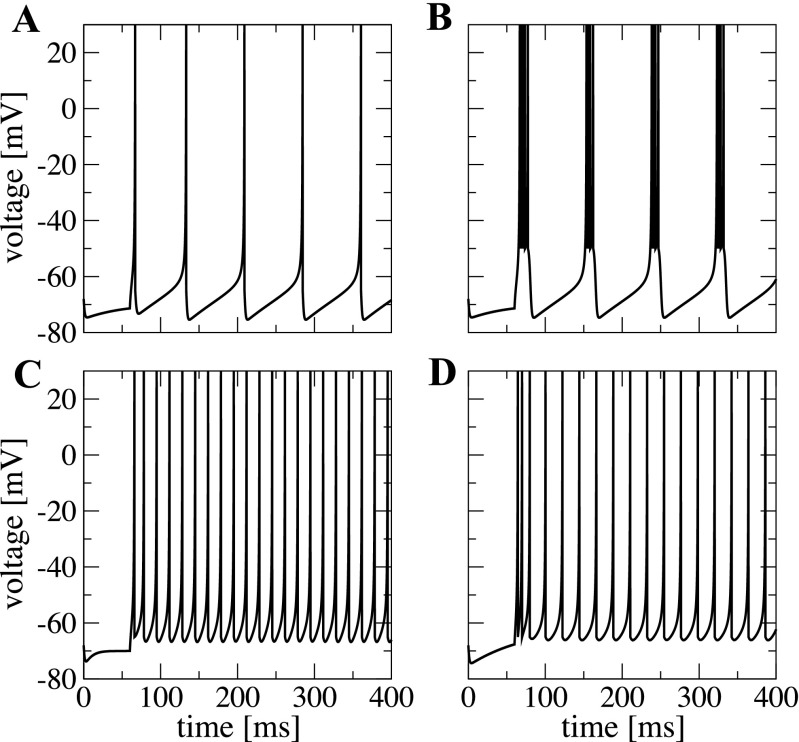
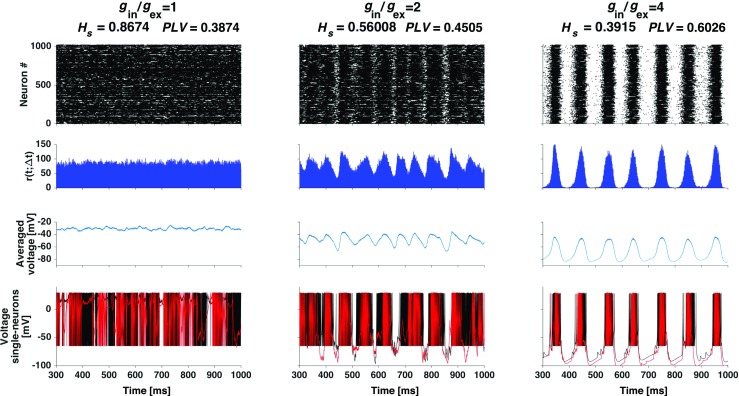
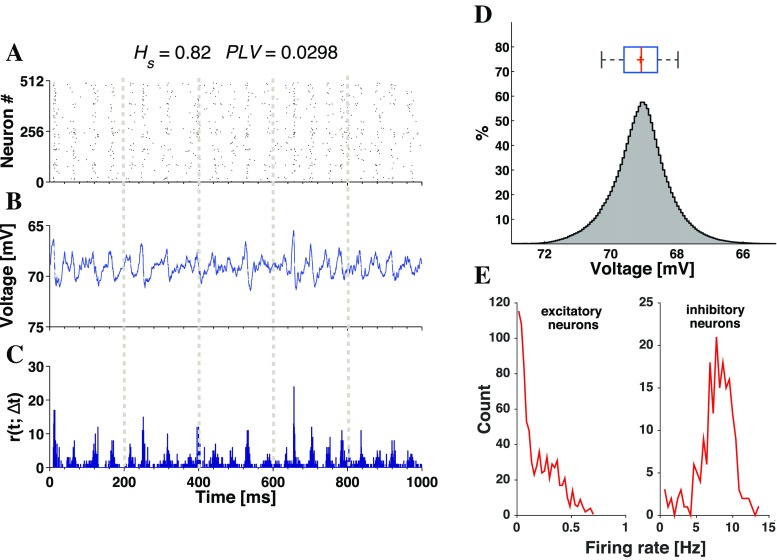
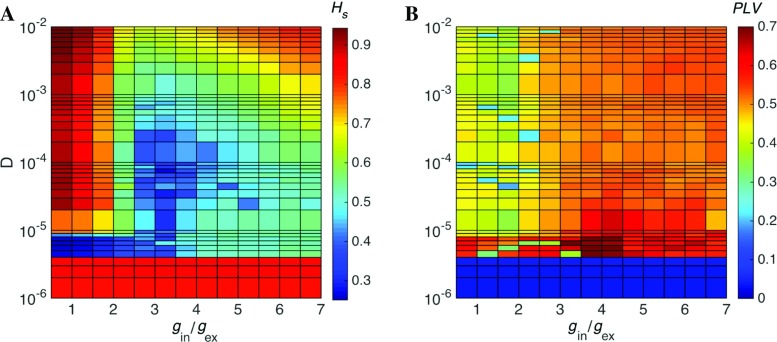
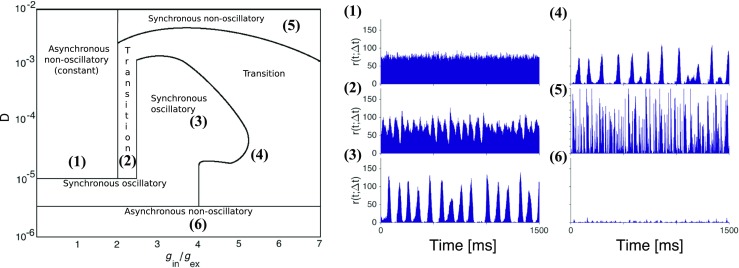
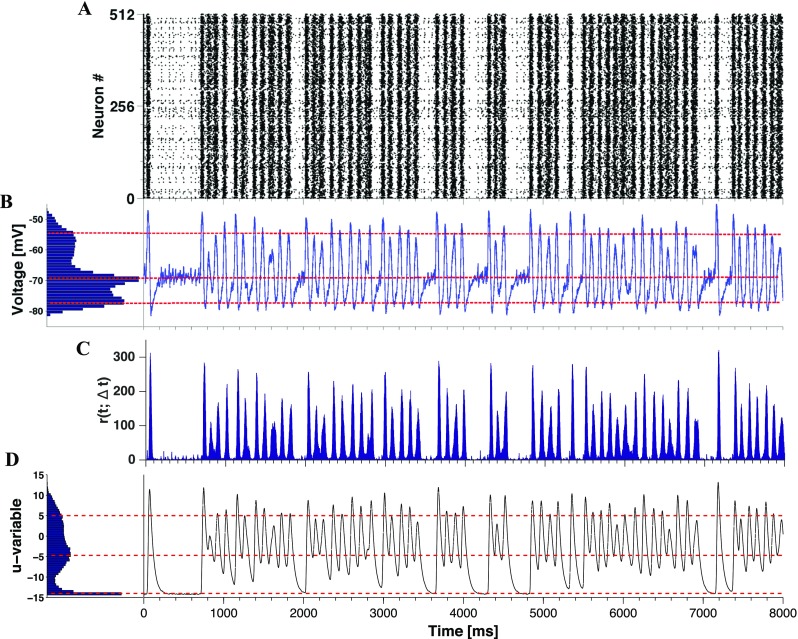
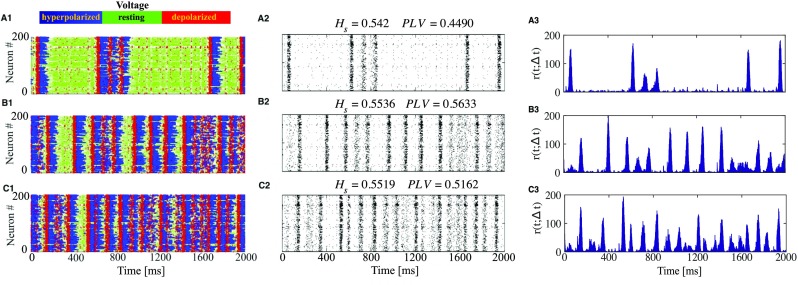
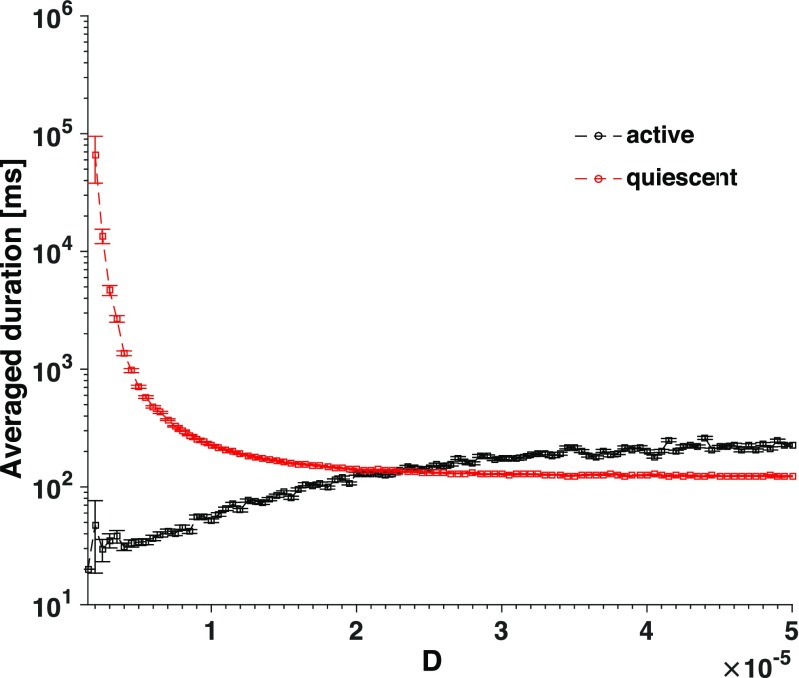
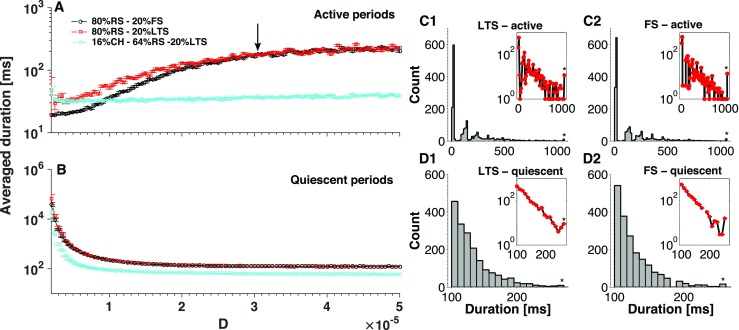
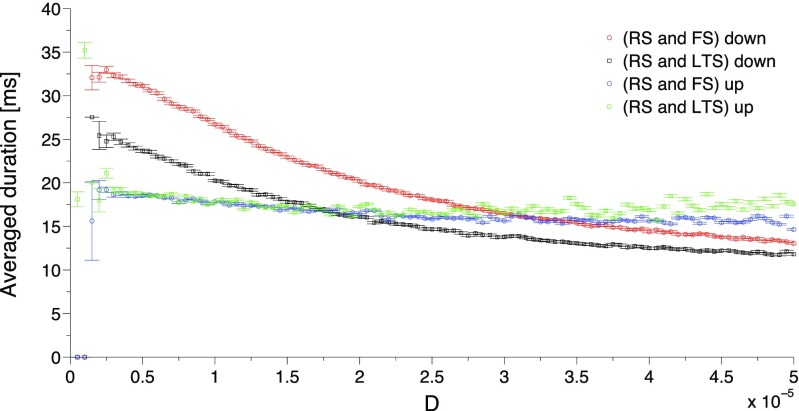
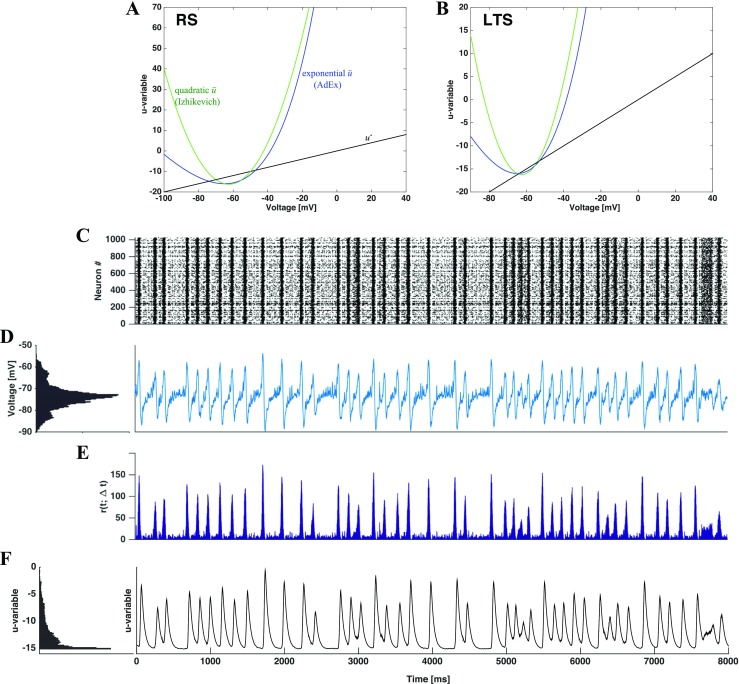
Spontaneous cortical population activity exhibits a multitude of oscillatory patterns, which often display synchrony during slow-wave sleep or under certain anesthetics and stay asynchronous during quiet wakefulness. The mechanisms behind these cortical states and transitions among them are not completely understood. Here we study spontaneous population activity patterns in random networks of spiking neurons of mixed types modeled by Izhikevich equations. Neurons are coupled by conductance-based synapses subject to synaptic noise. We localize the population activity patterns on the parameter diagram spanned by the relative inhibitory synaptic strength and the magnitude of synaptic noise. In absence of noise, networks display transient activity patterns, either oscillatory or at constant level. The effect of noise is to turn transient patterns into persistent ones: for weak noise, all activity patterns are asynchronous non-oscillatory independently of synaptic strengths; for stronger noise, patterns have oscillatory and synchrony characteristics that depend on the relative inhibitory synaptic strength. In the region of parameter space where inhibitory synaptic strength exceeds the excitatory synaptic strength and for moderate noise magnitudes networks feature intermittent switches between oscillatory and quiescent states with characteristics similar to those of synchronous and asynchronous cortical states, respectively. We explain these oscillatory and quiescent patterns by combining a phenomenological global description of the network state with local descriptions of individual neurons in their partial phase spaces. Our results point to a bridge from events at the molecular scale of synapses to the cellular scale of individual neurons to the collective scale of neuronal populations.

Keywords: Cortical oscillations; Izhikevich neuron model; Spontaneous neural activity; Synaptic noise; Synchronous and asynchronous activities; Up-down states.


Conflict of interest statement

The authors declare that they have no conflict of interest.

Figures

Fig. 1
Fig. 1
Spiking patterns for electrophysiological cell classes modeled by the Izhikevich formalism. A excitatory neuron RS. B excitatory neuron CH. C inhibitory neuron FS. D inhibitory neuron LTS. Plots where produced with constant I = 6
Fig. 2
Fig. 2
Self-sustained firing pattern changes under variation ofgin/gex ratio in the deterministic setup. The network is composed of RS and LTS neurons. Each column represents a combination of gin/gex indicated atop together with the corresponding spectral entropy Hs and synchrony index PLV. From top to bottom: raster plot, network firing rate, average voltage and voltage traces of two arbitrarily selected neurons (in black and red respectively)
Fig. 3
Fig. 3
Up and down network oscillations in the noiseless case whengin >gex. The network is composed of 16% CH, 64%RS and 20%LTS neurons, with (gex, gin) = (0.15,1). Panels A-C show the raster plot for half of the neurons in the network, average voltage and time-dependent firing rate from a sample simulation with long-lived self-sustained activity. Panels D-E show the voltage v and membrane recovery variable u extracted from a sample neuron in this simulation. Histograms F-G show the distributions of average v and average u based on data from all long-lived simulations. In the box plots above the histograms the red lines and the pluses denote, respectively, the median and the mean. Histogram H presents the distribution of stay duration in the collective up and down states based on all simulations, as well as mean and standard deviation; the outlier is indicated by the star in the end of the distribution.
Fig. 4
Fig. 4
Average time of first spike for the Izhikevich neuron model driven by synaptic noise. D: noise intensity. Blue curve: RS neuron. Red curve: LTS neuron
Fig. 5
Fig. 5
Asynchronous irregular state in the presence of weak synaptic noise. The network, composed of 16% CH, 64%RS and 20%LTS neurons, evolves without initial stimulation. Synaptic increments: (gex, gin) = (0.15,1). Intensity of synaptic noise: D = 2.5 × 10− 6. Panels A-C present, respectively, raster plot for half of the neurons in the network, average voltage and time-dependent firing rate for the network. Above them the values of Hs and PLV are cited. Panels D-E are histograms with distributions of average voltage and firing rates. For the firing rates, excitatory and inhibitory populations are presented separately, as indicated in the titles of E
Fig. 6
Fig. 6
Spectral entropyHs and synchrony indexPLV for the synaptic noise setup. Two-dimensional space where ordinate represents the synaptic noise intensity D and abscissa, the ratio of synaptic increments gin/gex. The coordinate mesh is linear (from 0.5 to 7) with respect to gin/gex and logarithmic with respect to the synaptic noise intensity (from D = 1 × 10− 6 to D = 1 × 10− 2). Panel A: Colors represent spectral entropy Hs (values close to zero correspond to oscillatory states and values close to 1 correspond to non-oscillatory states). Panel B: Colors represent synchrony evaluated by means of the phase locking value PLV (values close to zero correspond to asynchronous states whereas values close to 1 correspond to synchronous state)
Fig. 7
Fig. 7
Network activity patterns in the synaptic noise setup. A schematic representation of the D vs. gin/gex diagram of Fig. 6 combining the information on degree of oscillatory activity (Hs) and degree of synchrony (PLV ) disclosed in that figure. The names of the activity types are given inside the regions bounded by full lines. The synchronous non-oscillatory type is equivalent to the constant type used to describe network states in the deterministic setup. The region marked as “transition” corresponds to states with intermediate levels of oscillatory activity and synchrony. On the right side of the diagram we present the time-dependent firing rate r(tt) of the network for six selected (D, gin/gex) combinations. Numbers on the left-hand top of the panels indicate the corresponding points in the diagram to the left
Fig. 8
Fig. 8
Intermittent transitions between active oscillatory and quiescent regimes in the presence of synaptic noise. Plots generated for a network with 16% CH, 64%RS and 20%LTS neurons, D = 1 × 10− 5 and (gin, gex) = (1,0.15). Panel A: Raster plot for half of the neurons in the network. Panel B: voltage v histogram (left) and time course of average voltage over all network neurons (right). Panel C: time-dependent firing rate of the network. Panel D: Recovery variable u, histogram (left) and time course of average recovery value over all network neurons
Fig. 9
Fig. 9
Increase of synaptic noise favors up-down oscillations. The network has the same composition as in Fig. 8 with varying synaptic noise intensity D. A: D = 0.5 × 10− 5, B: D = 1.5 × 10− 5, C: D = 4.5 × 10− 5. In A1, B1, and C1 blue dots correspond to depolarization (up state), red dots to hyperpolarization (down state), and green dots to voltage near the resting state. A2, B2, and C2: raster plots for 200 neurons in the network with corresponding Hs and PLV values atop each plot. A3, B3, and C3: time-dependent firing rates
Fig. 10
Fig. 10
Averaged power spectra at different noise intensities. Simulation length: 10 s. Left column: network with inhibitory LTS neurons. Right column: network with inhibitory FS neurons. Every panel (A, B, C, D) contains three subpanels displaying three levels of noise intensity from top to bottom: D = 0.5 × 10− 5, D = 1.5 × 10− 5, and D = 4.5 × 10− 5. Black curves in A and C: averaged spectra of spike trains for 200 randomly chosen neurons. Black curves in B and D: averaged spectra of voltage for the same 200 neurons. Green curves: moving average over 20 points. Peak values are indicated in the plot and were evaluated from the green curves neglecting the zeroth frequency bin. In the bottom panels we display the factor n for the 1/fn decay extracted between 10 and 200 Hz
Fig. 11
Fig. 11
Single neuron phase plane depiction of a neuron that fires during theactive periods in the synaptic noise setup. Upper panel: a zoom of the simulation from Fig. 8, split into 6 time intervals Δti. The first 3 intervals have a duration of 50 ms and the last 3 have a duration of 100 ms. Lower panels: voltage series and dynamics on the phase plane of neuron # 240 in subsequent intervals Δti. Arrows indicate the vectors (v˙,u˙); since v is much faster than u, the vectors are nearly horizontal. Blue dashed line: the first half of evolution in a given Δti. Blue solid line: the last half of evolution in a given Δti. Red circle: location of the neuron at the end of the time interval. Black square: location of the state of rest with v = vrest and u = urest. Dotted red lines: reset value of voltage and spike cutoff. Green lines: Nullclines ū and u, according to Eq. (11). The location of the parabolic nullcline ū is time-dependent; its position at the beginning (respectively, end) of Δti is shown with dashed (respectively, solid) green line
Fig. 12
Fig. 12
Single neuron phase plane depiction of a neuron that fires duringall periods in the synaptic noise setup. Each panel contains voltage series and dynamics on the phase plane of neuron # 69 for the same time range (3800–4400 ms) and the same six time intervals of 100 ms as for the neuron in Fig. 11. Arrows in the plot indicate (v˙,u˙). Blue dashed line: the first 50 ms of evolution. Blue solid line: the last 50 ms of evolution. Red circle: location of the neuron at the end of the time interval. Black square: location of the state of rest with v = vrest and u = urest. Dotted red lines: reset value of voltage and spike cutoff. Green lines: Nullclines ū and u, according to Eq. (11). The location of the parabolic nullcline ū is time-dependent; its position at the beginning (respectively, end) of Δti is shown with dashed (respectively, solid) green line
Fig. 13
Fig. 13
Distribution of the neuron variables and synaptic current at different moments of time. Data in each panel come from 200 neurons pooled together from the same network simulation in Fig. 8. For different time instants, indicated atop every coupled subpanel, the figure presents scatter plots (left subpanel) of instantaneous (v, u) values, indicated as a blue circles, and histograms (right subpanel) of instantaneous Isyn values
Fig. 14
Fig. 14
Synaptic noise intensity affects the mean duration of active and quiescent periods. Curves show average durations of active and quiescent periods over the simulation of 10 min as a function of synaptic noise intensity. All inhibitory neurons are of LTS type. Synaptic noise intensity varies in the range 0.05 × 10− 5D ≤ 5 × 10− 5 in discrete steps of size ΔD = 0.05 × 10− 5. Error bars: standard error
Fig. 15
Fig. 15
Network composition influences the average duration of stay in active and quiescent periods. A-B: Dependence of duration on noise intensity. Legend in the plot indicates the network composition. Curves: average values over the simulation of 10 min. Error bars: standard error. A: active periods. B: quiescent periods. The value D = 3 × 10− 5, denoted by the arrow, is used for calculation of histograms in panels C1-2 and D1-2, characterizing distributions of stay duration in different periods. Stars at the end of the histograms are outliers. Insets show logarithmic representations of the ordinate
Fig. 16
Fig. 16
Average duration of stay in the up and down states as a function of noise intensity. The network contains RS excitatory neurons and either FS or LTS inhibitory neurons. Curves: average values over the simulation of 10 min. Error bars: standard error
Fig. 17
Fig. 17
Intermittent transitions between active and quiescent regimes in the presence of synaptic noise for network with AdEx neurons. The network is composed of two AdEx neuron types: the excitatory (RS) and the inhibitory (LTS), in the same proportion 4:1 as in the other networks of this work. Panels A and B: nullclines on the phase plane, drawn for the Izhikevich and the AdEx models for RS (A) and FS (B) neurons (see parameters in the text). Panel C: raster plot for a network simulation under synaptic noise with D = 1 × 10− 5. Panel D: averaged voltage histogram (left) and time course of averaged voltage over all network neurons (right). Panel E: r(tt) extracted from all neurons in the network. Panel F: Recovery variable u. Histogram (left) and course of u(t) over all network neurons

References

    1. Ahn S, Rubchinsky LL. Short desynchronization episodes prevail in synchronous dynamics of human brain rhythms. Chaos. 2013;23:013138. doi: 10.1063/1.4794793. - DOI - PMC - PubMed
    1. Ahn S, Rubchinsky LL. Potential mechanisms and functions of intermittent neural synchronization. Frontiers in Computational Neuroscience. 2017;11:44. doi: 10.3389/fncom.2017.00044. - DOI - PMC - PubMed
    1. Amit DJ, Brunel N. Model of global spontaneous activity and local structured activity during delay periods in the cerebral cortex. Cerebral Cortex. 1997;7:237–252. doi: 10.1093/cercor/7.3.237. - DOI - PubMed
    1. Aydore S, Pantazis D, Leahy RM. A note on the phase locking value and its properties. NeuroImage. 2013;74:231–244. doi: 10.1016/j.neuroimage.2013.02.008. - DOI - PMC - PubMed
    1. Bair W, Koch C, Newsome W, Britten K. Power spectrum analysis of MT neurons in the behaving monkey. Journal of Neuroscience. 1994;14:2870–2892. doi: 10.1523/JNEUROSCI.14-05-02870.1994. - DOI - PMC - PubMed

Publication types

LinkOut - more resources