. 2018 Oct;39(10):4007-4017.
doi: 10.1002/hbm.24227. Epub 2018 Jun 19.

Thalamic white matter in multiple sclerosis: A combined diffusion-tensor imaging and quantitative susceptibility mapping study

Affiliations

Thalamic white matter in multiple sclerosis: A combined diffusion-tensor imaging and quantitative susceptibility mapping study

Niels Bergsland et al. Hum Brain Mapp. 2018 Oct.

Abstract

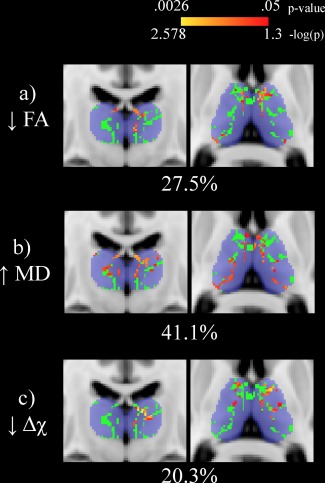
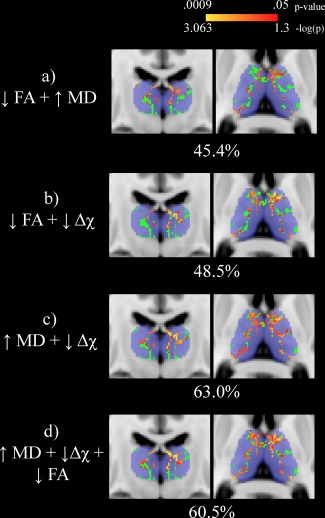
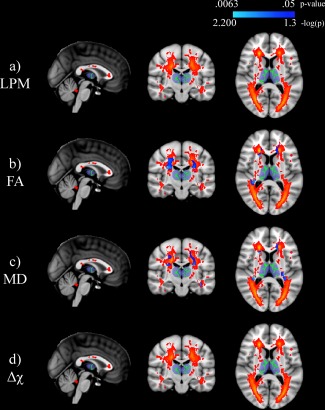
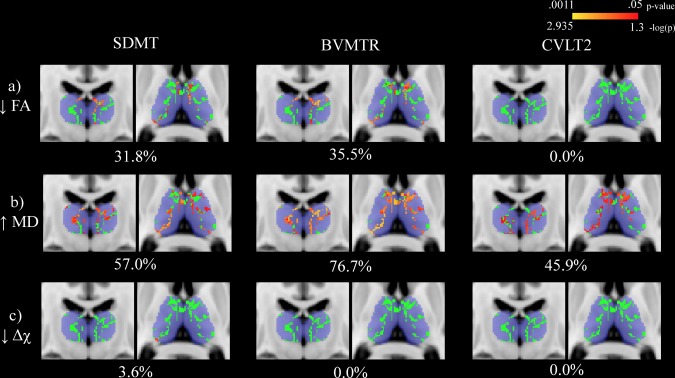
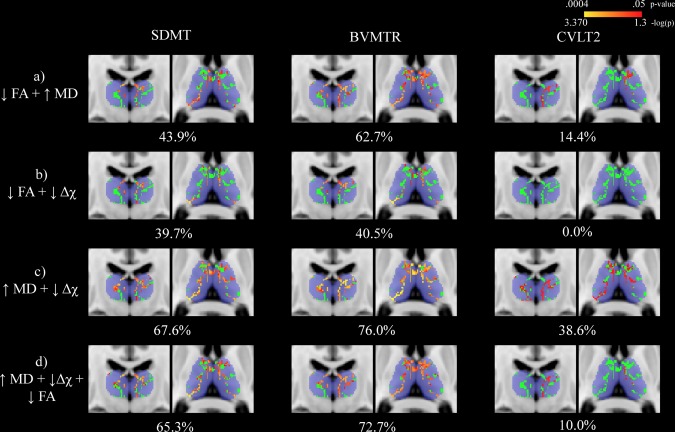
Thalamic white matter (WM) injury in multiple sclerosis (MS) remains relatively poorly understood. Combining multiple imaging modalities, sensitive to different tissue properties, may aid in further characterizing thalamic damage. Forty-five MS patients and 17 demographically-matched healthy controls (HC) were scanned with 3T MRI to obtain quantitative measures of diffusivity and magnetic susceptibility. Participants underwent cognitive evaluation with the Brief International Cognitive Assessment for Multiple Sclerosis battery. Tract-based spatial statistics identified thalamic WM. Non-parametric combination (NPC) analysis was used to perform joint inference on fractional anisotropy (FA), mean diffusivity (MD) and magnetic susceptibility measures. The association of surrounding WM lesions and thalamic WM pathology was investigated with lesion probability mapping. Compared to HCs, the greatest extent of thalamic WM damage was reflected by the combination of increased MD and decreased magnetic susceptibility (63.0% of thalamic WM, peak p = .001). Controlling for thalamic volume resulted in decreased FA and magnetic susceptibility (34.1%, peak p = .004) as showing the greatest extent. In MS patients, the most widespread association with information processing speed was found with the combination of MD and magnetic susceptibility (67.6%, peak p = .0005), although this was not evident after controlling for thalamic volume. For memory measures, MD alone yielded the most widespread associations (45.9%, peak p = .012 or 76.7%, peak p = .001), even after considering thalamic volume, albeit with smaller percentages. White matter lesions were related to decreased FA (peak p = .0063) and increased MD (peak p = .007), but not magnetic susceptibility, of thalamic WM. Our study highlights the complex nature of thalamic pathology in MS.

Keywords: MRI; diffusion tensor imaging; multiple sclerosis; quantitative susceptibility mapping; thalamus.


Figures

Figure 1
Figure 1
Univariate voxel‐wise analysis of the thalamic white matter skeleton (shown in green) comparing healthy controls (HCs) and multiple sclerosis (MS) patients. Significant differences (p < .05) are shown in red‐yellow with p values having been log transformed for improved visibility. Warmer colors are indicative of smaller p values. Decreased fractional anisotropy, increased mean diffusivity, and decreased susceptibility are seen in MS patients compared to HCs. Percentages refer to the proportion of significantly different voxels between MS patients and HCs in the thalamic skeleton. The Harvard‐Oxford thalamic ROI is shown for reference in transparent blue. The slice shown corresponds to standard space MNI coordinates of Y = −17, Z = 8. Abbreviations: FA: fractional anisotropy; MD = mean diffusivity; Δχ = magnetic susceptibility; HC = healthy control; MS = multiple sclerosis [Color figure can be viewed at http://wileyonlinelibrary.com]
Figure 2
Figure 2
Nonparametric combination voxel‐wise analysis of the thalamic white matter skeleton (shown in green) between healthy controls (HCs) and multiple sclerosis (MS) patients. Significant differences (p < .05) are shown in red‐yellow with p‐values having been log transformed for improved visibility. Warmer colors are indicative of smaller p values. Percentages refer to the proportion of significantly different voxels between MS patients and HCs in the thalamic skeleton. In each combination, decreased fractional anisotropy, increased mean diffusivity, and decreased magnetic susceptibility are seen in MS patients compared to HCs. The Harvard‐Oxford thalamic ROI is shown for reference in transparent blue. The slices shown corresponds to standard space MNI coordinates of Y = −17, Z = 8. Abbreviations: FA = fractional anisotropy; MD = mean diffusivity; Δχ = magnetic susceptibility; HC = healthy control; MS = multiple sclerosis [Color figure can be viewed at http://wileyonlinelibrary.com]
Figure 3
Figure 3
Lesion probability mapping (LPM) of multiple sclerosis (MS) patients relating white matter (WM) lesion location to mean thalamic WM skeleton (shown in green) parameters. The top panel shows the LPM image with warmer colors corresponding to increased probability of a lesional voxel in the MS cohort. Significant associations (p < .05) are shown in blue to light blue with p‐values having been log transformed for improved visibility. The Harvard‐Oxford thalamic ROI is shown for reference in transparent blue. Note that there are no significant associations with lesion location and mean susceptibility of the thalamic WM skeleton. The slice shown corresponds to standard space MNI coordinates of X = 0, Y = −17, Z = 8. Abbreviations:FA = fractional anisotropy; MD = mean diffusivity; Δχ = magnetic susceptibility; LPM = lesion probability mapping; WM = white matter; MS = multiple sclerosis [Color figure can be viewed at http://wileyonlinelibrary.com]
Figure 4
Figure 4
Univariate voxel‐wise analysis assessing the relationship between cognitive assessment performance and thalamic white matter (WM) metrics in multiple sclerosis (MS) patients. The thalamic WM skeleton is shown in green overlaid on top of the Harvard‐Oxford thalamic ROI in blue. Significant associations (p < .05) are shown in red‐yellow with p values having been log transformed for improved visibility. Warmer colors are indicative of smaller p values. Decreased fractional anisotropy, increased mean diffusivity, and decreased susceptibility were related to decreased performance. Percentages refer to the proportion of significantly associated voxels with performance. The slices shown corresponds to standard space MNI coordinates of Y = −17, Z = 8. Abbreviations: SDMT = Symbol Digit Modalities Test; BVMTR = Brief Visual Memory Test ? Revised; CVLT2 = California Verbal Learning Test ‐ 2nd edition; FA = fractional anisotropy; MD = mean diffusivity; Δχ = magnetic susceptibility [Color figure can be viewed at http://wileyonlinelibrary.com]
Figure 5
Figure 5
Nonparametric combination voxel‐wise analysis assessing the relationship between cognitive assessment performance and thalamic white matter (WM) metrics in multiple sclerosis (MS) patients. The thalamic WM skeleton is shown in green overlaid onto of the Harvard‐Oxford thalamic ROI in blue. Significant differences (p < .05) are shown in red‐yellow with p‐values having been log transformed for improved visibility. Warmer colors are indicative of smaller p‐values. Percentages refer to the proportion of voxels significantly associated with performance. The slices shown corresponds to standard space MNI coordinates of Y = −17, Z = 8. Abbreviations: SDMT = Symbol Digit Modalities Test; BVMTR = Brief Visual Memory Test ? Revised; CVLT2 = California Verbal Learning Test ‐ 2nd edition; FA = fractional anisotropy; MD = mean diffusivity; Δχ = magnetic susceptibility; HC = healthy control [Color figure can be viewed at http://wileyonlinelibrary.com]

References

    1. Abdul‐Rahman, H. S. , Gdeisat, M. A. , Burton, D. R. , Lalor, M. J. , Lilley, F. , & Moore, C. J. (2007). Fast and robust three‐dimensional best path phase unwrapping algorithm. Applied Optics, 46(26), 6623–6635. - PubMed
    1. Andersson, J. L. , Skare, S. , & Ashburner, J. (2003). How to correct susceptibility distortions in spin‐echo echo‐planar images: Application to diffusion tensor imaging. NeuroImage, 20(2), 870–888. - PubMed
    1. Andersson, J. L. R. , & Sotiropoulos, S. N. (2016). An integrated approach to correction for off‐resonance effects and subject movement in diffusion MR imaging. NeuroImage, 125, 1063–1078. - PMC - PubMed
    1. Bagnato, F. , Hametner, S. , Yao, B. , van Gelderen, P. , Merkle, H. , Cantor, F. K. , … Duyn, J. H. (2011). Tracking iron in multiple sclerosis: A combined imaging and histopathological study at 7 Tesla. Brain, 134(12), 3602–3615. - PMC - PubMed
    1. Benedict, R. H. B. (1997). Brief Visuospatial Memory Test ‐ Revised: Professional Manual. Odessa, Florida: Psychological Assessment Resources, Inc.

Publication types

MeSH terms