

Effects of sodium-glucose cotransporter 2 inhibitors in addition to insulin therapy on cardiovascular risk factors in type 2 diabetes patients: A meta-analysis of randomized controlled trials
- PMID: 29923322
- PMCID: PMC6400156
- DOI: 10.1111/jdi.12876
Effects of sodium-glucose cotransporter 2 inhibitors in addition to insulin therapy on cardiovascular risk factors in type 2 diabetes patients: A meta-analysis of randomized controlled trials
Abstract
Aims/introduction: In the present meta-analysis, we aimed to determine the effects of sodium-glucose cotransporter 2 inhibitor (SGLT-2i) in addition to insulin therapy on cardiovascular risk factors in type 2 diabetes patients.
Materials and methods: Randomized controlled trials were identified by searching the PubMed, Embase and Cochrane Library databases published before September 2017. The intervention group received SGLT-2i as add-on treatment to insulin therapy, and the control group received placebos in addition to insulin. We assessed pooled data, including weighted mean differences and 95% confidence intervals (CIs) using a random-effects model.
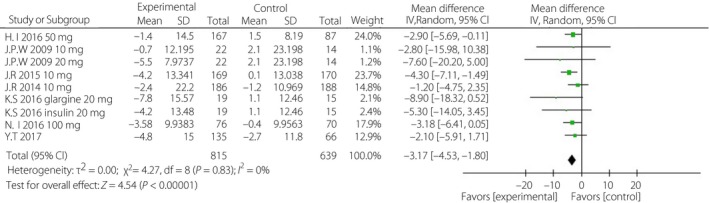
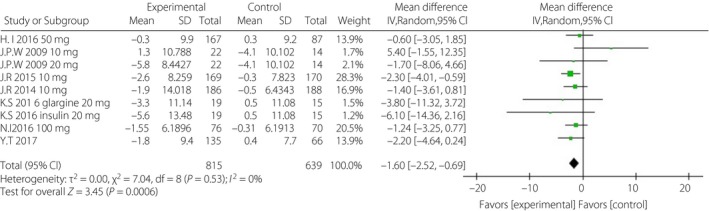
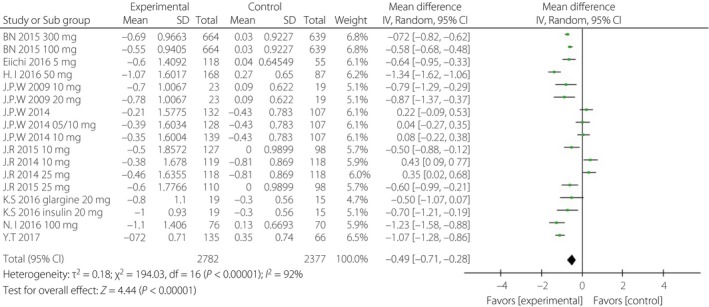
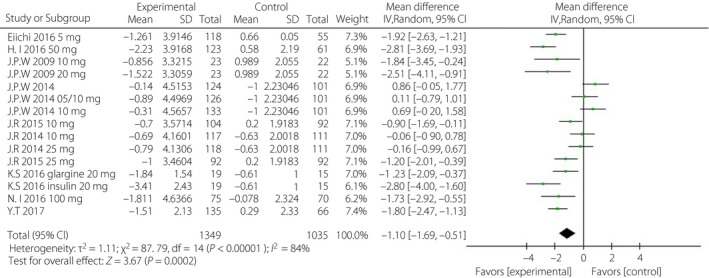
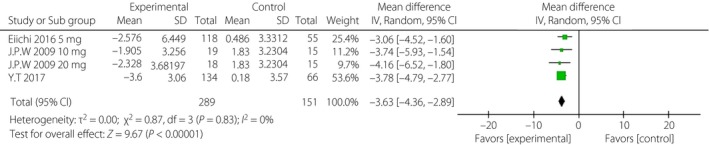
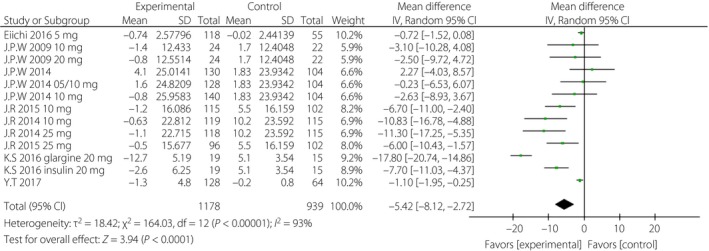
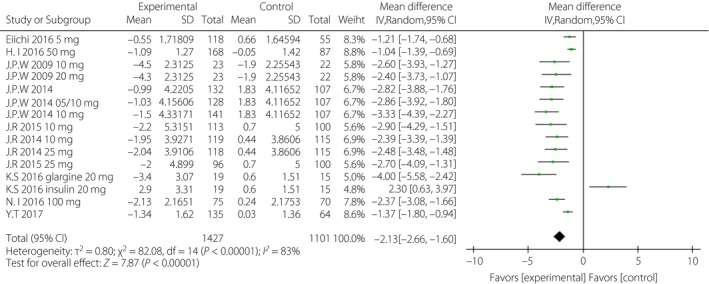
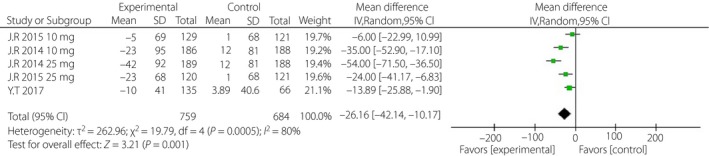
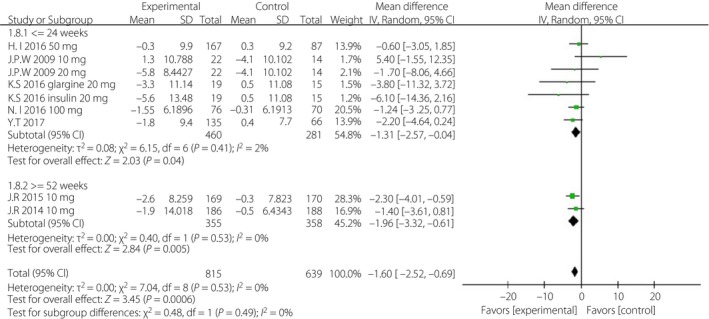
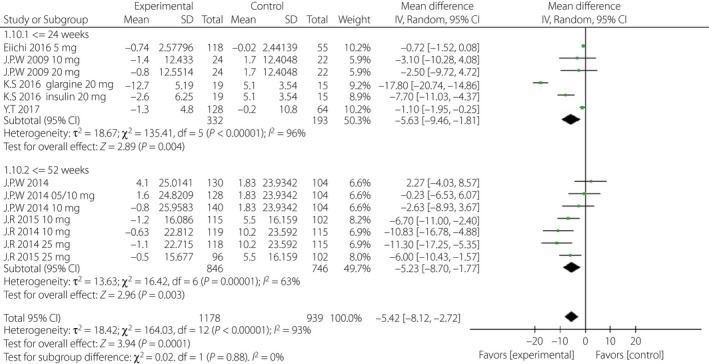
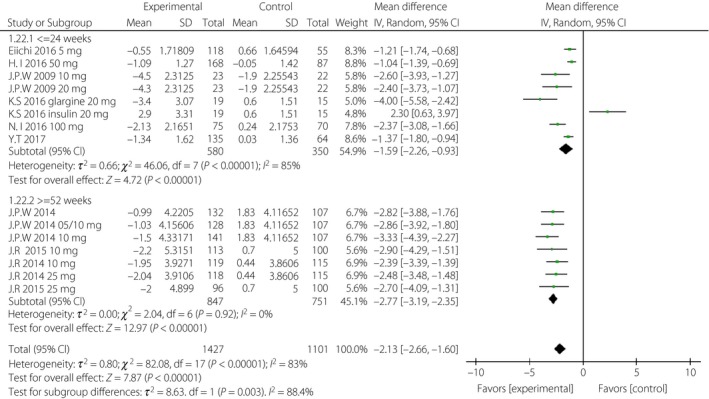
Results: A total of 10 randomized controlled trials (n = 5,159) were eligible. The weighted mean differences for systolic blood pressure and diastolic blood pressure were -3.17 mmHg (95% CI -4.53, -1.80, I2 = 0%) and -1.60 mmHg (95% CI -2.52, -0.69, I2 = 0%) in the intervention groups. Glycosylated hemoglobin, fasting plasma glucose, postprandial glucose and daily insulin were also lower in the intervention groups, with relative weighted mean differences of -0.49% (95% CI -0.71, -0.28%, I2 = 92%), -1.10 mmol/L (95% CI -1.69, -0.51 mmol/L, I2 = 84%), -3.63 mmol/L (95% CI -4.36, -2.89, I2 = 0%) and -5.42 IU/day (95% CI -8.12, -2.72, I2 = 93%). The transformations of uric acid and bodyweight were -26.16 μmol/L (95% CI -42.14, -10.17, I2 = 80%) and -2.13 kg (95% CI -2.66, -1.60, I2 = 83%). The relative risk of hypoglycemia was 1.09 (95% CI 1.02, 1.17, P < 0.01). The relative risks of urinary tract and genital infection were 1.29 (95% CI 1.03, 1.62, P = 0.03) and 5.25 (95% CI 3.55, 7.74, P < 0.01).
Conclusions: The results showed that in the intervention group, greater reductions were achieved for blood pressure, glucose control, uric acid and bodyweight. This treatment regimen might therefore provide beneficial effects on the occurrence and development of cardiovascular events.
Keywords: Cardiovascular risk factors; Meta-analysis; Sodium-glucose cotransporter 2 inhibitor.
© 2018 The Authors. Journal of Diabetes Investigation published by Asian Association for the Study of Diabetes (AASD) and John Wiley & Sons Australia, Ltd.
Figures
References
-
- Madaan T, Akhtar M, Najmi AK, et al Sodium glucose Co‐Transporter 2 (SGLT2) inhibitors: current status and future perspective. Eur J Pharm Sci 2016; 93: 244–252. - PubMed
-
- Wright EM, Loo DD, Hirayama BA, et al Biology of human sodium glucose transporters. Physiol Rev 2011; 91: 733–794. - PubMed
-
- Wu JH, Foote C, Blomster J, et al Effects of sodium‐glucose cotransporter‐2 inhibitors on cardiovascular events, death and major safety outcomes in adults with type 2 diabetes: a systematic review and meta‐analysis. Lancet Diabetes Endocrinol 2016; 4: 411–419. - PubMed
-
- Basile JN. The potential of sodium glucose cotransporter 2 (SGLT2) inhibitors to reduce cardiovascular risk in patients with type 2 diabetes (T2DM). J Diabetes Complications 2013; 27: 280–286. - PubMed
Publication types
MeSH terms
Substances
Grants and funding
LinkOut - more resources
Full Text Sources
Other Literature Sources
Medical
