

Multisample adjusted U-statistics that account for confounding covariates
- PMID: 29923344
- PMCID: PMC6322553
- DOI: 10.1002/sim.7825
Multisample adjusted U-statistics that account for confounding covariates
Abstract
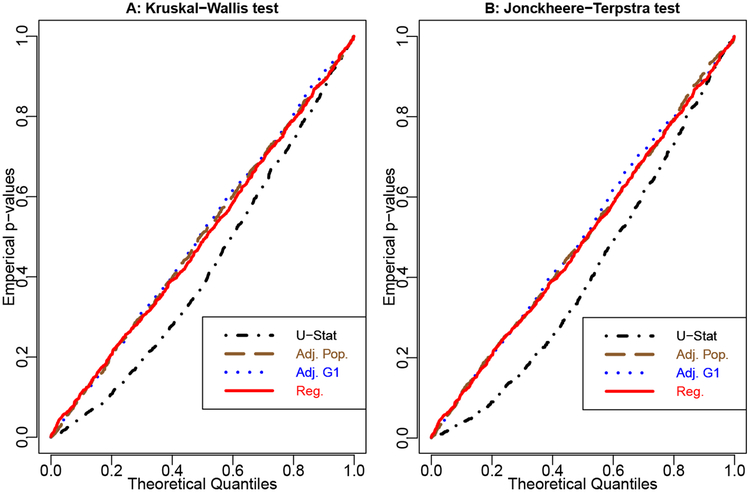
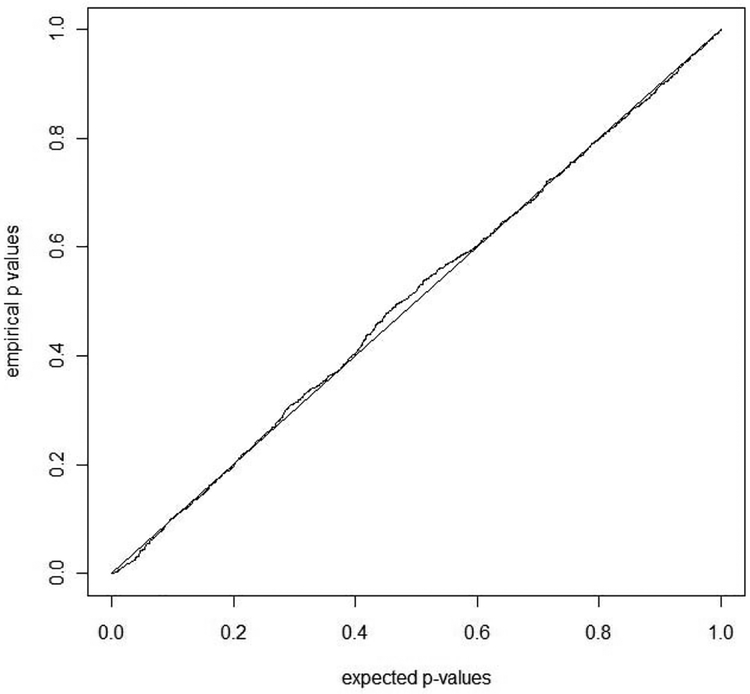
Multisample U-statistics encompass a wide class of test statistics that allow the comparison of 2 or more distributions. U-statistics are especially powerful because they can be applied to both numeric and nonnumeric data, eg, ordinal and categorical data where a pairwise similarity or distance-like measure between categories is available. However, when comparing the distribution of a variable across 2 or more groups, observed differences may be due to confounding covariates. For example, in a case-control study, the distribution of exposure in cases may differ from that in controls entirely because of variables that are related to both exposure and case status and are distributed differently among case and control participants. We propose to use individually reweighted data (ie, using the stratification score for retrospective data or the propensity score for prospective data) to construct adjusted U-statistics that can test the equality of distributions across 2 (or more) groups in the presence of confounding covariates. Asymptotic normality of our adjusted U-statistics is established and a closed form expression of their asymptotic variance is presented. The utility of our approach is demonstrated through simulation studies, as well as in an analysis of data from a case-control study conducted among African-Americans, comparing whether the similarity in haplotypes (ie, sets of adjacent genetic loci inherited from the same parent) occurring in a case and a control participant differs from the similarity in haplotypes occurring in 2 control participants.
Keywords: adjusted U-statistics; multiple group comparison; propensity score.
Copyright © 2018 John Wiley & Sons, Ltd.
Figures

Similar articles
-
Control for confounding in case-control studies using the stratification score, a retrospective balancing score.Am J Epidemiol. 2011 Apr 1;173(7):752-60. doi: 10.1093/aje/kwq406. Epub 2011 Mar 14. Am J Epidemiol. 2011. PMID: 21402731 Free PMC article.
-
Folic acid supplementation and malaria susceptibility and severity among people taking antifolate antimalarial drugs in endemic areas.Cochrane Database Syst Rev. 2022 Feb 1;2(2022):CD014217. doi: 10.1002/14651858.CD014217. Cochrane Database Syst Rev. 2022. PMID: 36321557 Free PMC article.
-
Nonlinear tests for genomewide association studies.Genetics. 2006 Nov;174(3):1529-38. doi: 10.1534/genetics.106.060491. Epub 2006 Jul 2. Genetics. 2006. PMID: 16816420 Free PMC article.
-
A comparison of different methods to handle missing data in the context of propensity score analysis.Eur J Epidemiol. 2019 Jan;34(1):23-36. doi: 10.1007/s10654-018-0447-z. Epub 2018 Oct 19. Eur J Epidemiol. 2019. PMID: 30341708 Free PMC article.
-
Haplotype sharing analysis using mantel statistics.Hum Hered. 2005;59(2):67-78. doi: 10.1159/000085221. Epub 2005 Apr 18. Hum Hered. 2005. PMID: 15838176
Cited by
-
Chronic Pain Severity and Sociodemographics: An Evaluation of the Neurobiological Interface.J Pain. 2022 Feb;23(2):248-262. doi: 10.1016/j.jpain.2021.07.010. Epub 2021 Aug 21. J Pain. 2022. PMID: 34425249 Free PMC article.
-
Statistical methods for assessing treatment effects on ordinal outcomes using observational data.Commun Stat Simul Comput. 2025 Apr 14:10.1080/03610918.2025.2488945. doi: 10.1080/03610918.2025.2488945. Online ahead of print. Commun Stat Simul Comput. 2025. PMID: 40857455
-
Testing hypotheses about the microbiome using the linear decomposition model (LDM).Bioinformatics. 2020 Aug 15;36(14):4106-4115. doi: 10.1093/bioinformatics/btaa260. Bioinformatics. 2020. PMID: 32315393 Free PMC article.
-
The dynamics in food selection stemming from price awareness and perceived income adequacy: a cross-sectional study using 1-year loyalty card data.Am J Clin Nutr. 2024 May;119(5):1346-1353. doi: 10.1016/j.ajcnut.2024.03.003. Epub 2024 Mar 7. Am J Clin Nutr. 2024. PMID: 38458401 Free PMC article.
-
ULV: A robust statistical method for clustered data, with applications to multi-subject, single-cell omics data.ArXiv [Preprint]. 2024 Jun 10:arXiv:2406.06767v1. ArXiv. 2024. PMID: 38947924 Free PMC article. Preprint.
References
-
- Mann HB & Whitney DR (1947). On a test of whether one of two random variables is stochastically larger than the other. Annals of Mathematical Statistics 18, 50–60.
-
- Hoeffding W (1948). A class of statistics with asymptotically normal distribution. Ann. Math. Statist 19, 293–325.
-
- Chen HS, Zhu X, Zhao H & Zhang S (2003). Qualitative semi-parametric test for genetic associations in case-control designs under structured populations. Ann Hum Genet 67, 250–264. - PubMed
-
- Price AL, Patterson NJ, Plenge RM, Weinblatt ME, Shadick NA, & Reich D(2006). Principal components analysis corrects for stratification in genome-wide association studies. Nat Genet 38, 904–909. - PubMed
Publication types
MeSH terms
Substances
Grants and funding
LinkOut - more resources
Full Text Sources
Other Literature Sources
Miscellaneous