

Exenatide ameliorates hepatic steatosis and attenuates fat mass and FTO gene expression through PI3K signaling pathway in nonalcoholic fatty liver disease
- PMID: 29924135
- PMCID: PMC6010322
- DOI: 10.1590/1414-431x20187299
Exenatide ameliorates hepatic steatosis and attenuates fat mass and FTO gene expression through PI3K signaling pathway in nonalcoholic fatty liver disease
Abstract
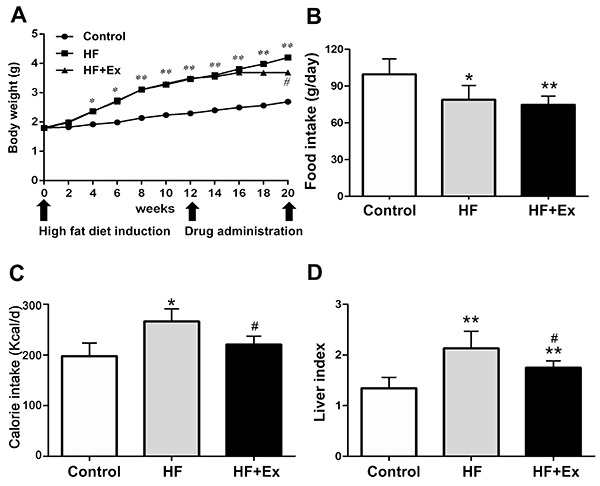
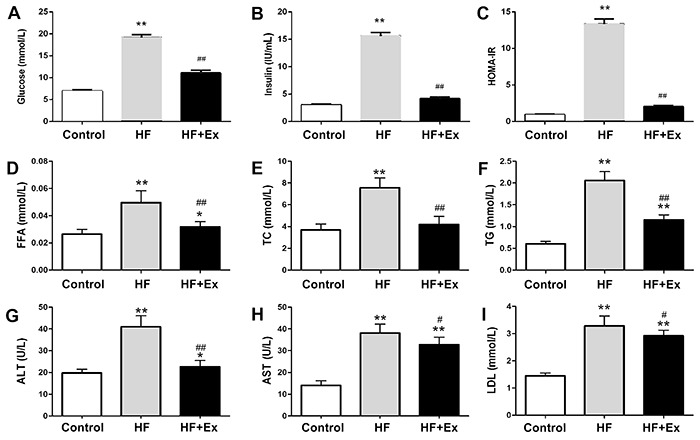
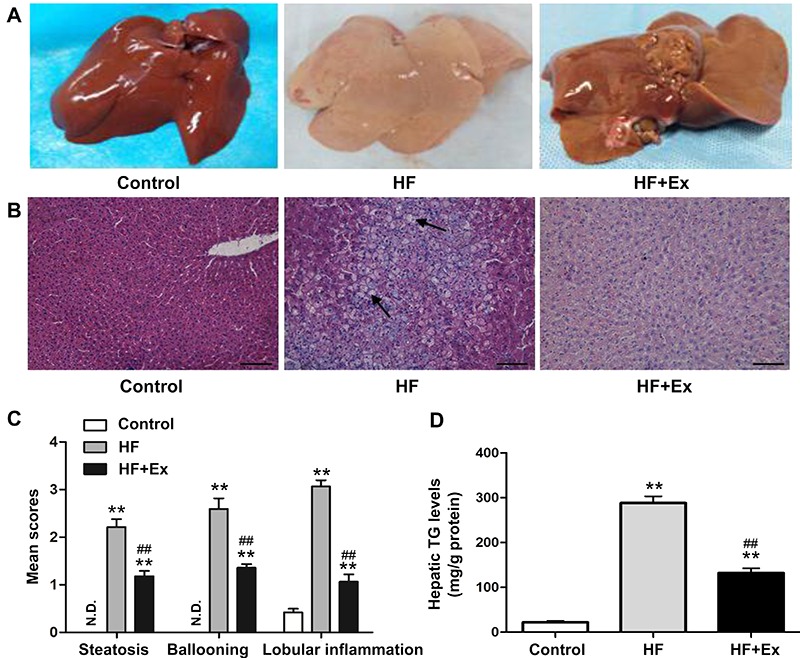
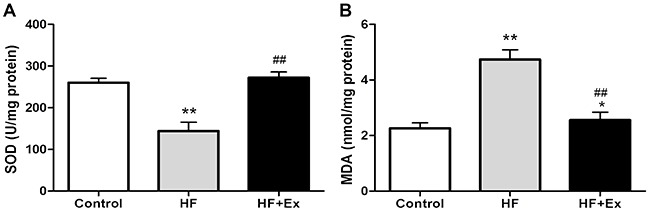
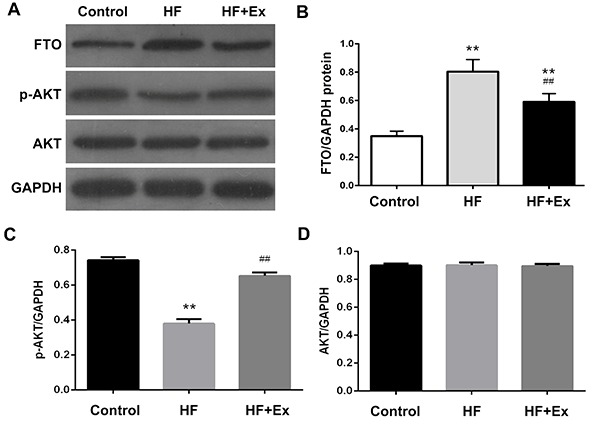
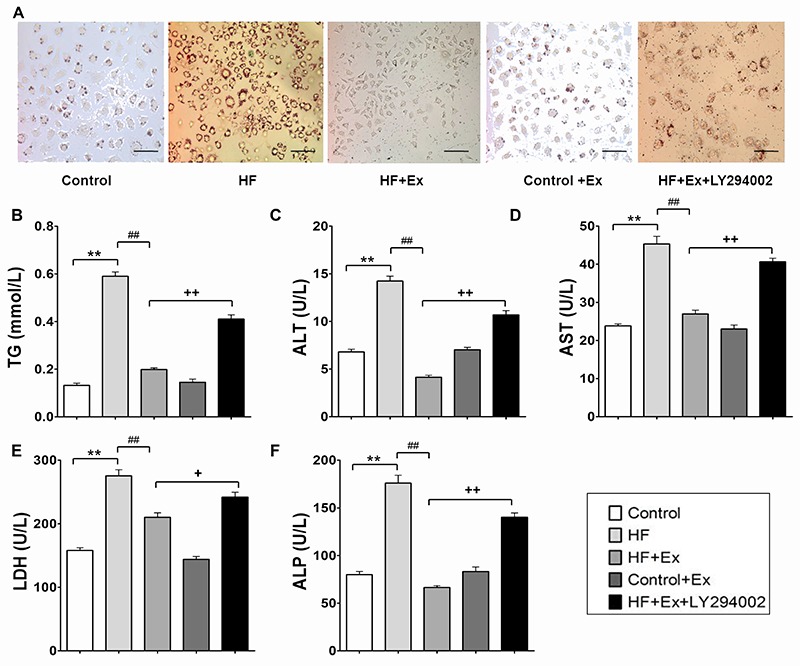
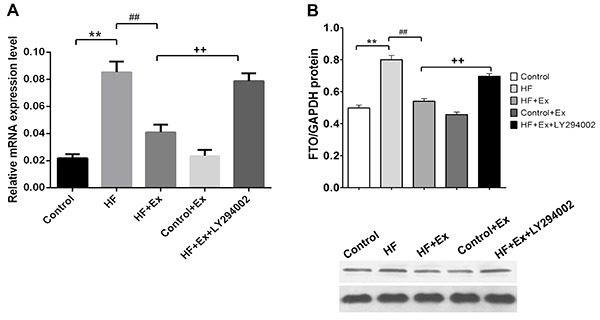
Non-alcoholic fatty liver disease (NAFLD) is a common disease associated with metabolic syndrome and can lead to life-threatening complications like hepatic carcinoma and cirrhosis. Exenatide, a glucagon-like peptide-1 (GLP-1) receptor agonist antidiabetic drug, has the capacity to overcome insulin resistance and attenuate hepatic steatosis but the specific underlying mechanism is unclear. This study was designed to investigate the underlying molecular mechanisms of exenatide therapy on NAFLD. We used in vivo and in vitro techniques to investigate the protective effects of exenatide on fatty liver via fat mass and obesity associated gene (FTO) in a high-fat (HF) diet-induced NAFLD animal model and related cell culture model. Exenatide significantly decreased body weight, serum glucose, insulin, insulin resistance, serum free fatty acid, triglyceride, total cholesterol, low-density lipoprotein, aspartate aminotransferase, and alanine aminotransferase levels in HF-induced obese rabbits. Histological analysis showed that exenatide significantly reversed HF-induced lipid accumulation and inflammatory changes accompanied by decreased FTO mRNA and protein expression, which were abrogated by PI3K inhibitor LY294002. This study indicated that pharmacological interventions with GLP-1 may represent a promising therapeutic strategy for NAFLD.
Figures
Similar articles
-
The Glucagon-Like Peptide-1 Analogue Liraglutide Inhibits Oxidative Stress and Inflammatory Response in the Liver of Rats with Diet-Induced Non-alcoholic Fatty Liver Disease.Biol Pharm Bull. 2015;38(5):694-702. doi: 10.1248/bpb.b14-00505. Biol Pharm Bull. 2015. PMID: 25947915
-
Glucagon-like peptide-1 receptor activation stimulates hepatic lipid oxidation and restores hepatic signalling alteration induced by a high-fat diet in nonalcoholic steatohepatitis.Liver Int. 2011 Oct;31(9):1285-97. doi: 10.1111/j.1478-3231.2011.02462.x. Epub 2011 Feb 15. Liver Int. 2011. PMID: 21745271
-
Expression and significance of fat mass and obesity associated gene and forkhead transcription factor O1 in non-alcoholic fatty liver disease.Chin Med J (Engl). 2014;127(21):3771-6. Chin Med J (Engl). 2014. PMID: 25382334
-
Non-Alcoholic Fatty Liver Disease.Adv Exp Med Biol. 2017;960:443-467. doi: 10.1007/978-3-319-48382-5_19. Adv Exp Med Biol. 2017. PMID: 28585211 Review.
-
Fat Mass and Obesity Associated (FTO) Gene and Hepatic Glucose and Lipid Metabolism.Nutrients. 2018 Nov 1;10(11):1600. doi: 10.3390/nu10111600. Nutrients. 2018. PMID: 30388740 Free PMC article. Review.
Cited by
-
FTO-mediated m 6A demethylation of ULK1 mRNA promotes autophagy and activation of hepatic stellate cells in liver fibrosis.Acta Biochim Biophys Sin (Shanghai). 2024 Aug 22;56(10):1509-1520. doi: 10.3724/abbs.2024098. Acta Biochim Biophys Sin (Shanghai). 2024. PMID: 39175431 Free PMC article.
-
Mechanisms of RNA N6-Methyladenosine in Hepatocellular Carcinoma: From the Perspectives of Etiology.Front Oncol. 2020 Jul 7;10:1105. doi: 10.3389/fonc.2020.01105. eCollection 2020. Front Oncol. 2020. PMID: 32733807 Free PMC article. Review.
-
RNA modifications in cellular metabolism: implications for metabolism-targeted therapy and immunotherapy.Signal Transduct Target Ther. 2024 Mar 27;9(1):70. doi: 10.1038/s41392-024-01777-5. Signal Transduct Target Ther. 2024. PMID: 38531882 Free PMC article. Review.
-
The Role of GLP1-RAs in Direct Modulation of Lipid Metabolism in Hepatic Tissue as Determined Using In Vitro Models of NAFLD.Curr Issues Mol Biol. 2023 May 24;45(6):4544-4556. doi: 10.3390/cimb45060288. Curr Issues Mol Biol. 2023. PMID: 37367037 Free PMC article. Review.
-
Roles of N6-methyladenosine epitranscriptome in non-alcoholic fatty liver disease and hepatocellular carcinoma.Smart Med. 2023 Jun 2;2(3):e20230008. doi: 10.1002/SMMD.20230008. eCollection 2023 Aug. Smart Med. 2023. PMID: 39188344 Free PMC article. Review.
References
-
- Chalasani N, Younossi Z, Lavine JE, Diehl AM, Brunt EM, Cusi K, et al. The diagnosis and management of non-alcoholic fatty liver disease: practice guideline by the American Gastroenterological Association, American Association for the Study of Liver Diseases, and American College of Gastroenterology. Gastroenterology. 2012;142:1592–1609. doi: 10.1053/j.gastro.2012.04.001. - DOI - PubMed
MeSH terms
Substances
LinkOut - more resources
Full Text Sources
Other Literature Sources
Medical
Research Materials
Miscellaneous
