

A Frailty Index for UK Biobank Participants
- PMID: 29924297
- PMCID: PMC6417451
- DOI: 10.1093/gerona/gly094
A Frailty Index for UK Biobank Participants
Abstract
Background: Frailty indices (FIs) measure variation in health between aging individuals. Researching FIs in resources with large-scale genetic and phenotypic data will provide insights into the causes and consequences of frailty. Thus, we aimed to develop an FI using UK Biobank data, a cohort study of 500,000 middle-aged and older adults.
Methods: An FI was calculated using 49 self-reported questionnaire items on traits covering health, presence of diseases and disabilities, and mental well-being, according to standard protocol. We used multiple imputation to derive FI values for the entire eligible sample in the presence of missing item data (N = 500,336). To validate the measure, we assessed associations of the FI with age, sex, and risk of all-cause mortality (follow-up ≤ 9.7 years) using linear and Cox proportional hazards regression models.
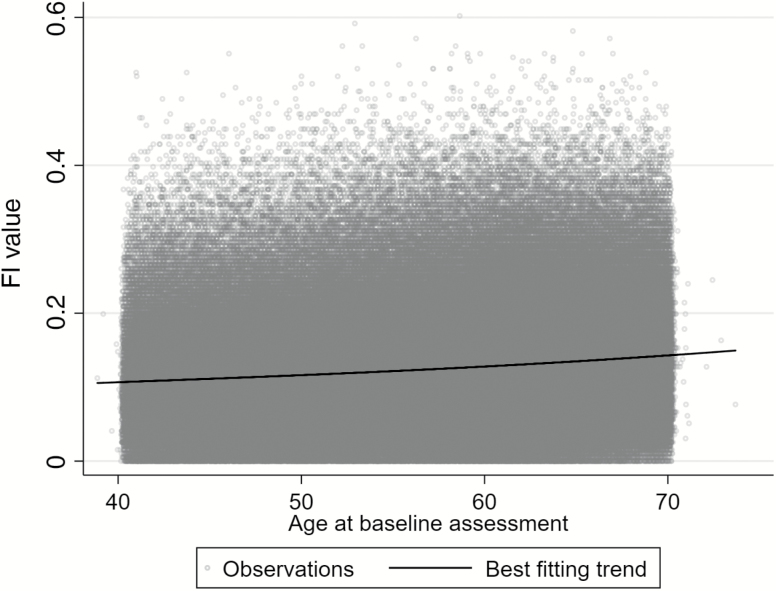
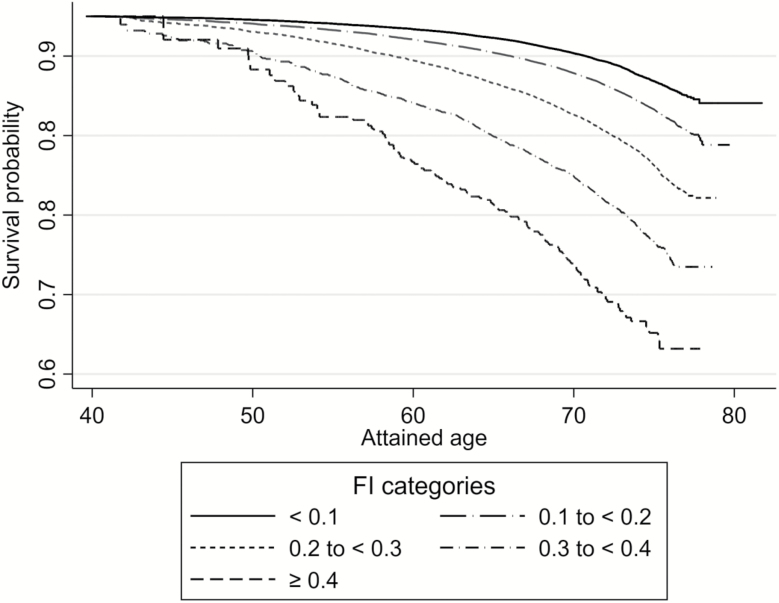
Results: Mean FI in the cohort was 0.125 (SD = 0.075), and there was a curvilinear trend toward higher values in older participants. FI values were also marginally higher on average in women than in men. In survival models, 10% higher baseline frailty (ie, a 0.1 FI increment) was associated with higher risk of death (hazard ratio = 1.65; 95% confidence interval: 1.62-1.68). Associations were stronger in younger participants than in older participants, and in men than in women (hazard ratios: 1.72 vs. 1.56, respectively).
Conclusions: The FI is a valid measure of frailty in UK Biobank. The cohort's data are open access for researchers to use, and we provide script for deriving this tool to facilitate future studies on frailty.
Keywords: Biological aging; Frailty; Longevity; Mortality.
© The Author(s) 2018. Published by Oxford University Press on behalf of The Gerontological Society of America.
Figures
References
-
- Rockwood K, Andrew M, Mitnitski A. A comparison of two approaches to measuring frailty in elderly people. J Gerontol A Biol Sci Med Sci. 2007;62:738–743. doi:10.1093/gerona/62.7.738 - PubMed
Publication types
MeSH terms
Grants and funding
LinkOut - more resources
Full Text Sources
Other Literature Sources
