. 2018 Jun;79(1):e51.
doi: 10.1002/cpcb.51. Epub 2018 May 18.

Transcription Factor-Mediated Differentiation of Human iPSCs into Neurons

Affiliations

Transcription Factor-Mediated Differentiation of Human iPSCs into Neurons

Michael S Fernandopulle et al. Curr Protoc Cell Biol. 2018 Jun.

Abstract

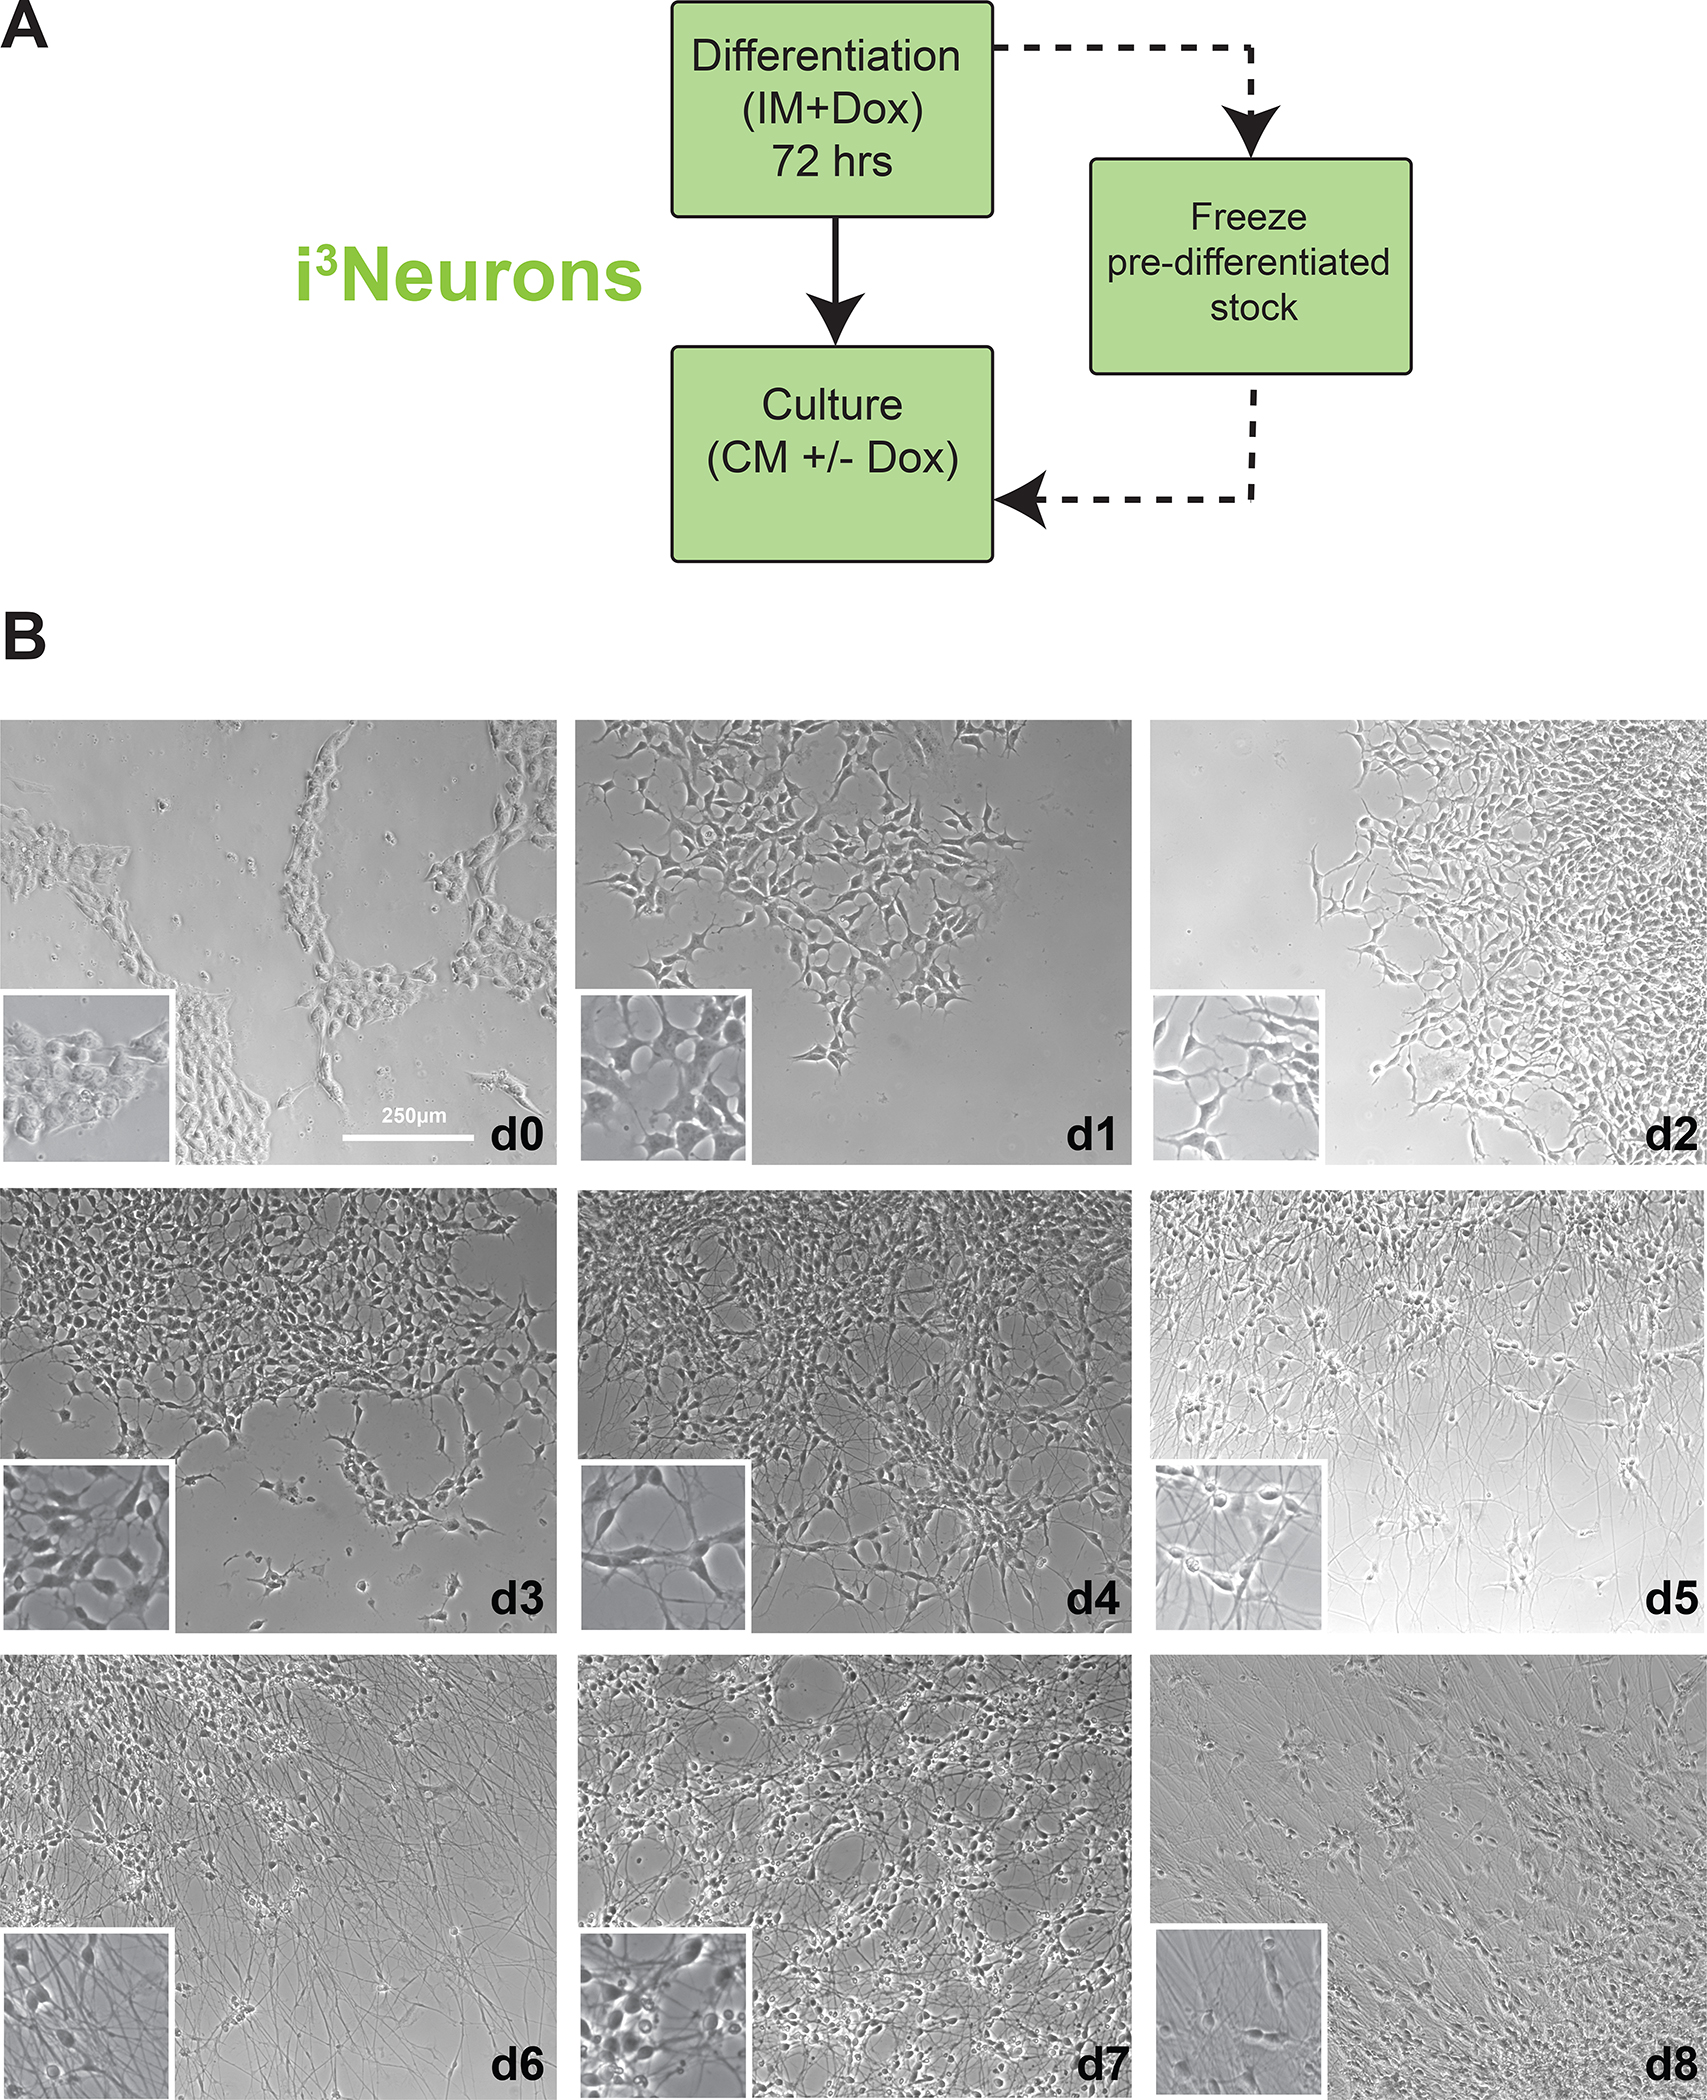
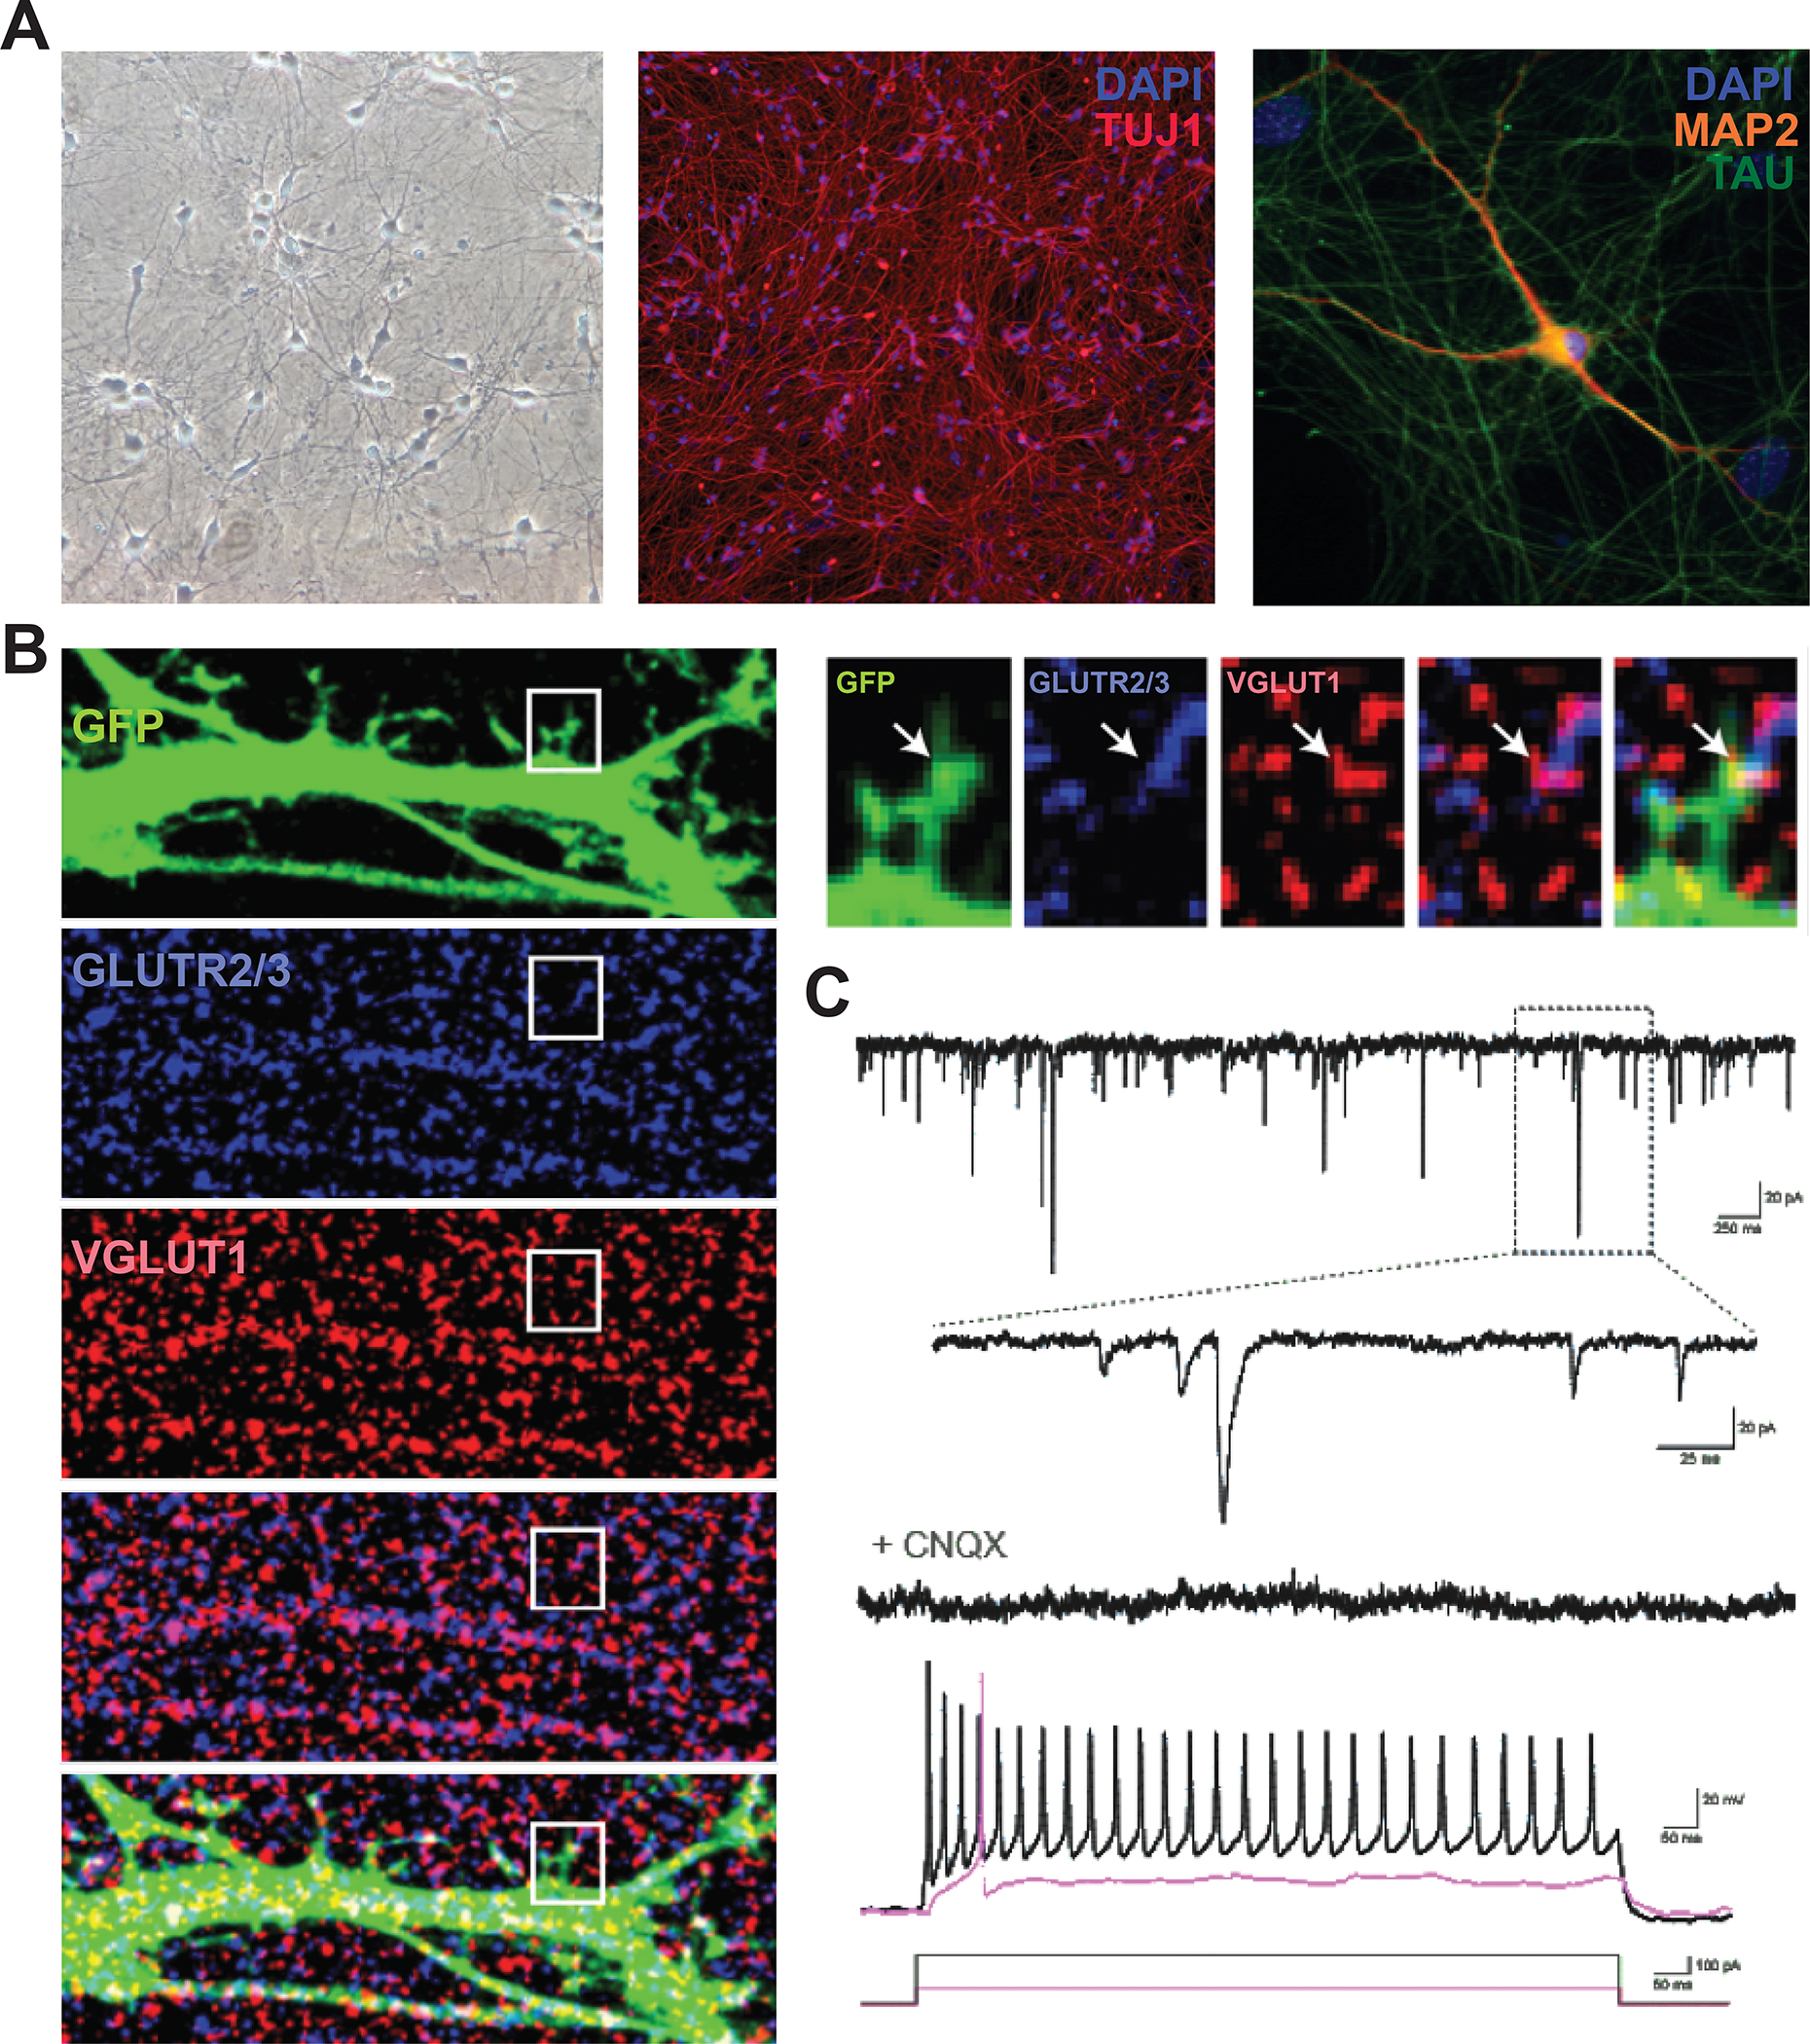
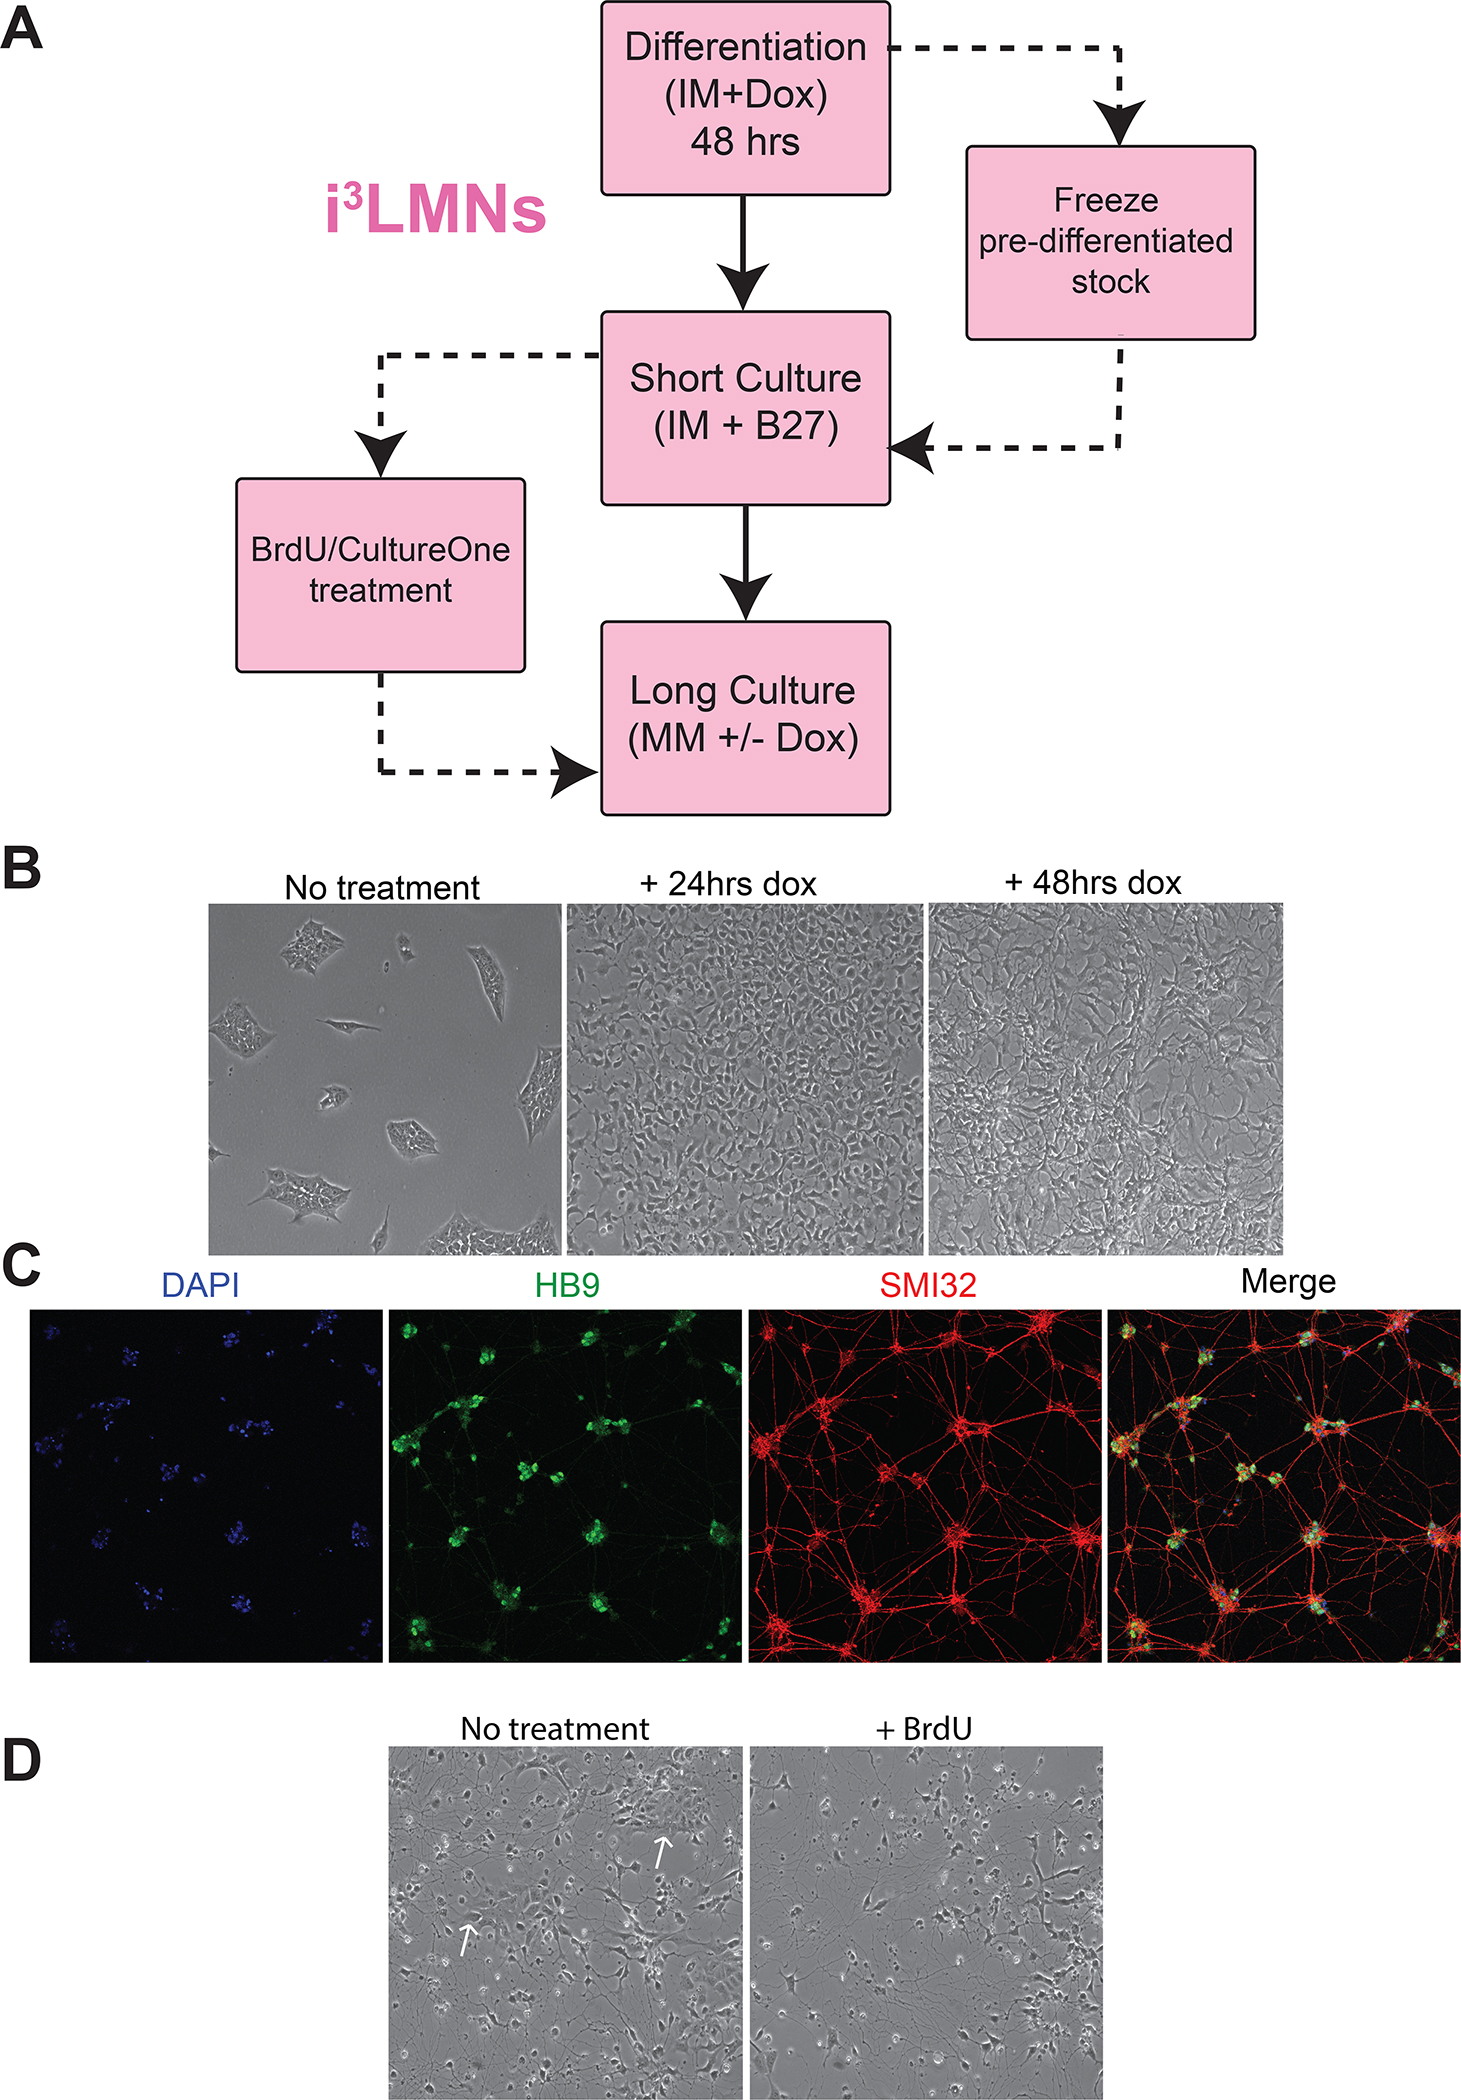
Accurate modeling of human neuronal cell biology has been a long-standing challenge. However, methods to differentiate human induced pluripotent stem cells (iPSCs) to neurons have recently provided experimentally tractable cell models. Numerous methods that use small molecules to direct iPSCs into neuronal lineages have arisen in recent years. Unfortunately, these methods entail numerous challenges, including poor efficiency, variable cell type heterogeneity, and lengthy, expensive differentiation procedures. We recently developed a new method to generate stable transgenic lines of human iPSCs with doxycycline-inducible transcription factors at safe-harbor loci. Using a simple two-step protocol, these lines can be inducibly differentiated into either cortical (i3 Neurons) or lower motor neurons (i3 LMN) in a rapid, efficient, and scalable manner (Wang et al., 2017). In this manuscript, we describe a set of protocols to assist investigators in the culture and genetic engineering of iPSC lines to enable transcription factor-mediated differentiation of iPSCs into i3 Neurons or i3 LMNs, and we present neuronal culture conditions for various experimental applications. © 2018 by John Wiley & Sons, Inc.

Keywords: i3LMN; i3Neurons; iPSC; iPSC-derived neurons; transcription factor-mediated differentiation.


Figures

Figure 1
Figure 1. Schematic of hiPSC culture maintenance
A. Workflow for routine hiPSC culture maintenance. Cells typically grow to confluence within 3–4 days after plating, and must be split in order to maintain health. Splitting can be done with either EDTA or accutase dissociation solutions. B. Time course for EDTA hiPSC dissociation. When edges of colony just begin to singularize (evidenced by bright halos around individual cells), cells are ready for EDTA aspiration and trituration in new media. Singularization of the entire colony (“overtreated”) results in lifting and loss of entire colony with EDTA aspiration. C. Time course for Accutase hiPSC dissociation. Cells are ready for trituration and collection only when entire colony has singularized. D. Images of spontaneous differentiation observed in hiPSC cultures. hiPSCs are typically small and form cobblestone-like colonies. Spontaneously differentiated cells (e.g. “flat cells”) are typically much larger and tend to form on the outskirts of healthy colonies.
Figure 2
Figure 2. Enrichment of transgenic iPSCs by magnetic streptavidin bead affinity
A. Workflow of positive and negative selection protocols. See protocol for considerations on key steps, such as cell number, bead volume, and incubation time. B. A mixed population of unedited cells and cells transfected with the Mag-hNIL construct and of unedited cells were incubated with streptavidin conjugated to AlexaFluor 488 and washed with PBS once. Staining is mostly specific for edited cells, and mApple is strongly co-expressed with SBP-LNGFR. C. Pure populations of cells with integrated Mag-hNIL or of unedited cells were incubated with streptavidin conjugated to AlexaFluor 488 and washed with PBS once before fluorescent imaging to confirm co-expression and specificity of streptavidin binding. D. A mixed population of cells was dissociated by EDTA, and the total, negative, and positive fractions were imaged and quantified. The total fraction contains 21% mApple-expressing cells, the negative fraction contains 17%, and the positive fraction contains 97%. The positive fraction was then plated, and multiple pure clones were observed following outgrowth. E. Pure populations of true positive (TP) or true negative (TN) cells were mixed at various ratios, and the enrichment protocol was performed as suggested. Total, negative, and positive fractions were collected from each sample and quantified for %TP by flow cytometry for mApple expression. Data shown is the difference between the total fraction and positive or negative fraction %TP, and maximum represents a pure positive fraction. Enrichment is highly predictable as a function of the initial %TP, with optimal gains in initial populations of 10–50%TP, often resulting in positive fractions >90%TP. It is also especially effective for rare populations in proportion to their initial %TP, resulting in up to 10-fold increases. F. The experiment from E was performed using the depletion protocol as suggested, and minimum represents a pure negative fraction. A similar predictable relationship was observed between initial %TP and reduction in the %TP of the negative fraction was observed, although low levels of cell recovery in high initial %TP samples resulted in increased variability and low cell recovery was observed at high initial %TP.
Figure 3
Figure 3. Transgenic hiPSC line development workflow
Overview of general workflow for hiPSC line development, from transfection to cell line purification and validation methods. Generation of a new line requires about 1 month, though high transfection efficiency and FACS or magnetic enrichment methods can accelerate this timeline significantly.
Figure 4
Figure 4. i3Neuron differentiation and culturing workflow
A. General workflow for i3Neuron differentiation and culturing. Freezing large batches of pre-differentiated (d3) i3Neurons is the preferred method, enabling reproducibility of multiple downstream experiments from a single round of differentiation. B. Brightfield images of i3Neurons throughout the differentiation process. Cells change morphology within 24 hours, and neurites can be identified within 48 hours. Note the drastic difference in neuritic elongation between d3 and d4. D3 neurons can be safely dissociated and frozen; florid neuritic elongation by d4 hinders singularization and makes these neurons susceptible to damage from the splitting process.
Figure 5
Figure 5. i3Neuron validation
A. Phase contrast and immunofluorescence images of d14 differentiated i3Neurons. Phase contrast image demonstrates neuronal morphology, and IF images demonstrate staining for characteristic cortical neuron markers (Tuj1, Map2, Tau). B. Dendritic spines in mature i3Neurons express pre- and postsynaptic markers of excitatory neurons C. Mature i3Neurons co-cultured with astrocytes exhibit spontaneous excitatory currents that can be inhibited by CNQX, a glutamate receptor antagonist. D. i3Neurons can fire spontaneous trains of action potentials
Figure 6
Figure 6. i3LMN validation
A. General workflow for i3LMN differentiation and culturing. Note key differences vs i3Neurons, including shorter doxycycline differentiation period, different medias for initial replating and long-term culture, and option for BrdU treatment to eliminate mitotically active cells. B. Time course for i3LMN differentiation. Note rapid dispersal and morphological change after 24 hours, as well as formation of nascent neuritic extensions by 48 hours. C. i3LMNs stain for characteristic lower motor neuron markers, including Hb9 and Smi32. D. Effect of BrdU on i3LMN culture purity. Small colonies of undifferentiated iPSCs or other mitotically active differentiated species can quickly take over a culture of i3LMNs. Treatment with BrdU rapidly extinguishes these cell populations with little toxicity to i3LMNs.

Similar articles

Cited by

References

    1. Wang C, et al. Scalable Production of iPSC-Derived Human Neurons to Identify Tau-Lowering Compounds by High-Content Screening. Stem Cell Reports. 2017;9:1221–1233. - PMC - PubMed
    1. Kitazawa M, Medeiros R, Laferla FM. Transgenic mouse models of Alzheimer disease: developing a better model as a tool for therapeutic interventions. Curr Pharm Des. 2012;18:1131–1147. - PMC - PubMed
    1. D’Alton S, et al. Divergent phenotypes in mutant TDP-43 transgenic mice highlight potential confounds in TDP-43 transgenic modeling. PLoS ONE. 2014;9:e86513. - PMC - PubMed
    1. Kloskowska E, et al. Cognitive impairment in the Tg6590 transgenic rat model of Alzheimer’s disease. J Cell Mol Med. 2010;14:1816–1823. - PMC - PubMed
    1. Nuber S, et al. A progressive dopaminergic phenotype associated with neurotoxic conversion of α-synuclein in BAC-transgenic rats. Brain. 2013;136:412–432. - PMC - PubMed

Publication types