

Exposure to elevated glucose concentrations alters the metabolomic profile of bovine blastocysts
- PMID: 29924852
- PMCID: PMC6010268
- DOI: 10.1371/journal.pone.0199310
Exposure to elevated glucose concentrations alters the metabolomic profile of bovine blastocysts
Abstract
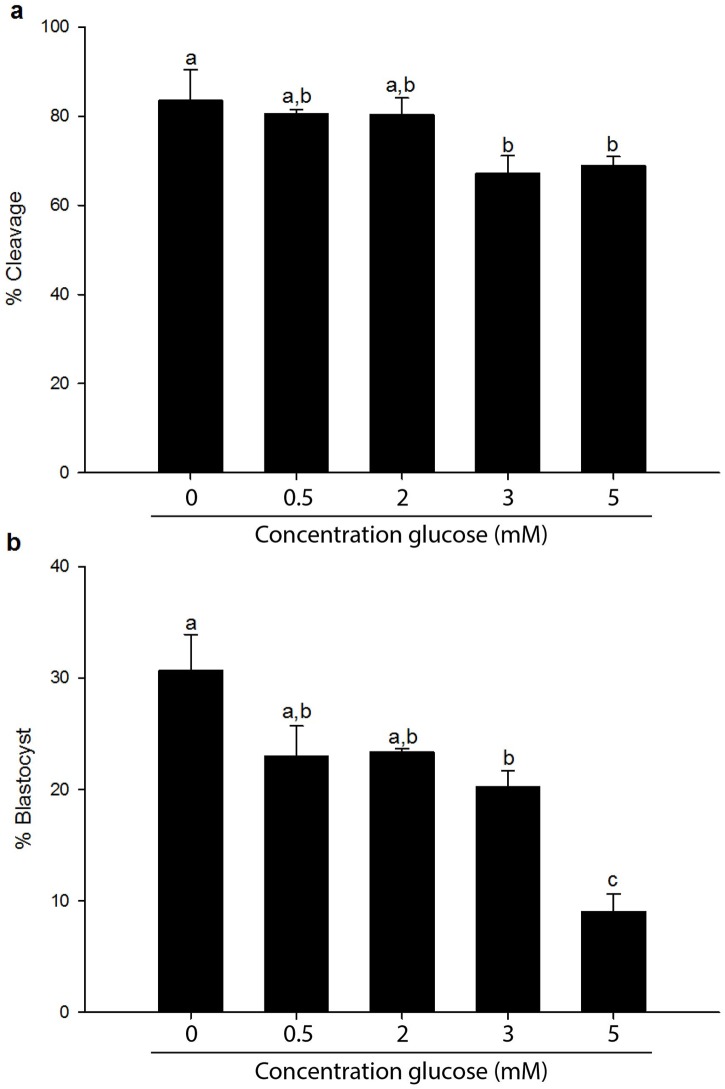
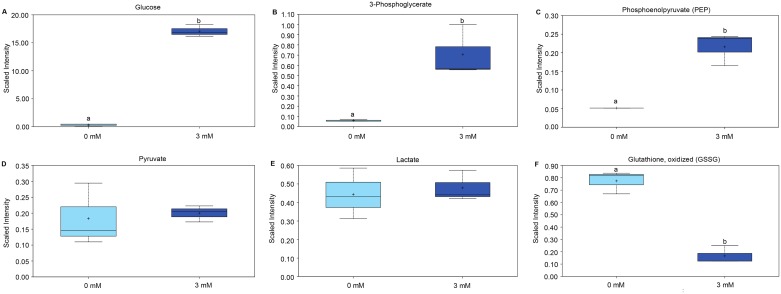
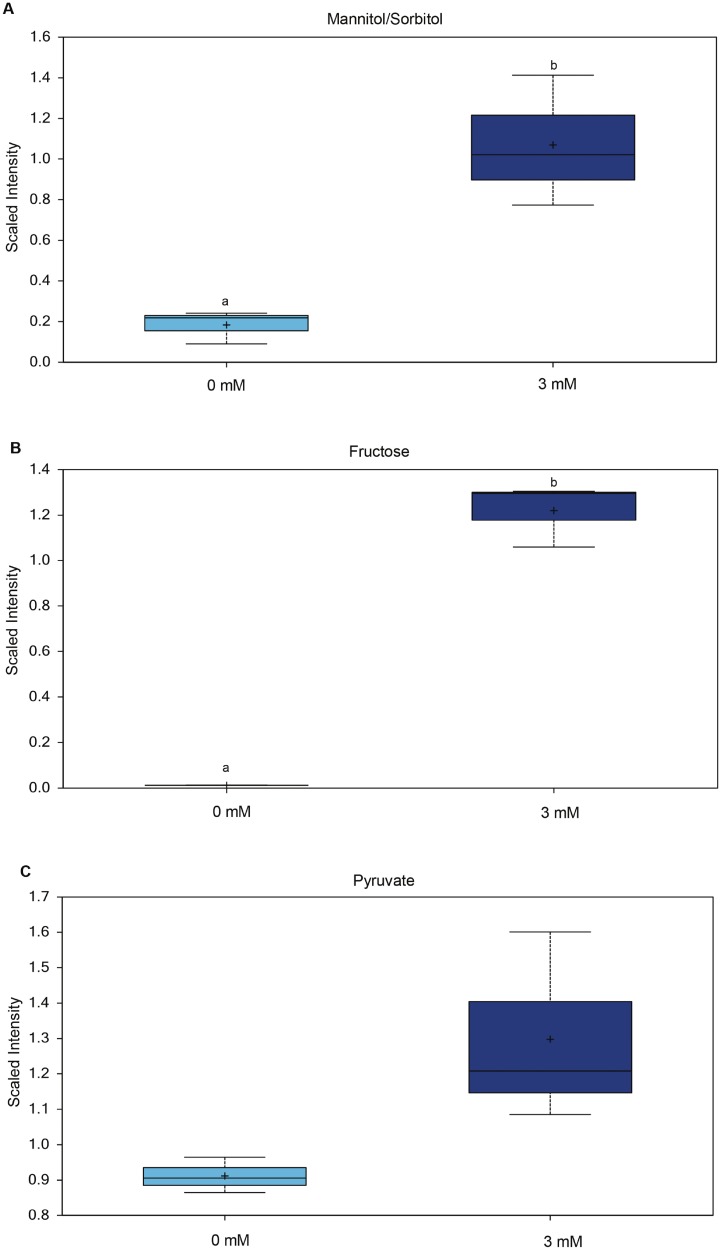
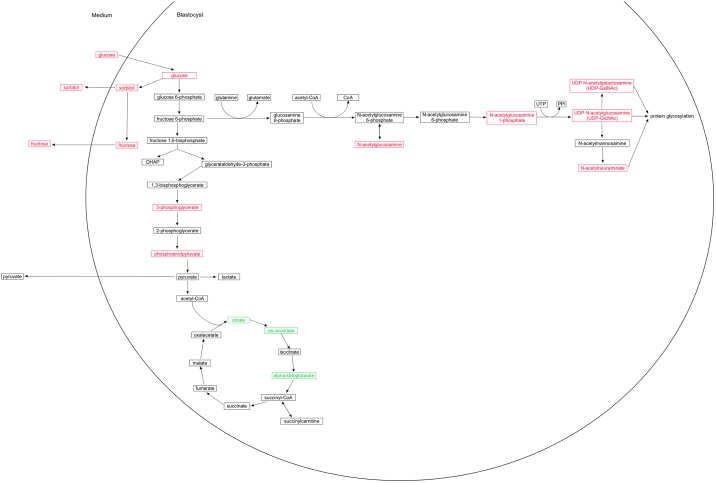
Chronically high blood glucose concentrations are a characteristic of diabetes mellitus. Maternal diabetes affects the metabolism of early embryos and can cause a delay in development. To mimic maternal diabetes, bovine in vitro fertilization and embryo culture were performed in fertilization medium and culture medium containing 0.5, 2, 3, and 5 mM, glucose whereas under control conditions, the medium was glucose free (0 mM). Compared to control conditions (0 mM, 31%), blastocyst development was decreased to 23% with 0.5 and 2 mM glucose. Presence of 3 or 5 mM glucose in the medium resulted in decreased blastocyst rates (20% and 10% respectively). The metabolomic profile of resulting day 8 blastocysts was analysed by UPLC-MS/MS, and compared to that of blastocysts cultured in control conditions. Elevated glucose concentrations stimulated an increase in glycolysis and activity of the hexosamine pathway, which is involved in protein glycosylation. However, components of the tricarboxylic acid cycle, such as citrate and alpha-ketoglutarate, were reduced in glucose stimulated blastocysts, suggesting that energy production from pyruvate was inefficient. On the other hand, activity of the polyol pathway, an alternative route to energy generation, was increased. In short, cattle embryos exposed to elevated glucose concentrations during early development showed changes in their metabolomic profile consistent with the expectations of exposure to diabetic conditions.
Conflict of interest statement
The authors have declared that no competing interests exist.
Figures
Similar articles
-
Differential gene expression profile in bovine blastocysts resulting from hyperglycemia exposure during early cleavage stages.Biol Reprod. 2012 Feb 29;86(2):50. doi: 10.1095/biolreprod.111.094391. Print 2012 Feb. Biol Reprod. 2012. PMID: 22075474
-
Developmental kinetics of cleavage stage mouse embryos are related to their subsequent carbohydrate and amino acid utilization at the blastocyst stage.Hum Reprod. 2015 Mar;30(3):543-52. doi: 10.1093/humrep/deu334. Epub 2015 Jan 6. Hum Reprod. 2015. PMID: 25567621
-
Substrate utilization in porcine embryos cultured in NCSU23 and G1.2/G2.2 sequential culture media.Mol Reprod Dev. 2001 Mar;58(3):269-75. doi: 10.1002/1098-2795(200103)58:3<269::AID-MRD4>3.0.CO;2-L. Mol Reprod Dev. 2001. PMID: 11170267
-
Early cleavages influence the molecular and the metabolic pattern of individually cultured bovine blastocysts.Mol Reprod Dev. 2016 Apr;83(4):324-36. doi: 10.1002/mrd.22619. Epub 2016 Mar 11. Mol Reprod Dev. 2016. PMID: 26822777
-
Comparative studies of embryo metabolism in early pregnancy.J Reprod Fertil Suppl. 1981;29:203-13. J Reprod Fertil Suppl. 1981. PMID: 7014867 Review.
Cited by
-
Non-Enzymatic Phenylboronic Acid-Based Optode Membrane for Glucose Monitoring in Serums of Diabetic Patients and in the Culture Medium of Human Embryos.Sensors (Basel). 2022 Sep 21;22(19):7135. doi: 10.3390/s22197135. Sensors (Basel). 2022. PMID: 36236234 Free PMC article.
-
The Effect of Endometrial Cell Culture on α3 and β1 integrin Genes and Protein Expression in Type 2 Diabetic Rats at The Time of Implantation.Cell J. 2022 Jan;24(1):22-27. doi: 10.22074/cellj.2022.7445. Cell J. 2022. PMID: 35182061 Free PMC article.
-
The PPARδ Agonist GW501516 Improves Lipolytic/Lipogenic Balance through CPT1 and PEPCK during the Development of Pre-Implantation Bovine Embryos.Int J Mol Sci. 2019 Dec 2;20(23):6066. doi: 10.3390/ijms20236066. Int J Mol Sci. 2019. PMID: 31810173 Free PMC article.
-
Metabolomic Profile of Oviductal Extracellular Vesicles across the Estrous Cycle in Cattle.Int J Mol Sci. 2019 Dec 16;20(24):6339. doi: 10.3390/ijms20246339. Int J Mol Sci. 2019. PMID: 31888194 Free PMC article.
-
Nutrient requirements in Hanwoo cows with artificial insemination: effects on blood metabolites and embryo recovery rate.J Anim Sci Technol. 2020 Jul;62(4):449-459. doi: 10.5187/jast.2020.62.4.449. Epub 2020 Jul 31. J Anim Sci Technol. 2020. PMID: 32803177 Free PMC article.
References
-
- IDF (2015) IDF Diabetes Atlas. Int Diabetes Fed.
-
- Greene MF (1999) Spontaneous abortions and major malformations in women with diabetes mellitus. Semin Reprod Endocrinol 17:127–136 doi: 10.1055/s-2007-1016220 - DOI - PubMed
-
- Hornnes PJ, Kuhl C (1986) Gastrointestinal hormones and cortisol in normal pregnant women and women with gestational diabetes. Acta Endocrinol Suppl (Copenh) 277:24–26 - PubMed
-
- Ramin N, Thieme R, Fischer S, Schindler M, Schmidt T, Fischer B, et al. (2010) Maternal diabetes impairs gastrulation and insulin and IGF-I receptor expression in rabbit blastocysts. Endocrinology 151:4158–4167 doi: 10.1210/en.2010-0187 - DOI - PubMed
-
- Carlson D, Black DL, Howe GR (1970) Oviduct secretion in the cow. J Reprod Fertil 22:549–552 - PubMed
Publication types
MeSH terms
Substances
LinkOut - more resources
Full Text Sources
Other Literature Sources
